. 2023 Mar 2;8(10):9597-9606.
doi: 10.1021/acsomega.3c00141. eCollection 2023 Mar 14.

Cu/CuO-Doped ZnO Nanocomposites via Solution Combustion Synthesis for Catalytic 4-Nitrophenol Reduction

Affiliations

Cu/CuO-Doped ZnO Nanocomposites via Solution Combustion Synthesis for Catalytic 4-Nitrophenol Reduction

Buzuayehu Abebe et al. ACS Omega. .

Abstract

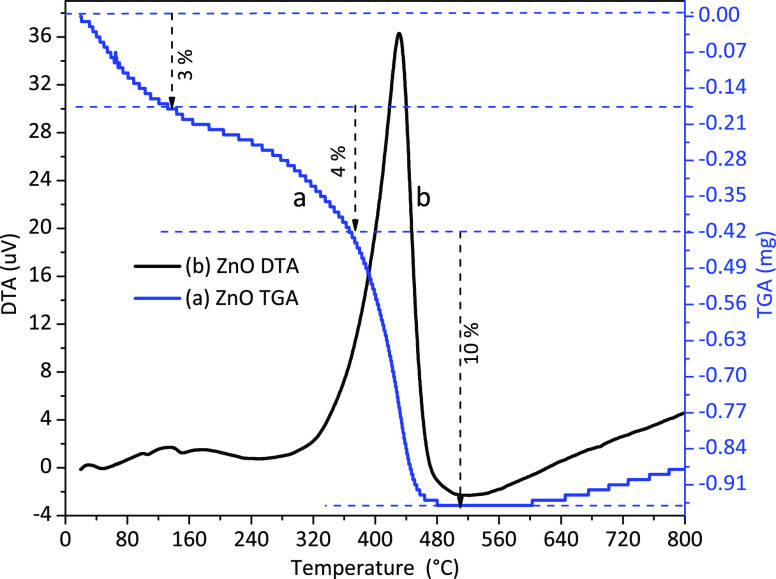
The synthesis of optoelectrically enhanced nanomaterials should be continuously improved by employing time- and energy-saving techniques. The porous zinc oxide (ZnO) and copper-doped ZnO nanocomposites (NCs) were synthesized by the time- and energy-efficient solution combustion synthesis (SCS) approach. In this SCS approach, once the precursor-surfactant complex ignition point is reached, the reaction starts and ends within a short time without the need for any external energy. The TGA-DTA analysis confirmed that 500 °C was the point at which stable metal oxide was obtained. The doping and heterojunction strategy improved the optoelectric properties of the NCs more than the individual constituents, which then enhanced the materials' charge transfer and optical absorption capabilities. The porosity, nanoscale crystallite size (15-50 nm), and formation of Cu/CuO-ZnO NCs materials were confirmed from the XRD, SEM, and TEM/HRTEM analyses. The obtained d-spacing values of 0.275 and 0.234 nm confirm the formation of ZnO and CuO crystals, respectively. The decrease in photoluminescence intensity for the doped NCs corroborates a reduction in electron-hole recombination. On the Mott-Schottky analysis, the positive slope for ZnO confirms the n-type character, while the negative and positive slopes of the NCs confirm the p- and n-type characters, respectively. A diffusion-controlled type of charge transfer process on the electrode surface was confirmed from the cyclic voltammetric analysis. Thus, the overall analysis shows the applicability of the less expensive and more efficient SCS for several applications, such as catalysis and sensors. To confirm this, an organic catalytic reduction reaction of 4-nitrophenol to 4-aminophenol was tested. Within three and a half minutes, the catalytic reduction result showed the great potential of NCs over ZnO NPs. Thus, the energy- and time-saving SCS approach has a great future outlook as an industrial pollutant catalytic reduction application.


Conflict of interest statement

The authors declare no competing financial interest.

Figures

Scheme 1
Scheme 1. Simplified Scheme of the SCS Process Reprinted with permission from ref (19). Copyright 2021 Springer Nature.
Sol formation by mixing the surfactant, precursors, and fuels; foam formation during dehydration at 105 °C; combustion by gently increasing the temperature up to the PVA/fuel–precursor complex ignition temperature; formation of a porous product by gas evolution.
Figure 1
Figure 1
Thermal stability analysis: thermogravimetric (inset label a) and deferential thermal analysis (inset label b) plots of ZnO NPs synthesized using the poly(vinyl alcohol) polymer as a stabilizing agent. The decomposition study was conducted for ZnO-poly (vinyl alcohol) polymer composites before calcination. The optimum decomposition temperature range was determined to be 450–500 °C.
Figure 2
Figure 2
NP and NC structural analysis: (a) XRD patterns of poly(vinyl alcohol), ZnO and CuO NPs, and 1 and 10% Cu-doped ZnO NCs synthesized without urea and (b) magnified view of ZnO NPs and 1 and 10% Cu-doped ZnO NCs. PVA, 1, and 10 in the inset label represent poly(vinyl alcohol) and 1 and 10% copper, respectively. The presence of copper in the ZnO lattice was confirmed by the low-angle shift, and the presence of the CuO peak confirmed the heterojunction for 10% doped NCs. (c) VESTA 3D visualization software was used to create cif data-based structures of stable ZnO and CuO; gray is for Zn, red is for O, and blue is for Cu.
Figure 3
Figure 3
DRS-UV–vis analysis: (a) percent reflectance vs wavelength plots of ZnO NPs and doped NCs and (b, c) direct and indirect Kubelka–Munk function plots of ZnO NPs and doped NCs. The redshift for doped NCs on the Kubelka–Munk function indicates the inclusion of copper in the ZnO lattice. The inset label 10 represents the 10% doped copper.
Figure 4
Figure 4
Photoluminescence (PL) analysis of NPs and 10% doped NCs: (a) intensity vs wavelength PL plots of ZnO NPs (synthesized with and without urea) and copper-doped ZnO NCs (1 and 10%) and (b–d) deconvoluted spectra for ZnO, ZnOu, and 1% copper-doped ZnO NCs. This visible peak increment with decreasing UV peak intensity for NCs (1%) confirms the inclusion of copper in the ZnO lattice.
Figure 5
Figure 5
ZnO NP and 10% doped NC scanning electron microscopy (SEM) morphological analysis: The SEM image shows the foam type of porous morphology for 10% Cu-doped ZnO NCs. From close observation, the presence of different pores was observed, which is due to the evolution of gaseous byproducts.
Figure 6
Figure 6
ZnO NPs’ transmission electron microscopy (TEM) morphological analysis: (a) In the TEM image, the presence of some pores is observed. (b) In the SAED ring image, the spots on the ring indicate the crystallinity; the inset in panel b is the XRD pattern. (c) In the high-resolution TEM image, the d-spacing analysis shows that all the crystallites are for ZnO NPs.
Figure 7
Figure 7
The 10% doped NCs underwent transmission electron microscopy (TEM) morphological analysis: (a) In the TEM image, the presence of pores is observed due to the evolution of gases. (b) In the SAED ring image, the spots on the ring indicate the crystallinity; the inset in panel b is the XRD pattern. (c) In the high-resolution TEM image, the d-spacing analysis shows the presence of both ZnO and CuO NP crystallites.
Figure 8
Figure 8
Chemical bonding and functional group analysis: (a) ATR-FTIR spectra of ZnO NPs before and after calcination and calcined 10% doped NCs. The inset in panel (a) is a magnified view of high wavenumber spectra, and panel (b) shows a magnified view of low wavenumber spectra. The band measured between 1570 and 1390 cm–1 vanished due to PVA decomposition. The peak for Zn–O/Cu–O detected and the wavenumber shift for the calcined sample show stability enhancement.
Figure 9
Figure 9
Electrochemical analysis using cyclic voltammetry (CV): (a) CV plots of ZnO NPs. The inset is the fluorine-doped tin oxide (FTO) bare electrode CV plot. (b) CV plots of 10% doped NCs. The inset is the magnified view at higher potential. (c) 10% doped NC anodic peak current and square root linear plot. (d) 10% doped NC log peak current versus log scan rate linear plot. The dominance of the diffusion-controlled charge transfer process is confirmed from the good fitting of the peak current versus square root of the scan rate and log peak current versus log scan rate.
Figure 10
Figure 10
4-Nitrophenol catalytic reduction plots of (a) ZnO NPs and (b) Cu-doped ZnO NCs: the NCs show complete reduction of 4-nitrophenol to 4-aminophenol within three and a half minutes.
Figure 11
Figure 11
Possible 4-nitrophenol to 4-aminophenol conversion mechanism. During the catalytic reduction process, NaBH4 acts as a H2 source and the metal nanoparticles as a catalyst. Reprinted with permission from ref (1). Copyright 2022 Royal Society of Chemistry.

References

    1. Mejía Y. R.; Reddy Bogireddy N. K. Reduction of 4-Nitrophenol Using Green-Fabricated Metal Nanoparticles. RSC Adv. 2022, 12, 18661–18675. 10.1039/D2RA02663E. - DOI - PMC - PubMed
    1. Chen Y.; Feng L.; Sadeghzadeh S. M. Reduction of 4-Nitrophenol and 2-Nitroaniline Using Immobilized CoMn 2 O 4 NPs on Lignin Supported on FPS. RSC Adv. 2020, 10, 19553–19561. 10.1039/D0RA01136C. - DOI - PMC - PubMed
    1. Bagheri M.; Melillo A.; Ferrer B.; Masoomi M. Y.; Garcia H. Quasi-HKUST Prepared via Postsynthetic Defect Engineering for Highly Improved Catalytic Conversion of 4-Nitrophenol. ACS Appl. Mater. Interfaces 2022, 14, 978–989. 10.1021/acsami.1c19862. - DOI - PMC - PubMed
    1. Wang Z.; Su R.; Wang D.; Shi J.; Wang J.-X.; Pu Y.; Chen J.-F. Sulfurized Graphene as Efficient Metal-Free Catalysts for Reduction of 4-Nitrophenol to 4-Aminophenol. Ind. Eng. Chem. Res. 2017, 56, 13610–13617. 10.1021/acs.iecr.7b03217. - DOI
    1. Jassby D.; Cath T. Y.; Buisson H. The Role of Nanotechnology in Industrial Water Treatment. Nat. Nanotechnol. 2018, 13, 670–672. 10.1038/s41565-018-0234-8. - DOI - PubMed