. 2023 Mar 13;3(1):vbad026.
doi: 10.1093/bioadv/vbad026. eCollection 2023.

Phylostems: a new graphical tool to investigate temporal signal of heterochronous sequences datasets

Affiliations

Phylostems: a new graphical tool to investigate temporal signal of heterochronous sequences datasets

Anna Doizy et al. Bioinform Adv. .

Abstract

Motivation: Molecular tip-dating of phylogenetic trees is a growing discipline that uses DNA sequences sampled at different points in time to co-estimate the timing of evolutionary events with rates of molecular evolution. Importantly, such inferences should only be performed on datasets displaying sufficient temporal signal, a feature important to test prior to any tip-dating inference. For this purpose, the most popular method considered to-date has been the 'root-to-tip regression' which consist in fitting a linear regression of the number of substitutions accumulated from the root to the tips of a phylogenetic tree as a function of sampling times. The main limitation of the regression method, in its current implementation, relies in the fact that the temporal signal can only be tested at the whole-tree scale (i.e. its root).

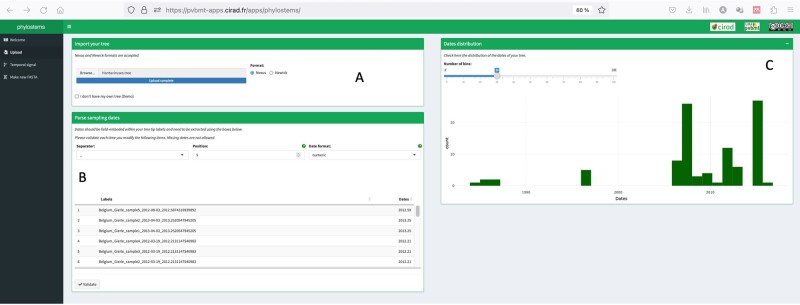
Results: To overcome this limitation we introduce Phylostems, a new graphical user-friendly tool developed to investigate temporal signal within every clade of a phylogenetic tree. We provide a 'how to' guide by running Phylostems on an empirical dataset and supply guidance for results interpretation.

Availability and implementation: Phylostems is freely available at https://pvbmt-apps.cirad.fr/apps/phylostems.


Figures

Fig. 1.
Fig. 1.
Phylostems rationale and workflow. (A) Let’s a tree (left panel) be constructed from a dataset of heterochronous sequences. When investigating temporal signal on the whole tree using the regular root-to-tip regression method (right panel), no significant signal is found as illustrated by the non-positive regression slope (black dotted line). Hence, tip-based inferences should not be performed at the whole tree timescale. However, as illustrated by the red and blue positive regression slopes calculated on two clade subsets (red and blue squares on the tree), positive temporal signal might exist at reduced timescales at which thorough tip-based inferences may be performed. The main objective of Phylostems is to provide the user with a graphical tool to detect without a priori such clades of interest. (B) Schematic representation of Phylostems workflow. Main boxes (‘Upload’, ‘Temporal signal’ and ‘Make new FASTA’) represent the internal structure of the application organized in three main panels. Major tasks performed in each panel are summarized along with sourced R packages
Fig. 2.
Fig. 2.
Phylostems’s upload panel requesting the user to load a phylogenetic tree (A) and specify tip sampling dates from field-embedded values (B). Once loaded, a distribution of sampling dates is plotted allowing for a visual check of sequences temporal width (C)
Fig. 3.
Fig. 3.
Phylostems results for the Hantaviruses dataset. (A) Annotated phylogenetic tree. Coloured circles indicate nodes at which temporal signal was found. (B) Summary table listing nodes with temporal signal and their associated statistical parameters. (C) Root-to-tip regression at node highlighted by the red arrow. Both the tree and the regression plots are linked, so that data points (or tree tips) selected in one plot will automatically be highlighted on the other one, as illustrated by the red-dotted frames

References

    1. Buonagurio D.A. et al (1986) Evolution of human influenza a viruses over 50 years: Rapid, uniform rate of change in NS gene. Science, 232, 980–982. 10.1126/science.2939560 - DOI - PubMed
    1. Chang W. et al. (2018) shiny: Web Application Framework for R. Comprehensive R Archive Network (CRAN). https://cran.r-project.org/package=shiny
    1. Drummond A.J. et al. (2003a) Inference of viral evolutionary rates from molecular sequences. Adv. Parasitol., 54, 331–358. - PubMed
    1. Drummond A.J. et al. (2003b). Measurably evolving populations. Trends Ecol. Evol., 18, 481–488.
    1. Duchêne S. et al. (2015) The performance of the date-randomization test in phylogenetic analyses of time-structured virus data. Mol. Biol. Evol., 32, 1895–1906. 10.1093/molbev/msv056 - DOI - PubMed