. 2023 Mar 16;3(3):444-458.
doi: 10.1158/2767-9764.CRC-22-0480. eCollection 2023 Mar.

Plexin-B1 Mutation Drives Metastasis in Prostate Cancer Mouse Models

Affiliations

Plexin-B1 Mutation Drives Metastasis in Prostate Cancer Mouse Models

Boris Shorning et al. Cancer Res Commun. .

Abstract

Metastatic prostate cancer is essentially incurable and is a leading cause of cancer-related morbidity and mortality in men, yet the underlying molecular mechanisms are poorly understood. Plexins are transmembrane receptors for semaphorins with divergent roles in many forms of cancer. We show here that prostate epithelial cell-specific expression of a mutant form of Plexin-B1 (P1597L) which was identified in metastatic deposits in patients with prostate cancer, significantly increases metastasis, in particular metastasis to distant sites, in two transgenic mouse models of prostate cancer (PbCre+Ptenfl /flKrasG12V and PbCre+Ptenfl /flp53fl/ fl ). In contrast, prostate epithelial cell-specific expression of wild-type (WT) Plexin-B1 in PbCre+Ptenfl /flKrasG12V mice significantly decreases metastasis, showing that a single clinically relevant Pro1597Leu amino-acid change converts Plexin-B1 from a metastasis-suppressor to a metastasis-promoter. Furthermore, PLXNB1P1597L significantly increased invasion of tumor cells into the prostate stroma, while PLXNB1WT reduced invasion, suggesting that Plexin-B1 has a role in the initial stages of metastasis. Deletion of RhoA/C or PDZRhoGEF in Ptenfl /flKrasG12VPLXNB1P1597L mice suppressed metastasis, implicating the Rho/ROCK pathway in this phenotypic switch. Germline deletion of Plexin-B1, to model anti-Plexin-B1 therapy, significantly decreased invasion and metastasis in both models. Our results demonstrate that Plexin-B1 plays a complex yet significant role in metastasis in mouse models of prostate cancer and is a potential therapeutic target to block the lethal spread of the disease.

Significance: Few therapeutic targets have been identified specifically for preventing locally invasive/oligometastatic prostate cancer from becoming more widely disseminated. Our findings suggest Plexin-B1 signaling, particularly from the clinically relevant P1597L mutant, is such a target.


Figures

FIGURE 1
FIGURE 1
PLXNB1P1597L expression suppresses prostate tumor proliferation and extends survival in Ptenfl/flKrasG12V mice. A, Schematic diagram of generation of Ptenfl/flKrasG12VPLXNB1WT and Ptenfl/flp53fl/flPLXNB1P1597L mice. B–I, Hematoxylin and eosin (H&E) histology of primary prostate tumors. B and C, Invasive adenocarcinoma in Ptenfl/flKrasG12V prostates at day 100 timepoint before the onset of metastasis; invasive tumor tissue is marked with triangular arrows [scale bar: 500 μm (B), 200 μm (C)]. D, Ages Ptenfl/flKrasG12V prostate (6–7 months) showing region of sarcomatoid carcinoma (scale bar: 200 μm). E,Ptenfl/flKrasG12VPLXNB1WT prostate, signs of invasion were rare (marked with an arrow) in this cohort and stromal reaction was diminished (scale bar: 200 μm). F and G, Widespread invasion of glandular neoplastic cells (marked with arrows) into the stroma in Ptenfl/flKrasG12VPLXNB1P1597L prostates at the day 100 timepoint [scale bar: 500 μm (F), 200 μm (G)]. H and I, Heterogeneous prostate tumors in ages (>6 months old) Ptenfl/flKrasG12VPLXNB1P1597L mouse showing sarcomatoid phenotype (H, scale bar: 500 μm) or a mixture of adenomatous, sarcomatoid, and squamous phenotypes (I, scale bar: 500 μm)]. J, Kaplan–Meier survival curves for Ptenfl/flKrasG12V (n = 20), Ptenfl/flKrasG12VPLXNB1WT (n = 22), and Ptenfl/flKrasG12VPLXNB1P1597L (n = 28) cohorts. Primary prostate tumor growth was the major reason for euthanasia. The increase in survival of the Ptenfl/flKrasG12VPLXNB1P1597L cohort (median survival 226.5 days) compared with the Ptenfl/flKrasG12V cohort (median 182 days) is significant (log-rank test: z = 2.44, P = 0.0148, 95% confidence interval). K,Ki67 antigen staining and quantitation of proliferation rates for prostate epithelium of 100-day-old mice from control, PLXNB1WT, PLXNB1P1597L, Ptenfl/flKrasG12V, Ptenfl/flKrasG12VPLXNB1WT, and Ptenfl/flKrasG12VPLXNB1P1597L mice.
FIGURE 2
FIGURE 2
PLXNB1P1597L expression suppresses prostate tumor proliferation and extends survival in Ptenfl/flp53fl/fl mice. A, Schematic diagram of generation of Ptenfl/flp53fl/flPLXNB1P1597L mice. B–I, H&E histology of primary prostate tumors in Ptenfl/flp53fl/fl cohorts. B and C, Invasive adenocarcinoma in Ptenfl/flp53fl/fl mouse prostate at day 100 timepoint showing sarcomatoid deposits next to the epithelium [marked with arrows; scale bar: 500 μm (B), 100 μm (C)]. D and E, Sarcomatoid carcinoma in prostates of 6-month-old Ptenfl/flp53fl/fl mice [scale bar: 500 μm (D), 50 μm (E)]. F and G, Invasive adenocarcinoma in mouse prostates at day 100 timepoint in Ptenfl/flp53fl/flPLXNB1P1597L mice; sarcomatoid cells marked by arrows [scale bar: 500 μm (F), 50 μm (G)]. H and I, Widespread epithelial invasion into stroma and pronounced expansion of sarcomatoid mass combined with squamous differentiation of epithelium in prostates of 7-month-old Ptenfl/flp53fl/flPLXNB1P1597L mice, scale bar: 500 μm (H), 50 μm (I). J, Kaplan–Meier survival curves for Ptenfl/flp53fl/fl (n = 30) and Ptenfl/flp53fl/flPLXNB1P1597L (n = 29) cohorts. The increase in survival of the Ptenfl/flp53fl/flPLXNB1P1597L cohort (median 211 days) compared with Ptenfl/flp53fl/fl (median 177 days) is significant (log-rank test, z = 4.86, P < 0.001, 95% confidence interval). K,Ki67 antigen staining and quantitation of proliferation rates for prostate epithelium of 100-day-old Ptenfl/flp53fl/fl and Ptenfl/flp53fl/flPLXNB1P1597L mice PLXNB1P1597L expression suppressed proliferation in the Ptenfl/flp53fl/fl background. *, P < 0.05 (t test, n = 3, mean ± SD). Scale bars = 100 μm.
FIGURE 3
FIGURE 3
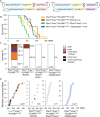
PLXNB1P1597L increases metastasis whereas PLXNB1WT expression suppresses metastasis in Ptenfl/flKrasG12V mouse models of prostate cancer (see also Supplementary Fig. S3–S5). A, Schematic diagram of crosses performed. B, Percentages of animals affected/not affected by metastasis in Ptenfl/flKrasG12V cohorts. Following necropsy, mice were categorized according to their metastatic outcome: no metastatic deposits (white), lymph node metastasis (orange), lymph node metastasis combined with invasion into peritoneum or pelvic muscle (purple), combined lymph node and lung metastasis (brown), animals with both lymph node and lung metastasis combined with invasion into peritoneum or pelvic muscle (black). C, Timing and type of metastatic deposits in Ptenfl/flKrasG12V cohorts. D, Typical epithelial gland-like metastasis in lymph node from Ptenfl/flKrasG12V cohort. Rare sarcomatoid nodules in lymph nodes (E) combined with sarcomatoid metastases in the lung (F) observed in a single mouse (of 20) in the Ptenfl/flKrasG12V cohort scale bar: 200 μm. Heterogeneous lumbar lymph node metastases from Ptenfl/flKrasG12VPLXNB1P1597L mice, including mixed epithelial/sarcomatoid deposits (G), sarcomatoid (H), and squamous metaplasia (I) [scale bar: 200 μm (GI)]. Organ metastasis and local invasion in Ptenfl/flKrasG12VPLXNB1P1597L mice showing lung metastatic deposit with sarcomatoid (J) and squamous histology (K), abdominal metastasis adjoining pancreas (L) and prostate tumor invading urethra (M). Scale bar: 200 μm (JL), 500 μm (M). N, The single lymph node deposit observed in the Ptenfl/flKrasG12VPlxnB1WTcohort (scale bar: 200 μm).
FIGURE 4
FIGURE 4
PLXNB1P1597L increases metastasis in Ptenfl/flp53fl/fl mouse models of prostate cancer (see also Supplementary Fig. S6 and S7). A, Schematic diagram of crosses performed. B, Percentage of animals affected/not affected by metastasis in Ptenfl/flp53fl/fl cohorts: no metastatic deposits (white), lymph node metastasis (orange), invasion into peritoneum or pelvic muscle (blue), lymph node metastasis combined with invasion into peritoneum or pelvic muscle (purple). C, Timing and type of metastatic deposits in Ptenfl/flp53fl/fl cohorts. See Table 1 for statistical analyses. Prostate sarcomatoid deposits on the perimeter of a lumbar lymph node (D and E) and adjoining spleen (F) in Ptenfl/flp53fl/fl mouse, scale bar: 500 μm (D), 200 μm (E and F). Metastatic deposits in lumbar lymph nodes (G) and on the node perimeter invading to peritoneum (H), peritoneum (I), pancreas (J), and sarcomatoid prostate tumor invading pelvic muscle (K) of Ptenfl/flp53fl/flPLXNB1P1597L mice [scale bar: 500 μm (G), 200 μm (HK)].
FIGURE 5
FIGURE 5
PLXNB1P1597L expression in the mouse prostate epithelium of Ptenfl/flKrasG12V and Ptenfl/flp53fl/fl mice promotes local invasion by prostate tumor cells and myosin phosphorylation. A–F, Immunostaining of prostates of 100-day-old mice with cytokeratin AE1/AE3 (pan-cytokeratin) to identify prostate epithelial cells breaking basement membrane and invading stroma in Ptenfl/fl KrasG12V(A–C) and Ptenfl/flp53fl/fl cohorts (E and F). Invading cells are indicated with arrowheads. Scale bars, 50 μm. Quantitation in the Ptenfl/flKrasG12V and Ptenfl/flp53fl/fl backgrounds shown in D and G, respectively. Pan-cytokeratin positive cells breaking the basement membrane or located inside the stromal compartment were counted and divided by total number of pan-cytokeratin positive cells. *, P < 0.05 (t test, n = 3, mean ± SD). Scale bars: 50 μm. H–M, Immunostaining of mouse prostates for phospho-Myosin Light Chain 2 (Ser19; phospho-MLC2Ser19) to identify levels of cell contractility and Rho-kinase (ROCK) activation in Ptenfl/flKrasG12V cohorts at 100 days (H–J) and Ptenfl/flp53fl/fl cohorts at 100 days (L and M). Relative to PlxnB1 intact control (H), PLXNB1WT expression lowers MLC2 phosphorylation in the Ptenfl/flKrasG12V cohort (I). PLXNB1P1597L expression increases MLC2 phosphorylation on both backgrounds (J and M). Scale bars, 100 μm (left image) and 30 μm (right image). K–N, H-score quantitation of phospho-MLC2Ser19 staining. Epithelial cells were divided into three categories according to staining intensity (strong/medium/low). H-score = 1 × (% «low staining» cells) + 2 × (% «medium staining» cells) + 3 × (% «strong staining» cells). (n = 3, 5 fields per sample, t test). *, P < 0.05 (t test, n = 3, mean ± SD).
FIGURE 6
FIGURE 6
Inhibition of Rho/ROCK signaling by deletion of RhoA/C or PDZRhoGEF suppresses metastasis in the Ptenfl/flKrasG12VPLXNB1P1597L model. A, Schematic diagram of generation of Ptenfl/flKrasG12VPLXNB1P1597LRhoAfl/fl RhoC−/− and Ptenfl/flKrasG12VPLXNB1P1597L PDZRhoGEF−/− mice. B, Kaplan–Meier survival curves for untreated Ptenfl/flKrasG12VPLXNB1P1597L mice (n = 28), mice treated 1 mg/kg of ROCK inhibitor GSK269962 (n = 6) or two cohorts with Rho/ROCK pathway genetic deletions: Ptenfl/flKrasG12VPLXNB1P1597L RhoAfl/fl RhoC−/− (n = 11) and Ptenfl/flKrasG12VPLXNB1P1597L PDZRhoGEF−/− (n = 23) mice. Primary prostate tumor growth was the major reason for euthanasia. Cohorts with either ROCK inhibitor treatment (median survival 275.5 days, log-rank test; z = 1, P = 0.32) or PDZRhoGEF deletion (median survival 254 days, log-rank test; z = 0.49, P = 0.63) had no significant changes in animal survival compared with untreated Ptenfl/flKrasG12VPLXNB1P1597L cohort (median survival 226.5 days). Ptenfl/flKrasG12VPLXNB1P1597L RhoAfl/fl RhoC−/− showed decrease in survival due to penis skin wart growth (log-rank test; z = 3.24, P = 0.00119). C, Percentages of animals affected/not affected by metastasis in Ptenfl/flKrasG12VPLXNB1P1597L cohorts. Following necropsy, mice were categorized according to their metastatic outcome: no metastatic deposits (white), lymph node metastasis (orange), lymph node metastasis combined with invasion into peritoneum or pelvic muscle (purple), combined lymph node and lung metastasis (brown), animals with both lymph node and lung metastasis combined with invasion into peritoneum or pelvic muscle (black). D, Timing and type of metastatic deposits in Ptenfl/flKrasG12VPLXNB1P1597L cohorts.
FIGURE 7
FIGURE 7
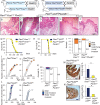
Germline deletion of PlexinB1 decreases metastasis in Ptenfl/flKrasG12V and Ptenfl/flp53fl/fl mice. A, Schematic diagram of generation of Ptenfl/flKrasG12VPlxnB1−/− and Ptenfl/flp53fl/flPlxnB1−/− mice. B, H&E staining of Ptenfl/flKrasG12VPlxnB1−/− prostate (scale bar: 200 μm). C and D, Invasive adenocarcinoma in prostates of Ptenfl/flp53fl/flPlxnB1−/− mice at day 100 timepoint showing sarcomatoid deposits next to epithelium (marked with arrow), scale bar: 500 μm (C), 100 μm (D). Sarcomatoid tumors from prostates of 6-month-old Ptenfl/flp53fl/flPlxnB1−/− mice. Scale bar: 500 μm (E), 50 μm (F). G, Kaplan–Meier survival curves for Ptenfl/flKrasG12V (n = 20), and Ptenfl/flKrasG12VPlxnB1−/− (n = 28), cohorts. Primary prostate tumor growth was the major reason for euthanasia. H, Kaplan–Meier survival curves for Ptenfl/flp53fl/fl (n = 30) and Ptenfl/flp53fl/flPlxnB1−/− (n = 21) cohorts. I and J,PlxnB1 germline deletion suppress metastasis in Ptenfl/flKrasG12V mouse model of prostate cancer. Mice were categorized according to their metastatic outcome: no metastatic deposits (white), lymph node metastasis (orange), both lymph node and lung metastasis combined with invasion into peritoneum or pelvic muscle (black). I, Percentages of animals with metastases in Ptenfl/flKrasG12V cohorts. J, Timing and type of metastatic deposits in Ptenfl/flKrasG12V (n = 20), and Ptenfl/flKrasG12V PlxnB1−/− mice (n = 28). K and L, PlxnB1 germline deletion suppress metastasis in Ptenfl/flp53fl/fl mouse model of prostate cancer. K, Percentage of mice with metastases in Ptenfl/flp53fl/fl cohorts: no metastatic deposits (white), invasion into peritoneum or pelvic muscle (blue), lymph node metastasis combined with invasion into peritoneum or pelvic muscle (purple). L, Timing and type of metastatic deposits in Ptenfl/flp53fl/fl (n = 30) and Ptenfl/flp53fl/flPlxnB1−/− (n = 21) mice. See Table 1 for statistical analyses. M and N,PlxnB1 deletion decreases local invasion by prostate tumor cells. Immunostaining of prostates of 100-day-old mice with cytokeratin AE1/AE3 (pan-cytokeratin) to identify prostate epithelial cells breaking basement membrane and invading stroma in Ptenfl/flKrasG12V (M) and Ptenfl/flp53fl/flPlxnB1−/− (N) mice. Scale bars, 50 μm. Graphs show quantitation of invasion in the Ptenfl/flKrasG12V and Ptenfl/flp53fl/fl backgrounds—Pan-cytokeratin positive cells breaking the basement membrane or located inside the stromal compartment were counted and divided by total number of pan-cytokeratin positive cells. *, P < 0.05 (t test, n = 3, mean ± SD).

Similar articles

Cited by

References

    1. Kim J, Park JS, Ham WS. The role of metastasis-directed therapy and local therapy of the primary tumor in the management of oligometastatic prostate cancer. Investig Clin Urol 2017;58:307–16. - PMC - PubMed
    1. Rycaj K, Tang DG. Molecular determinants of prostate cancer metastasis. Oncotarget 2017;8:88211–31. - PMC - PubMed
    1. Tamagnone L, Comoglio PM. Signalling by semaphorin receptors: cell guidance and beyond. Trends Cell Biol 2000;10:377–83. - PubMed
    1. Kruger RP, Aurandt J, Guan KL. Semaphorins command cells to move. Nat Rev Mol Cell Biol 2005;6:789–800. - PubMed
    1. Swiercz JM, Worzfeld T, Offermanns S. ErbB-2 and met reciprocally regulate cellular signaling via plexin-B1. J Biol Chem 2008;283:1893–901. - PubMed

Publication types

Substances