. 2023 Feb 28;26(3):106296.
doi: 10.1016/j.isci.2023.106296. eCollection 2023 Mar 17.

Neuronal loss of NCLX-dependent mitochondrial calcium efflux mediates age-associated cognitive decline

Affiliations

Neuronal loss of NCLX-dependent mitochondrial calcium efflux mediates age-associated cognitive decline

Pooja Jadiya et al. iScience. .

Abstract

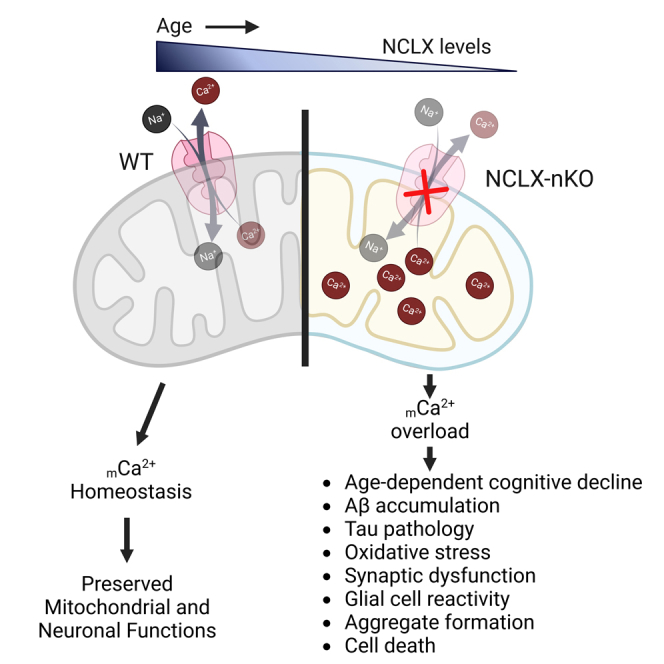
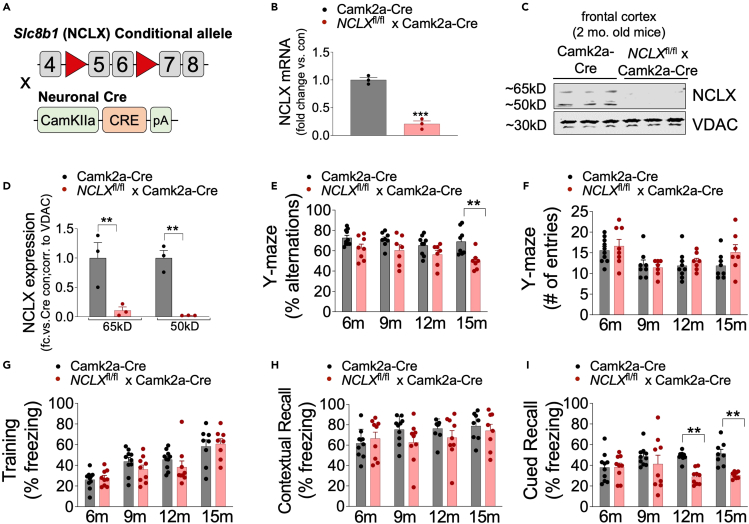
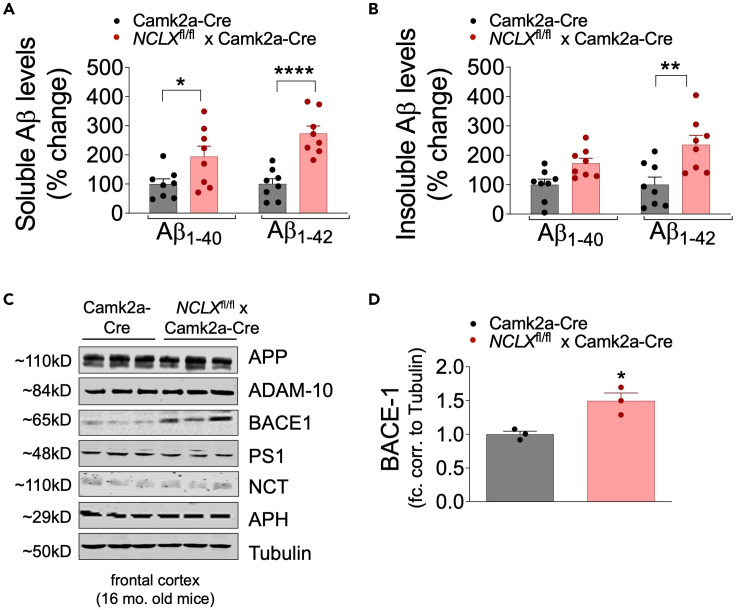
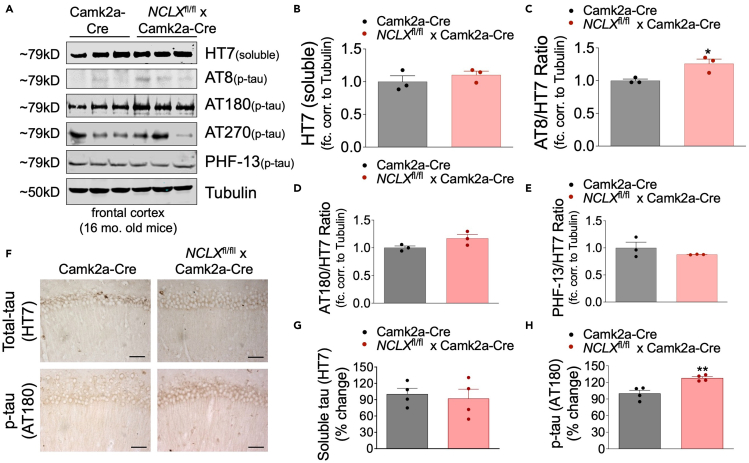
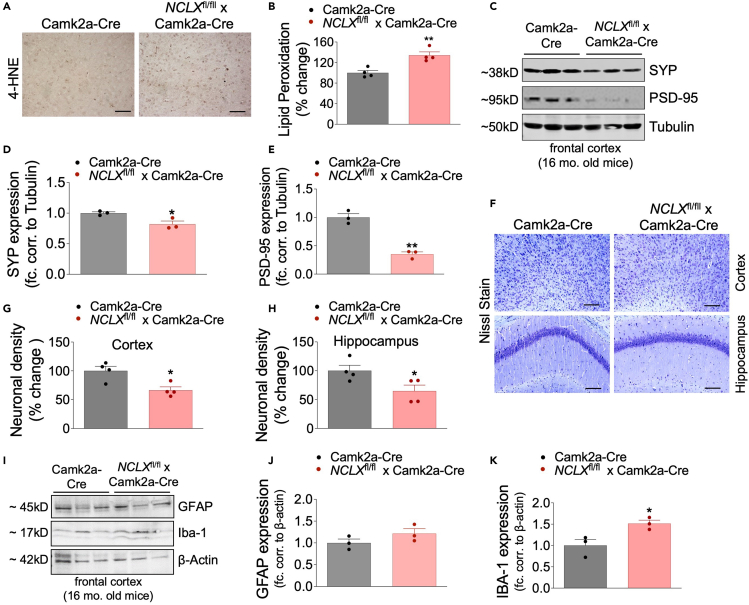
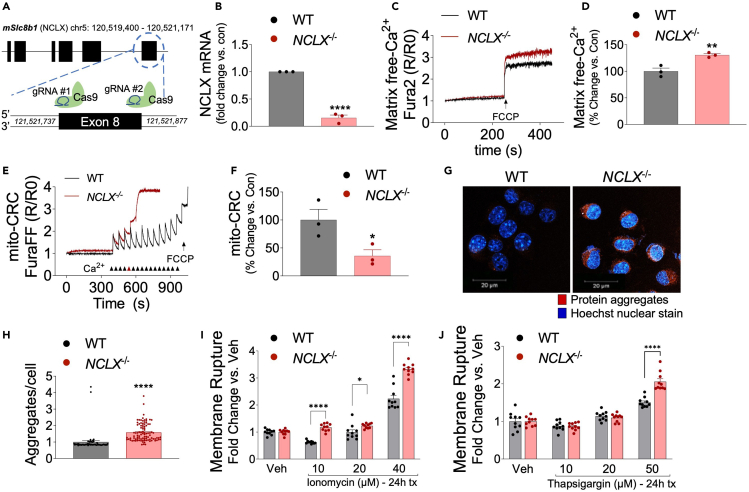
Mitochondrial calcium overload contributes to neurodegenerative disease development and progression. We recently reported that loss of the mitochondrial sodium/calcium exchanger (NCLX), the primary mechanism of mCa2+ efflux, promotes mCa2+ overload, metabolic derangement, redox stress, and cognitive decline in models of Alzheimer's disease (AD). However, whether disrupted mCa2+ signaling contributes to neuronal pathology and cognitive decline independent of pre-existing amyloid or tau pathology remains unknown. Here, we generated mice with neuronal deletion of the mitochondrial sodium/calcium exchanger (NCLX, Slc8b1 gene), and evaluated age-associated changes in cognitive function and neuropathology. Neuronal loss of NCLX resulted in an age-dependent decline in spatial and cued recall memory, moderate amyloid deposition, mild tau pathology, synaptic remodeling, and indications of cell death. These results demonstrate that loss of NCLX-dependent mCa2+ efflux alone is sufficient to induce an Alzheimer's disease-like pathology and highlights the promise of therapies targeting mCa2+ exchange.

Keywords: Behavioral neuroscience; Cellular neuroscience; Cognitive neuroscience; Molecular neuroscience.


Conflict of interest statement

The authors declare no competing financial interests related to this work. J.W.E. is a paid consultant for Mitobridge, Inc., An Astellas Company.

Figures

None
Graphical abstract
Figure 1
Figure 1
Loss of NCLX-dependent neuronal mCa2+ efflux promotes cognitive decline (A) Schematic of NCLX-nKO mice (NCLXfl/fl x Camk2a-Cre) mutant mouse strategy. (B and C) (B) NCLX mRNA expression in tissue isolated from the frontal cortex of NCLX-nKO and age-matched controls (Camk2a-Cre). mRNA expression corrected to the housekeeping gene Rps13; expressed as fold change versus control, n = 3 for both groups. All data presented as mean ± SEM; ∗∗∗p<0.001; two-tailed, unpaired t-test(C). Western blots for NCLX expression in tissue isolated from the cortex of 2-month-old NCLXfl/fl x Camk2a-Cre mice compared to age-matched control Camk2a-Cre mice. VDAC, voltage-dependent anion channel, served as mitochondrial loading controls. (D) NCLX protein expression expressed as fold-change versus Camk2a-Cre con. corrected to a mitochondrial loading control VDAC in brain cortex of 2-month-old mice. All data presented as mean ± SEM; ∗∗p<0.01; two-way ANOVA with Sidak’s multiple comparisons test. (E and F) Y-maze spontaneous alternation test. (E) Percentage of spontaneous alternation. (F) Total number of arm entries. (G–I) Fear-conditioning test. (G) Freezing responses in the training phase. (H) Contextual recall freezing responses, (I). Cued recall freezing responses. n = individual dots shown for each group in all graphs. All data presented as mean ± SEM. Data for percentage alternations, contextual and cued recall freezing response was analyzed using Prism (GraphPad) two-way ANOVA multiple comparison testing for an age effect with Dunnett’s post-hoc test for comparison to age 6 months and comparison of genotype across all ages using a Bonferroni’s multiple comparisons test, ∗∗p < 0.01. All comparisons were non-significant except those denoted. To ensure equivalent motor activity and behavior in the Y-maze and equivalent training for fear-conditioning behavioral testing data for Y-maze number of entries and freezing during training was analyzed using two-way ANOVA testing for comparison of genotype across all ages using a Bonferroni’s multiple comparisons test. No statistical differences were noted.
Figure 2
Figure 2
Loss of neuronal NCLX increases Aβ accumulation (A and B) Soluble and insoluble Aβ1–40 and Aβ1–42 levels in the cortex of 16-month-old mice, measured by sandwich ELISA. n = individual dots are shown for each group in all graphs. All data presented as mean ± SEM; ∗∗∗∗p<0.001, ∗∗p<0.01, ∗p<0.05; two-way ANOVA with Sidak’s multiple comparisons test. (C) Western blots for full-length APP, ADAM-10, BACE1, PS1, Nicastrin, APH, and tubulin (loading control) from cortex of 16-month-old NCLX-nKO and control mice, n = 3 for all groups. (D) BACE-1 protein expression expressed as fold change versus Camk2a-Cre con. corrected to tubulin loading control from frontal cortex of 2-month-old mice. All data presented as mean ± SEM; ∗p<0.05; two-tailed, unpaired t-test.
Figure 3
Figure 3
Loss of NCLX increases tau-pathology (A) Representative western blots of soluble total tau (HT7), and phosphorylated tau at residues S202/T205 (AT8), T231/S235 (AT180), T181 (AT270), and S396 (PHF13) in cortex homogenates of 16-month-old mice, n = 3 for all groups. (B–E) Densitometric analysis of western blots shown in Figure 3A expressed as fold-change versus Camk2a-Cre con. Corrected to a loading control tubulin. (F) Representative immunohistochemical staining for total tau (HT7) and phospho-tau T231/S235 (AT180) in hippocampus of NCLX-nKO and control mice; scale bar = 50 μM. (G and H) Quantification of the integrated optical density area of HT7 and AT180 immunoreactivity, n = 4 for all groups. All data presented as mean ± SEM; ∗∗p<0.01, ∗p<0.05; two-tailed, unpaired t-test.
Figure 4
Figure 4
Neuronal loss of mCa2+ efflux leads to redox imbalance, decreased synaptic stability and neuronal loss (A) Representative images of 4-HNE immunohistochemical staining in cortex and hippocampus of 16-month-old NCLX-nKO and control mice. (B) Percent change in 4-HNE-integrated optical density area corrected to Camk2a-Cre controls. N = 4 for all groups, scale bar = 50 μM. (C) Western blots for SYP and PSD-95 expression in tissue isolated from the cortex of 16-month-old-mice, n = 3 for all groups. (D and E) Densitometric analysis of western blots shown in Figure 4C, expressed as fold change versus Camk2a-Cre con. corrected to loading control tubulin. (F) Representative image of Nissl staining in cortex and hippocampus of 16-month-old mice to detect neuronal density. (G and H) Quantitative analysis of Nissl positive cells in cortex and hippocampus areas of brain sections expressed as percent change versus Camk2a-Cre controls. n = 4 for all groups, scale bar = 50 μM. (I) Western blots for GFAP and IBA1 expression in cortex of 16-month-old-mice, n = 3 for all groups. (J and K) Densitometric analysis of western blots shown in Figure 4I, expressed as fold change versus Camk2a-Cre con. corrected to loading control β-actin. All data presented as mean ± SEM; ∗∗p<0.01, ∗p<0.05; two-tailed, unpaired t-test.
Figure 5
Figure 5
Loss of NCLX increases mCa2+ overload, aggregate formation, and cell death (A) Schematic for generation of NCLX knockout cell line (NCLX−/−) using CRISPR/SpCas9. (B) NCLX mRNA expression in NCLX−/− and controls (WT) N2a cells, corrected to the housekeeping gene, Rps13; expressed as fold change versus control, n = 3 for both groups. All data presented as mean ± SEM; ∗∗∗∗p<0.001; two-tailed, unpaired t-test. (C) Representative traces for basal mCa2+ content. (D and E) (D) Quantification of mCa2+ content, n = 3 for both groups. All data presented as mean ± SEM; ∗∗p<0.001; two-tailed, unpaired t-test(E). Representative recordings of mCa2+ retention capacity. (F and G) (F)Percent change in mCa2+ retention capacity versus N2a control cells, n = 3 for both groups. All data presented as mean ± SEM; ∗p<0.05; two-tailed, unpaired t-test(G). Representative images of intracellular protein aggregates in NCLX−/− and WT cells stained with Proteostat aggresome detection reagent (red) and Hoechst 33,342 nuclear stain (blue), scale bars = 20-μm. (H) Total aggregates per cell, n = 96 for NCLX−/− and n = 58 for WT N2a control. All data presented as mean ± SEM; ∗∗∗∗p<0.001; two-tailed, unpaired t-test. (I and J) NCLX−/− and WT cells were assessed for plasma membrane rupture, Sytox Green, after treatment with (I). Ionomycin (10–40 μM), (J). thapsigargin (10–50 μM), n = 10 for both groups. All data presented as mean ± SEM; ∗∗∗p<0.001, ∗∗p<0.01, ∗p<0.05; two-way ANOVA with Sidak’s multiple comparisons test.

References

    1. Harman D. The biologic clock: the mitochondria? J. Am. Geriatr. Soc. 1972;20:145–147. doi: 10.1111/j.1532-5415.1972.tb00787.x. - DOI - PubMed
    1. Sun N., Youle R.J., Finkel T. The mitochondrial basis of aging. Mol. Cell. 2016;61:654–666. doi: 10.1016/j.molcel.2016.01.028. - DOI - PMC - PubMed
    1. Jack C.R., Jr., Bennett D.A., Blennow K., Carrillo M.C., Dunn B., Haeberlein S.B., Holtzman D.M., Jagust W., Jessen F., Karlawish J., et al. NIA-AA Research Framework: toward a biological definition of Alzheimer's disease. Alzheimers Dement. 2018;14:535–562. doi: 10.1016/j.jalz.2018.02.018. - DOI - PMC - PubMed
    1. Mehta D., Jackson R., Paul G., Shi J., Sabbagh M. Why do trials for Alzheimer's disease drugs keep failing? A discontinued drug perspective for 2010-2015. Expert Opin. Investig. Drugs. 2017;26:735–739. doi: 10.1080/13543784.2017.1323868. - DOI - PMC - PubMed
    1. Panza F., Lozupone M., Watling M., Imbimbo B.P. Do BACE inhibitor failures in Alzheimer patients challenge the amyloid hypothesis of the disease? Expert Rev. Neurother. 2019;19:599–602. doi: 10.1080/14737175.2019.1621751. - DOI - PubMed

LinkOut - more resources