. 2023 Mar 2:14:1083339.
doi: 10.3389/fimmu.2023.1083339. eCollection 2023.

Megakaryocytes respond during sepsis and display innate immune cell behaviors

Affiliations

Megakaryocytes respond during sepsis and display innate immune cell behaviors

Galit H Frydman et al. Front Immunol. .

Abstract

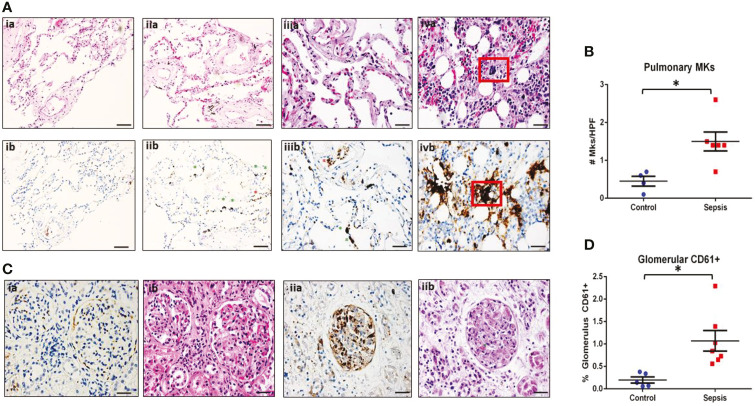
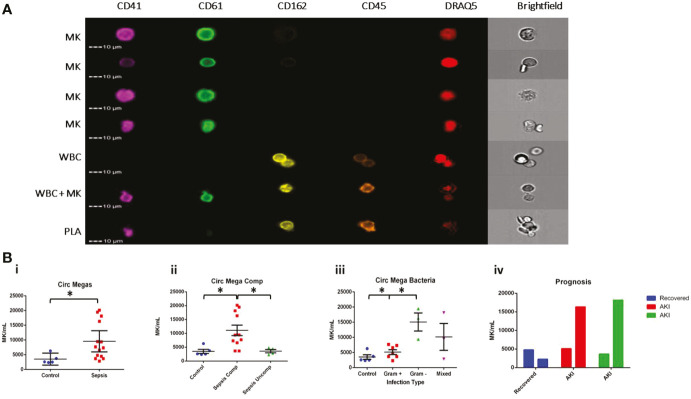
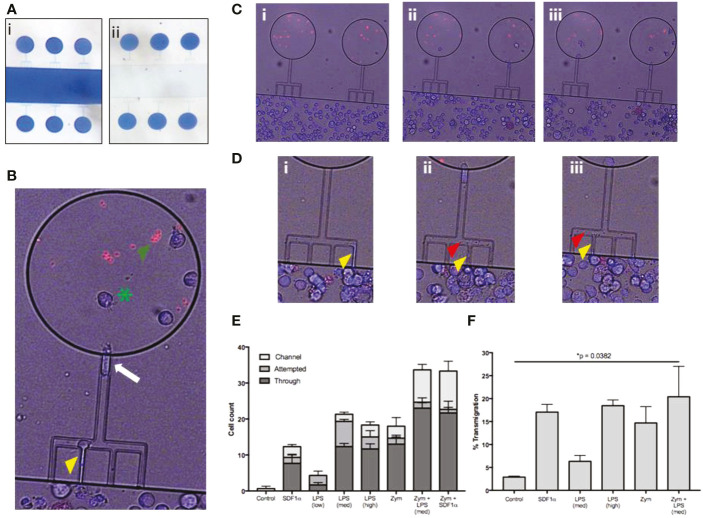
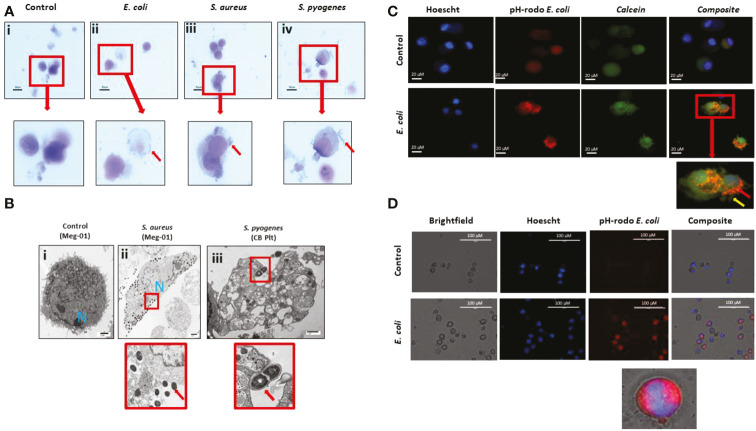
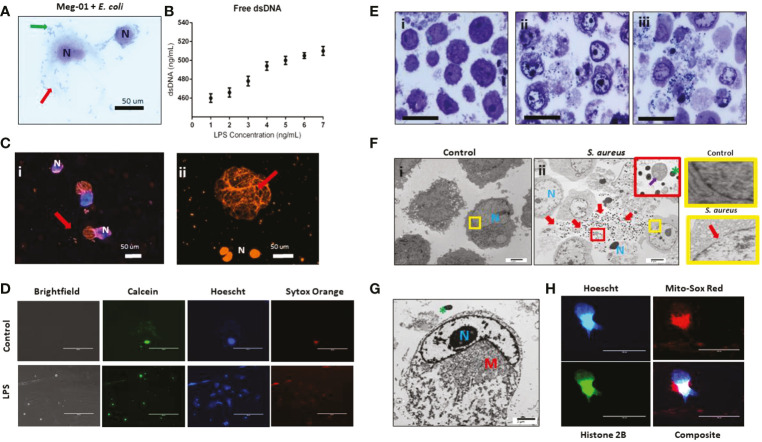
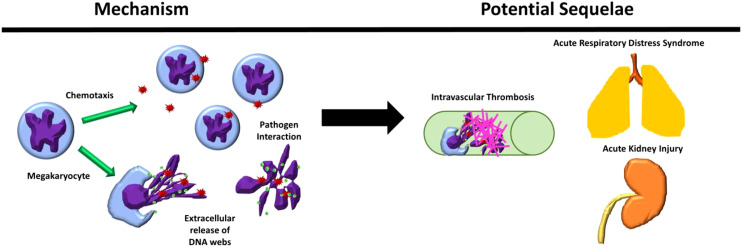
Megakaryocytes (MKs) are precursors to platelets, the second most abundant cells in the peripheral circulation. However, while platelets are known to participate in immune responses and play significant functions during infections, the role of MKs within the immune system remains largely unexplored. Histological studies of sepsis patients identified increased nucleated CD61+ cells (MKs) in the lungs, and CD61+ staining (likely platelets within microthrombi) in the kidneys, which correlated with the development of organ dysfunction. Detailed imaging cytometry of peripheral blood from patients with sepsis found significantly higher MK counts, which we predict would likely be misclassified by automated hematology analyzers as leukocytes. Utilizing in vitro techniques, we show that both stem cell derived MKs (SC MKs) and cells from the human megakaryoblastic leukemia cell line, Meg-01, undergo chemotaxis, interact with bacteria, and are capable of releasing chromatin webs in response to various pathogenic stimuli. Together, our observations suggest that MK cells display some basic innate immune cell behaviors and may actively respond and play functional roles in the pathophysiology of sepsis.

Keywords: infectious; innate; megakaryocyte; platelet; sepsis.


Conflict of interest statement

The authors declare that the research was conducted in the absence of any commercial or financial relationships that could be construed as a potential conflict of interest.

Figures

Figure 1
Figure 1
MKs are increased in peripheral organs during sepsis. Autopsy pathology samples from patients that died from sepsis were evaluated for MKs. (A) MKs in the lungs were defined as large cells with dark, homogenous CD61+ staining (brown). An example of a lung image from a patient that died from heart disease as a negative control is shown in panel ia (hematoxylin and eosin, H&E) and ib (CD61). No MKs were observed in these images. A representative image of two lung images from a patient that died from sepsis are shown in panel iia/iiia (H&E) and iib/iiib (CD61), showing multiple MKs (green asterisks). Platelet staining is also noted (red asterisks). In some cases, a large dark staining basophilic nucleus can be seen in the H&E in the area of the CD61 staining. This was not always the case, which may be due to sectioning and imaging of slightly different planes. This also suggests that CD61 may be more accurate when counting MKs than H&E. A sample of bone marrow from a sepsis patient is shown in panel iva (H&E) and ivb (CD61) as an example of an MK with CD61 staining as a positive control (red box). (B) Glomeruli were evaluated for the presence of increased CD61 staining. Individual MKs could not be reliable counted within the glomeruli, therefore percent of CD61 stain/glomeruli was evaluated. A glomerulus from a control patient is shown in panel ia (CD61) and ib (H&E), with minimal CD61 staining. This is in contrast to a glomerulus from a patient with sepsis and disseminated intravascular coagulation (DIC), which has much higher amounts of CD61 staining along with microvascular thrombi within the glomerular capillaries (green asterisk). Upon evaluation, there was significantly higher pulmonary MKs (C) and glomerular CD61 staining (D) in the sepsis patients as compared to control. Significance is calculated via student t-test with significance being defined as p < 0.05 (*). Scale bars are: Ai-ii, 100 μm, Aiii-iv and C, 50 μm.
Figure 2
Figure 2
MKs are increased in the circulation during sepsis. Samples from patients diagnosed with sepsis were evaluated for the presence of possible MKs. MKs were identified in the peripheral circulation based on the simultaneous expression of CD41, CD61, and DRAQ5. (A) Imaging flow cytometry was used to identify and quantify circulating CD41+CD61+Draq5+ cells in the peripheral circulation. CD45 and CD162 were used as white blood cell markers. The top 4 panels show examples of MKs, while the bottom three panels show examples of two white blood cells, a white blood cell attached to a MK, and a white blood cell attached to a platelet (PLA). The cells negative for all markers in the images are likely red blood cells. (B) Circulating MKs were significantly higher in the peripheral circulation in patients with sepsis (i). The amount of MKs was correlated with sepsis-related complications, including ARDS and AKI, with ‘complicated’ sepsis having significantly higher MKs than ‘uncomplicated’ sepsis (ii). MKs were higher in gram negative and mixed infections compared to gram positive only infections (iii). Bar chart representing the MK count in 3 patients with sepsis that had blood collected on >1 day during the study. One patient recovered (blue) and two patients (red and green) developed AKI by day 3 of sample collection, suggesting that there also may be a correlation with recovery and the development of sepsis complications, such as AKI (iv). Statistics: student t-test (Bi) and ANOVA (Bii, iii) we performed, with significance defined as p < 0.05 (*). No statistical analysis was performed on the data in panel Biv due to the small sample size (n = 1 per group).
Figure 3
Figure 3
Meg-01 cells are capable of chemotaxis to pathogenic stimulus. Meg-01 cells were tested for their ability to chemotax towards LPS and zymosan particles. (A) A microfluidic device was used for part of the chemotaxis experiments. In this device, the main channel is connected to a circular reservoir by four 6 µm wide channels and a larger 8 µm wide connecting channel in a comb-like arrangement. The device is first primed with the condition (panel i) and the main channel is then flushed with media in order to create a concentration gradient from the chemoattractant chambers into the main channel (panel ii). (B) The MKs were stained with Hoechst for positive identification and then manually tracked. The behavior of the MKs was divided into 3 categories: cells attempting to enter the channel (yellow arrowhead), cells inside the channel (white arrow), and cells through the channel and inside the reservoir (green arrowhead). Zymosan particles are marked with a green asterisk. (C) Time lapse image of MKs migrating into chambers primed with LPS (360 pg/mL) and zymosan particles (Ci, no cells in the chambers with the red zymosan particles; (Cii), cells starting to migrate up the combs into the zymosan chambers; (Ciii) final timepoint with multiple cells in each zymosan chamber). (D) Close-up of time-lapse imaging where MKs were observed attempting to enter the channel, extend a portion of the cell into the side channel (yellow arrowhead) (Di–Diii), and then bud off small platelet-like particles (red arrowhead) (Dii, Diii). Additionally, a single MK is followed shown throughout this timelapse first entering the comb (Di) and then finally entering the chamber (Diii). (E) Bar graph representing MK chemotaxis within the microfluidic device. (F) Bar graph representing MK chemotaxis in a transwell assay, confirming the observations made with the microfluidic device. Statistical analysis for (E, F) are One-way ANOVAs with results in detail in Figure S4 . LPS low, 22 pg/mL; LPS med, 220 pg/mL; LPS high, 2.2 ng/mL; Zym, zymosan particles; Zym+LPS, zymosan particles with 220 pg/mL LPS. Bar graphs are mean with standard error bars.
Figure 4
Figure 4
MKs interact with pathogens. (A) Meg-01 cells were co-incubated with E. coli, S. aureus, and S. pyogenes. Light microscopy with diff-quick staining shows that bacteria are associated with the cytoplasm and cell membrane of the cells. (B) Transmission electron microscopy of both Meg-01 and SC MKs exhibiting bacterial association with the cell membrane as well as internalization into vacuoles within the cytoplasm. Panel i is a control Meg-01 cell, while panel ii is a Meg-01 cell that was co-incubated with live S. aureus. Panel iii is from a SC MK culture co-incubated with live S. pyogenes showing association of the bacteria with a platelet cell membrane. (C) SC MKs were co-incubated with live pHrodo-conjugated bacteria. This is a representative image of a control cell along with a cell co-incubated with E. coli. (D) Meg-01 cells were co-incubated with pHrodo-conjugated live E. coli and then imaged. Notice the lack of rod-shapes in the Meg-01 cell (D) and diffuse cytoplasmic fluorescence in comparison with the SC MKs (C). Bacteria, red arrow; pseudopods, yellow arrow.
Figure 5
Figure 5
MK release chromatin webs. SC MKs and Meg-01 cells were observed to release chromatin webs in response to pathogenic stimulus. (A) Meg-01 cells co-incubated with live E. coli underwent cell lysis (diff-quick stain). Green arrow: bacteria; red arrow: extracellular cytoplasmic contents. (B) Chromatin released from Meg-01 cells after incubation with LPS quantified using PicoGreen assay. (C) SC MKs release chromatin webs after incubation with live pHrodo-conjugated E. coli. Live cell nuclei are blue (Hoechst stain). Chromatin webs are orange (Sytox stain). (Bi) SC MKS with nucleus (blue) and chromatin webs (orange). (Bii) SC MKs, one that has released a chromatin web (red arrow) and three dead cells with orange nuclei. (D) Meg-01 cells have intact cell membranes and proplatelet buddings (calcein staining). Cells incubated with LPS have scant calcein and abundant Sytox (extracellular chromatin) staining. (E) Meg-01 cells incubated with live bacteria display swollen nuclei, broken nuclear membranes, chromatin webs, extracellular granules, and bacteria associated with intra- and extracellular contents (light microscopy). (Ei) is the control, and (Eii–iii) are co-incubated with E. coli and S. aureus, respectively. (Fi) Transmission electron microscopy (TEM) of Meg-01 cells in media (control) revealed an intact nuclear membrane and limited extracellular content. Meg-01 cells co-incubated with live bacteria (Fii) display swollen nuclei (N), broken nuclear membranes, extracellular cytoplasmic contents (including granules and mitochondria), and an abundance of bacteria primarily associated with this extracellular content (red arrows). The red magnified section in (Fii) demonstrates the presence of extracellular mitochondria (purple arrow) and the yellow magnified sections on the right demonstrate an intact nuclear membrane in a control cell (top right) and a cell co-incubated with bacteria that has a break in the nuclear membrane (bottom right). (G) TEM image of a Meg-01 cell co-incubated with live E. coli exhibiting a swollen nucleus and a rearrangement of mitochondria surrounding the nucleus. (H) Meg-01 cells transfected with Bacmam H2b-GFP released chromatin webs that were both positive for DNA (Hoechst) and histone 2B. Mitochondrial staining with MitoSox red shows active mitochondria in a perinuclear arrangement, confirming the TEM findings from panel (G).
Figure 6
Figure 6
Megakaryocyte immune behaviors observed and their possible sequelae in physiological systems. Megakaryocytes (MKS) were observed to chemotax and release extracellular chromatin webs in response to pathogenic stimuli and interact directly with pathogens. These behaviors, in combination with their presence in increased amounts in the blood and peripheral organs during severe inflammatory conditions, such as sepsis, may contribute to the response to pathogenic stimulus, including the contribution to the development of intravascular thrombosis in peripheral organs, such as the lungs and the kidneys.

References

    1. Kaushansky K. The molecular mechanisms that control thrombopoiesis. J Clin Invest (2005) 115(12):3339–47. doi: 10.1172/JCI26674 - DOI - PMC - PubMed
    1. Machlus KR, Italiano JE., Jr. The incredible journey: From megakaryocyte development to platelet formation. J Cell Biol (2013) 201(6):785–96. doi: 10.1083/jcb.201304054 - DOI - PMC - PubMed
    1. Alamo IG, Kannan KB, Loftus TJ, Ramos H, Efron PA, Mohr AM. Severe trauma and chronic stress activates extramedullary erythropoiesis. J Trauma Acute Care Surg (2017) 83(1):144–50. doi: 10.1097/TA.0000000000001537 - DOI - PMC - PubMed
    1. Lefrançais E, Ortiz-Muñoz G, Caudrillier A, Mallavia B, Liu F, Sayah DM, et al. . The lung is a site of platelet biogenesis and a reservoir for haematopoietic progenitors. Nature (2017) 544(7648):105–9. doi: 10.1038/nature21706 - DOI - PMC - PubMed
    1. Yacoub A, Brockman A. Extramedullary hematopoiesis and splenic vein thrombosis, a unique presentation of pre-clinical essential thrombocythemia. Blood (2013) 122(21):5257. doi: 10.1182/blood.V122.21.5257.5257 - DOI

Publication types