. 2023 Mar 1:13:1079597.
doi: 10.3389/fonc.2023.1079597. eCollection 2023.

Epidemiology and risk stratification of low-grade gliomas in the United States, 2004-2019: A competing-risk regression model for survival analysis

Affiliations

Epidemiology and risk stratification of low-grade gliomas in the United States, 2004-2019: A competing-risk regression model for survival analysis

Junguo Cao et al. Front Oncol. .

Abstract

Background: Understanding the epidemiology and prognostic factors of low-grade gliomas (LGGs) can help estimate the public health impact and optimize risk stratification and treatment strategies.

Methods: 3 337 patients diagnosed with LGGs were collected from the Surveillance, Epidemiology, and End Results (SEER) dataset, 2004-2019. The incidence trends of LGGs were analyzed by patient demographics (sex, age, race, and ethnicity). In addition, a competing risk regression model was used to explore the prognostic factors of LGGs by patient demographics, tumor characteristics (histological subtypes, invasiveness, and size), treatment modality, and molecular markers (IDH mutation and 1p/19q codeletion).

Results: LGGs occurred more frequently in male, non-Hispanic, and White populations. The incidence rate of mixed gliomas was stable from 2004 to 2013 and decreased dramatically to nearly zero until 2019. The risk of death increased 1.99 times for every 20-year increase in patient age, and 60 years is a predictive cut-off age for risk stratification of LGGs. Male patients showed poorer LGG-specific survival. Among the different subtypes, astrocytoma has the worst prognosis, followed by mixed glioma and oligodendroglioma. Tumors with larger size (≥5 cm) and invasive behavior tended to have poorer survival. Patients who underwent gross total resection had better survival rates than those who underwent subtotal resection. Among the different treatment modalities, surgery alone had the best survival, followed by surgery + radiotherapy + chemotherapy, but chemotherapy alone had a higher death risk than no treatment. Furthermore, age, invasiveness, and molecular markers were the most robust prognostic factors.

Conclusion: This study reviewed the incidence trends and identified several prognostic factors that help clinicians identify high-risk patients and determine the need for postoperative treatment according to guidelines.

Keywords: SEER Program; incidence; low-grade glioma; molecular marker; risk factor.


Conflict of interest statement

The authors declare that the research was conducted in the absence of any commercial or financial relationships that could be construed as a potential conflict of interest.

Figures
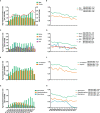
Figure 1
Figure 1
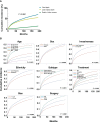
Age-adjusted incidence rates (IRs) and annual percent changes (APCs). IRs by 5-year age intervals and by sex (A), race (C), ethnicity (E), and histological subtypes (G). APCs by sex (B), race (D), ethnicity (F) and histological subtypes (H) over time from 2004–2019. * P < 0.01.
Figure 2
Figure 2
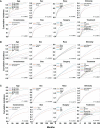
Cumulative incidence curves for low grade gliomas (LGGs). (A). The cumulative incidence total death and death from LGGs and those from other causes. (B). The cumulative incidence of tumor-related death was computed for each factor after accounting for the death of other causes. The subsequent plots present fraction of the population that has died from their LGGs by age, sex, ethnicity, histological subtypes, invasiveness, tumor size, surgery, and treatment modality.
Figure 3
Figure 3
Cumulative incidence curves and sub-distribution hazard ratios (SHR) for each of the features of the survival model. (A) The subsequent plots present fraction of the population that has died from low grade gliomas (LGGs) by IDH mutations and 1p/19q codeletion status. (B) SHR by patient demographics (sex, age, race, and ethnicity), tumor (histological subtypes, invasiveness, size), treatment (extent of resection and treatment modality), and molecular markers (IDH mutation and 1p/19q codeletion status) in competing risk regression model for LGG-specific survival. * P < 0.01.
Figure 4
Figure 4
Cumulative incidence curves for astrocytoma, oligodendrogliomas, and mixed gliomas. The subsequent plots present fraction of the population that has died from their astrocytoma (A), oligodendrogliomas (B), and mixed gliomas (C) by age, sex, race, ethnicity, invasiveness, tumor size, surgery, and treatment modality.
Figure 5
Figure 5
Patient age, tumor aggressiveness, and molecular markers may be important factors in risk stratification of LGG patients. (A). SHR from four groups, including all LGGs, astrocytoma, oligodendrogliomas, and mixed gliomas across different age groups were compared, *P < 0.001. (B). Cumulative incidence curves of LGGs by five age groups, 0-19, 20-39, 40-59, 60-79, and 80+ years, *P < 0.001. (C). Cumulative incidence curves of LGGs by two age groups, < 60, and 60 + years, * P < 0.001. (D). Absolute differences in SHR (ΔSHR) between each reference and subtype were calculated and compared across different factors, including age, sex, race, ethnicity, invasiveness, size, and molecular markers. ns, no significant differences.

References

    1. Krishnatry R, Zhukova N, Guerreiro Stucklin AS, Pole JD, Mistry M, Fried I, et al. . Clinical and treatment factors determining long-term outcomes for adult survivors of childhood low-grade glioma: A population-based study. Cancer (2016) 122(8):1261–9. doi: 10.1002/cncr.29907 - DOI - PubMed
    1. Ostrom QT, Cioffi G, Gittleman H, Patil N, Waite K, Kruchko C, et al. . Cbtrus statistical report: Primary brain and other central nervous system tumors diagnosed in the united states in 2012–2016. Neuro-oncology (2019) 21(Supplement_5):v1–v100. doi: 10.1093/neuonc/noz150 - DOI - PMC - PubMed
    1. Youssef G, Miller JJ. Lower grade gliomas. Curr Neurol Neurosci Rep (2020) 20(7):21. doi: 10.1007/s11910-020-01040-8 - DOI - PMC - PubMed
    1. Ostrom QT, de Blank PM, Kruchko C, Petersen CM, Liao P, Finlay JL, et al. . Alex's lemonade stand foundation infant and childhood primary brain and central nervous system tumors diagnosed in the united states in 2007–2011. Neuro-oncology (2014) 16(suppl_10):x1–x36. doi: 10.1093/neuonc/nou327 - DOI - PMC - PubMed
    1. Louis DN, Ohgaki H, Wiestler OD, Cavenee WK, Burger PC, Jouvet A, et al. . The 2007 who classification of tumours of the central nervous system. Acta neuropathologica (2007) 114(2):97–109. doi: 10.1007/s00401-007-0243-4 - DOI - PMC - PubMed

LinkOut - more resources