

Determination of protein conformation and orientation at buried solid/liquid interfaces
- PMID: 36937592
- PMCID: PMC10016606
- DOI: 10.1039/d2sc06958j
Determination of protein conformation and orientation at buried solid/liquid interfaces
Abstract
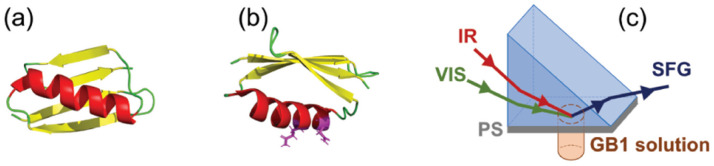
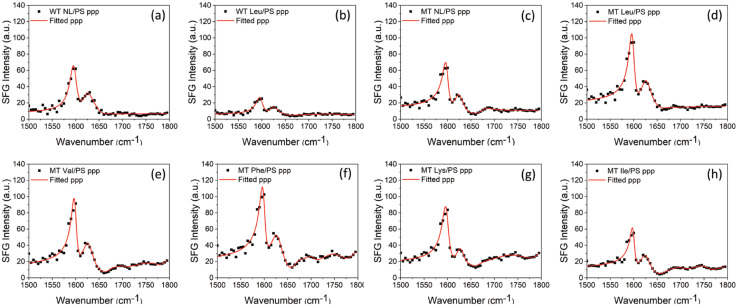
Protein structures at solid/liquid interfaces mediate interfacial protein functions, which are important for many applications. It is difficult to probe interfacial protein structures at buried solid/liquid interfaces in situ at the molecular level. Here, a systematic methodology to determine protein molecular structures (orientation and conformation) at buried solid/liquid interfaces in situ was successfully developed with a combined approach using a nonlinear optical spectroscopic technique - sum frequency generation (SFG) vibrational spectroscopy, isotope labeling, spectra calculation, and computer simulation. With this approach, molecular structures of protein GB1 and its mutant (with two amino acids mutated) were investigated at the polymer/solution interface. Markedly different orientations and similar (but not identical) conformations of the wild-type protein GB1 and its mutant at the interface were detected, due to the varied molecular interfacial interactions. This systematic strategy is general and can be widely used to elucidate protein structures at buried interfaces in situ.
This journal is © The Royal Society of Chemistry.
Conflict of interest statement
The authors declare no conflicts.
Figures


Similar articles
-
Engineering and Characterization of Peptides and Proteins at Surfaces and Interfaces: A Case Study in Surface-Sensitive Vibrational Spectroscopy.Acc Chem Res. 2016 Jun 21;49(6):1149-57. doi: 10.1021/acs.accounts.6b00091. Epub 2016 May 18. Acc Chem Res. 2016. PMID: 27188920 Review.
-
Investigating buried polymer interfaces using sum frequency generation vibrational spectroscopy.Prog Polym Sci. 2010 Nov 1;35(11):1376-1402. doi: 10.1016/j.progpolymsci.2010.07.003. Prog Polym Sci. 2010. PMID: 21113334 Free PMC article.
-
Probing Orientations and Conformations of Peptides and Proteins at Buried Interfaces.J Phys Chem Lett. 2021 Oct 21;12(41):10144-10155. doi: 10.1021/acs.jpclett.1c02956. Epub 2021 Oct 12. J Phys Chem Lett. 2021. PMID: 34637311 Review.
-
Characterization of Buried Interfaces of Silicone Materials in Situ to Understand Their Fouling-Release, Antifouling, and Adhesion Properties.Langmuir. 2024 May 7;40(18):9345-9361. doi: 10.1021/acs.langmuir.4c00615. Epub 2024 Apr 26. Langmuir. 2024. PMID: 38669686 Review.
-
Elucidation of molecular structures at buried polymer interfaces and biological interfaces using sum frequency generation vibrational spectroscopy.Soft Matter. 2013;9:4738-4761. doi: 10.1039/C3SM27710K. Soft Matter. 2013. PMID: 23710244 Free PMC article.
Cited by
-
Charged peptides enriched in aromatic residues decelerate condensate ageing driven by cross-β-sheet formation.Nat Commun. 2025 Aug 28;16(1):8050. doi: 10.1038/s41467-025-62686-x. Nat Commun. 2025. PMID: 40877270 Free PMC article.
-
Ligand-induced conformational changes in protein molecules detected by sum-frequency generation.Biophys J. 2024 Nov 5;123(21):3678-3687. doi: 10.1016/j.bpj.2024.09.017. Epub 2024 Sep 19. Biophys J. 2024. PMID: 39305014
References
LinkOut - more resources
Full Text Sources