. 2023 Mar 3:14:1125519.
doi: 10.3389/fpls.2023.1125519. eCollection 2023.

Genome-wide characterization and identification of Trihelix transcription factors and expression profiling in response to abiotic stresses in Chinese Willow (Salix matsudana Koidz)

Affiliations

Genome-wide characterization and identification of Trihelix transcription factors and expression profiling in response to abiotic stresses in Chinese Willow (Salix matsudana Koidz)

Jie Yang et al. Front Plant Sci. .

Abstract

Trihelix transcription factors (TTF) are a class of light-responsive proteins with a typical triple-helix structure (helix-loop-helix-loop-helix). Members of this gene family play an important role in plant growth and development, especially in various abiotic stress responses. Salix matsudana Koidz is an allotetraploid ornamental forest tree that is widely planted for its excellent resistance to stress, but no studies on its Trihelix gene family have been reported. In this study, the Trihelix gene family was analyzed at the genome-wide level in S. matsudana. A total of 78 S. matsudana Trihelix transcription factors (SmTTFs) were identified, distributed on 29 chromosomes, and classified into four subfamilies (GT-1, GT-2, SH4, SIP1) based on their structural features. The gene structures and conserved functional domains of these Trihelix genes are similar in the same subfamily and differ between subfamilies. The presence of multiple stress-responsive cis-elements on the promoter of the S. matsudana Trihelix gene suggests that the S. matsudana Trihelix gene may respond to abiotic stresses. Expression pattern analysis revealed that Trihelix genes have different functions during flooding stress, salt stress, drought stress and low temperature stress in S. matsudana. Given that SmTTF30, as a differentially expressed gene, has a faster response to flooding stress, we selected SmTTF30 for functional studies. Overexpression of SmTTF30 in Arabidopsis thaliana (Arabidopsis) enhances its tolerance to flooding stress. Under flooding stress, the leaf cell activity and peroxidase activity (POD) of the overexpression strain were significantly higher than the leaf cell activity and POD of the wild type, and the malondialdehyde (MDA) content was significantly lower than the MDA content of the wild type. Thus, these results suggest that SmTTF30 enhances plant flooding tolerance and plays a positive regulatory role in plant flooding tolerance.

Keywords: RNA-Seq; Salix matsudana; Trihelix family; genome-wide characterization; submergence stress.


Conflict of interest statement

The authors declare that the research was conducted in the absence of any commercial or financial relationships that could be constructed as a potential conflict of interest.

Figures

Figure 1
Figure 1
Phylogenetic tree of trihelix proteins in S. matsudana, A. thaliana and P. trichocarpa. Different colored branches represent different subfamilies. S. matsudana, A. thaliana and P. trichocarpa are marked as triangles, circles and squares, respectively.
Figure 2
Figure 2
Structures and conserved motifs of SmTTF genes. (A) The phylogenetic tree was constructed based on the amino acid sequences of S. matsudana trihelix proteins. Different colored branches represent different subfamilies. (B) The motif compositions of S. matsudana Trihelix proteins. Motifs 1-10 are marked in different colored boxes. (C) Gene structure of the S. matsudana trihelix family. CDS, introns, and untranslated regions are marked by green boxes, gray lines, and yellow boxes, respectively.
Figure 3
Figure 3
Chromosomal locations and tandem duplication of S. matsudana trihelix genes. The black lines indicate tandem duplicated trihelix gene pairs. The chromosome number is indicated to the left of each chromosome.
Figure 4
Figure 4
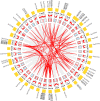
Schematic representations of the segmental duplication and interchromosomal relationships of SmTTF genes. Gray lines indicate all syntenic gene pairs in the S. matsudana genome, and red lines indicate syntenic relationships between SmTTF genes. Gene density across chromosomes is indicated by a hot map (inner circle) and column map (medium circles), and the outer circle shows the length of chromosomes.
Figure 5
Figure 5
Synteny analysis of SmTTF genes between S. matsudana and four related species, A. thaliana, O. sativa, P. trichocarpa and S. purpurea. (A) Synteny analysis of SmTTF genes between S. matsudana and A. thaliana. (B) Synteny analysis of SmTTF genes between S. matsudana and O. sativa. (C) Synteny analysis of SmTTF genes between S. matsudana and P. trichocarpa, (D) Synteny analysis of SmTTF genes between S. matsudana and S. purpurea. Gray lines in the background indicate the collinear blocks within S. matsudana and other plant genomes, whereas red lines highlight syntenic SmTTS gene pairs.
Figure 6
Figure 6
Distribution of predicted cis-acting elements in the promoter region. Elements are indicated as rectangles, and other sequences are indicated as lines.
Figure 7
Figure 7
Heatmap of the expression profiles of Salix matsudana trihelix genes under submergence stress and salt stress. (A) Expression profiles of trihelix genes under flooding stress. (B) Expression profiles of trihelix genes under salinity stress. Differentially expressed genes are marked with *. The expression values (Fragments per kilobase for a million reads, FPKM) for each gene were log2 transformed before generating the heatmap.
Figure 8
Figure 8
The expression profiles of 20 selected trihelix genes in S. matsudana under other abiotic stresses by qRT-PCR. (A) The expression profiles under 200 mM mannitol solutions. (B) The expression profiles under 20% PEG6000. (C) The expression profiles under 4°C. All roots from plants were treated for 4 h, 12 h, 24 h and 48 h. The fold change in expression level is depicted by a heatmap. Data are average values ± SD (n = 3) calculated from three independent experiments. Asterisks indicate significant differences from WT (*p < 0.05, **p < 0.01 by Student’s t-test).
Figure 9
Figure 9
Submergence tolerance assay of SmTTF30 overexpression lines (Line1, Line3, Line5) and wild type (WT). (A) Five-week-old plants were subjected to submergence stress for 6 days. (B) Evans blue staining. (C) qRT-PCR analysis of transgenic and wild-type plants. (D) MDA content. (E) POD activity. The mean value and standard deviation were obtained from three independent experiments. The data represent the mean ± SD of three biological repeats with three measurements per sample. Data were analyzed by one-way analysis of variance followed by Duncan’s test. Different letters represent statistically significant differences (p < 0.05).

References

    1. Ayadi M., Delaporte V., Li Y. F., Zhou D. X. (2004). Analysis of GT-3a identifies a distinct subgroup of trihelix DNA-binding transcription factors in Arabidopsis . FEBS Lett. 562 (1-3), 147–154. doi: 10.1016/S0014-5793(04)00222-4 - DOI - PubMed
    1. Bailey T. L., Elkan C. (1994). Fitting a mixture model by expectation maximization to discover motifs in biopolymers. Proc. Int. Conf. Intell. Syst. Mol. Biol. 2, 28–36. - PubMed
    1. Barr M. S., Willmann M. R., Jenik P. D. (2012). Is there a role for trihelix transcription factors in embryo maturation? Plant Signal Behav. 7 (2), 205–209. doi: 10.4161/psb.18893 - DOI - PMC - PubMed
    1. Breuer C., Kawamura A., Ichikawa T., Tominaga-Wada R., Wada T., Kondou Y., et al. (2009). The trihelix transcription factor GTL1 regulates ploidy-dependent cell growth in the Arabidopsis trichome. Plant Cell 21 (8), 2307–2322. doi: 10.1105/tpc.109.068387 - DOI - PMC - PubMed
    1. Chen C., Chen H., Zhang Y., Thomas H. R., Frank M. H., He Y., et al. (2020). TBtools: An integrative toolkit developed for interactive analyses of big biological data. Mol. Plant 13 (8), 1194–1202. doi: 10.1016/j.molp.2020.06.009 - DOI - PubMed