. 2020 Dec 2;12(24):10655.
doi: 10.3390/su122410655. Epub 2020 Dec 20.

Silicon Nanomembrane Filtration and Imaging for the Evaluation of Microplastic Entrainment along a Municipal Water Delivery Route

Affiliations

Silicon Nanomembrane Filtration and Imaging for the Evaluation of Microplastic Entrainment along a Municipal Water Delivery Route

Gregory R Madejski et al. Sustainability. .

Abstract

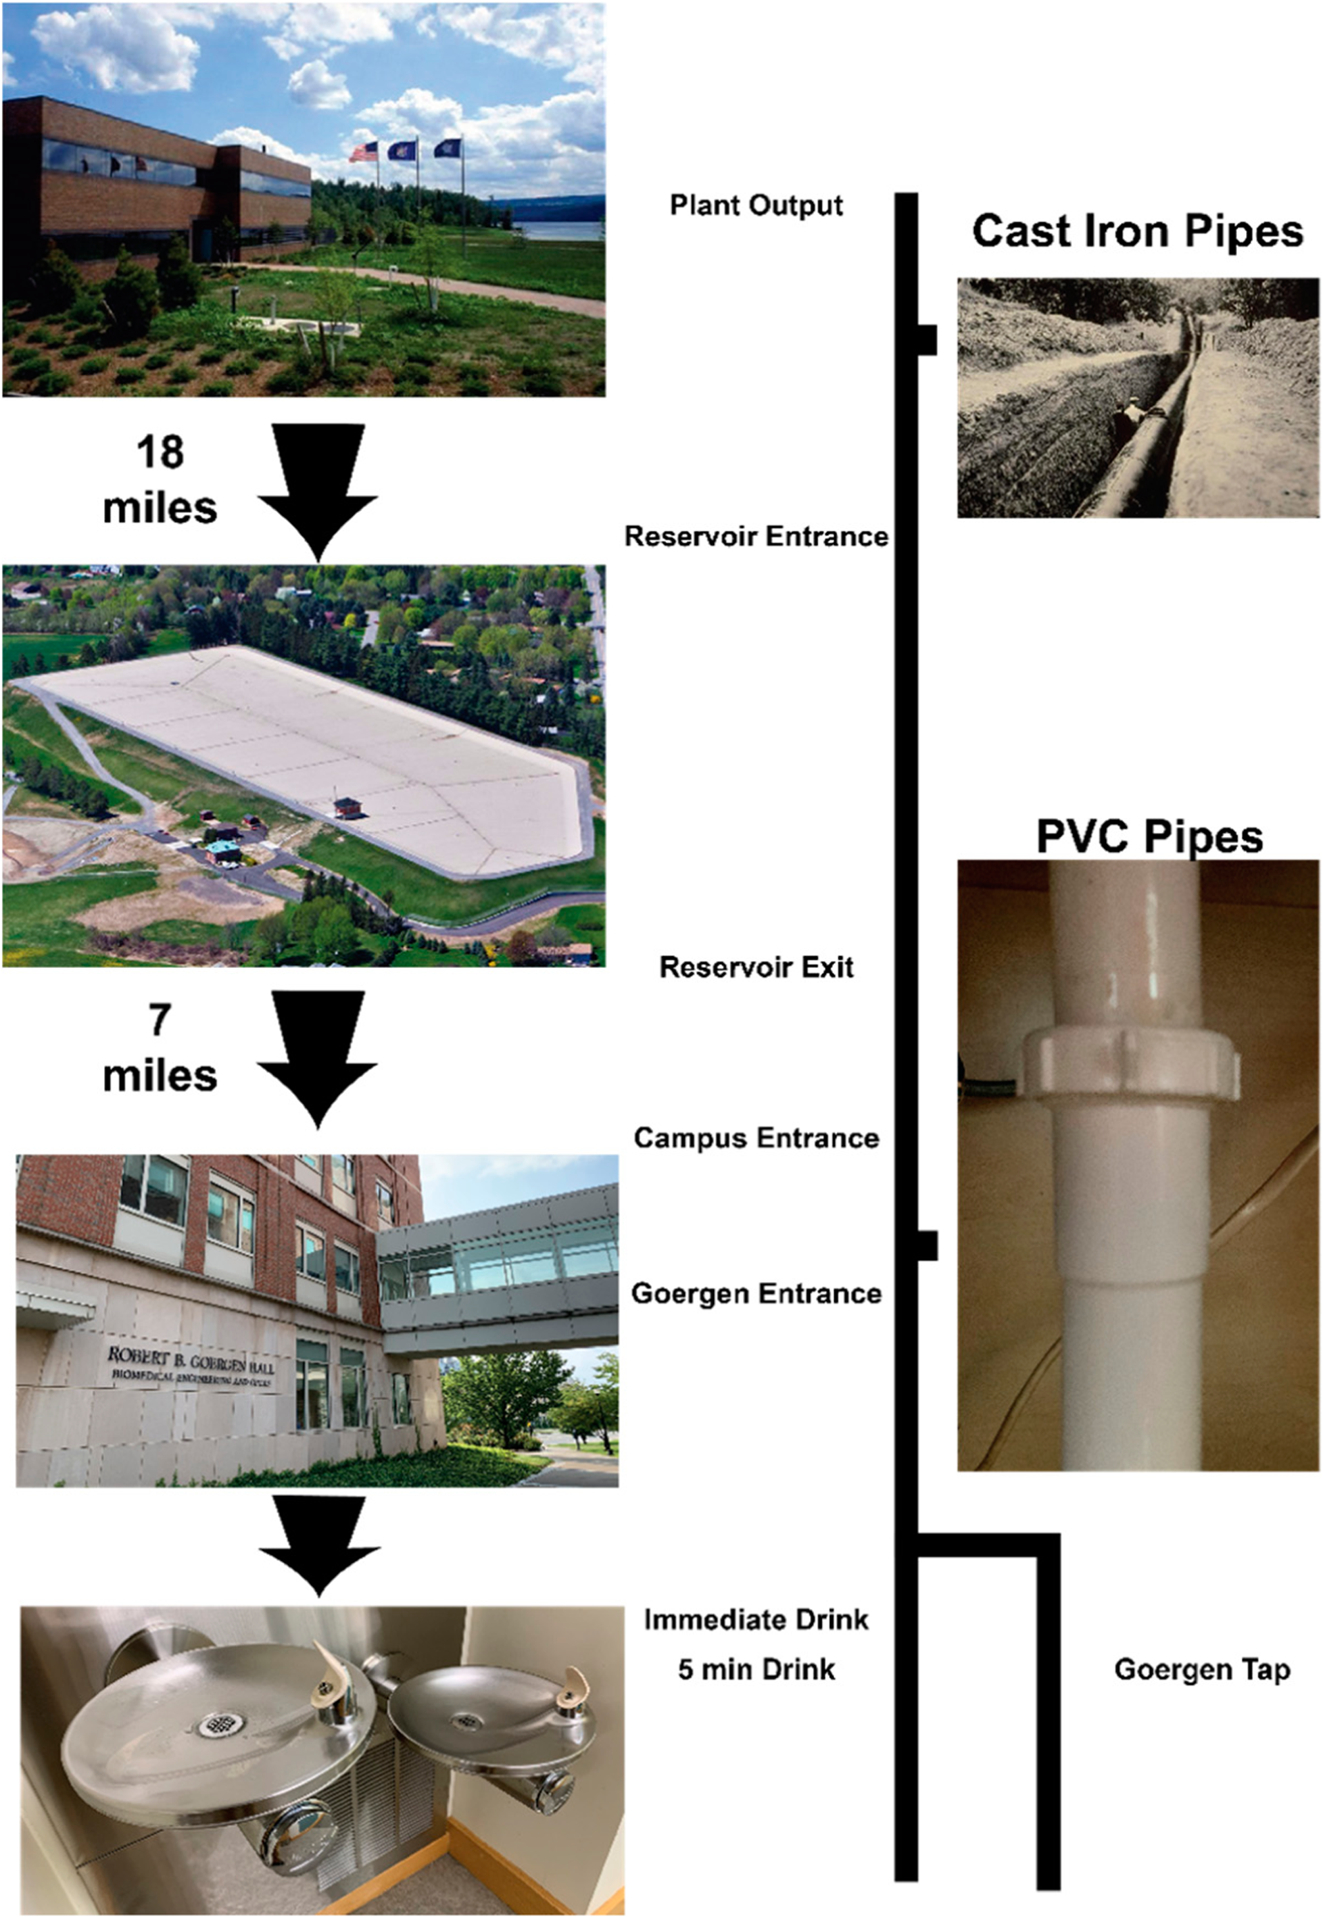
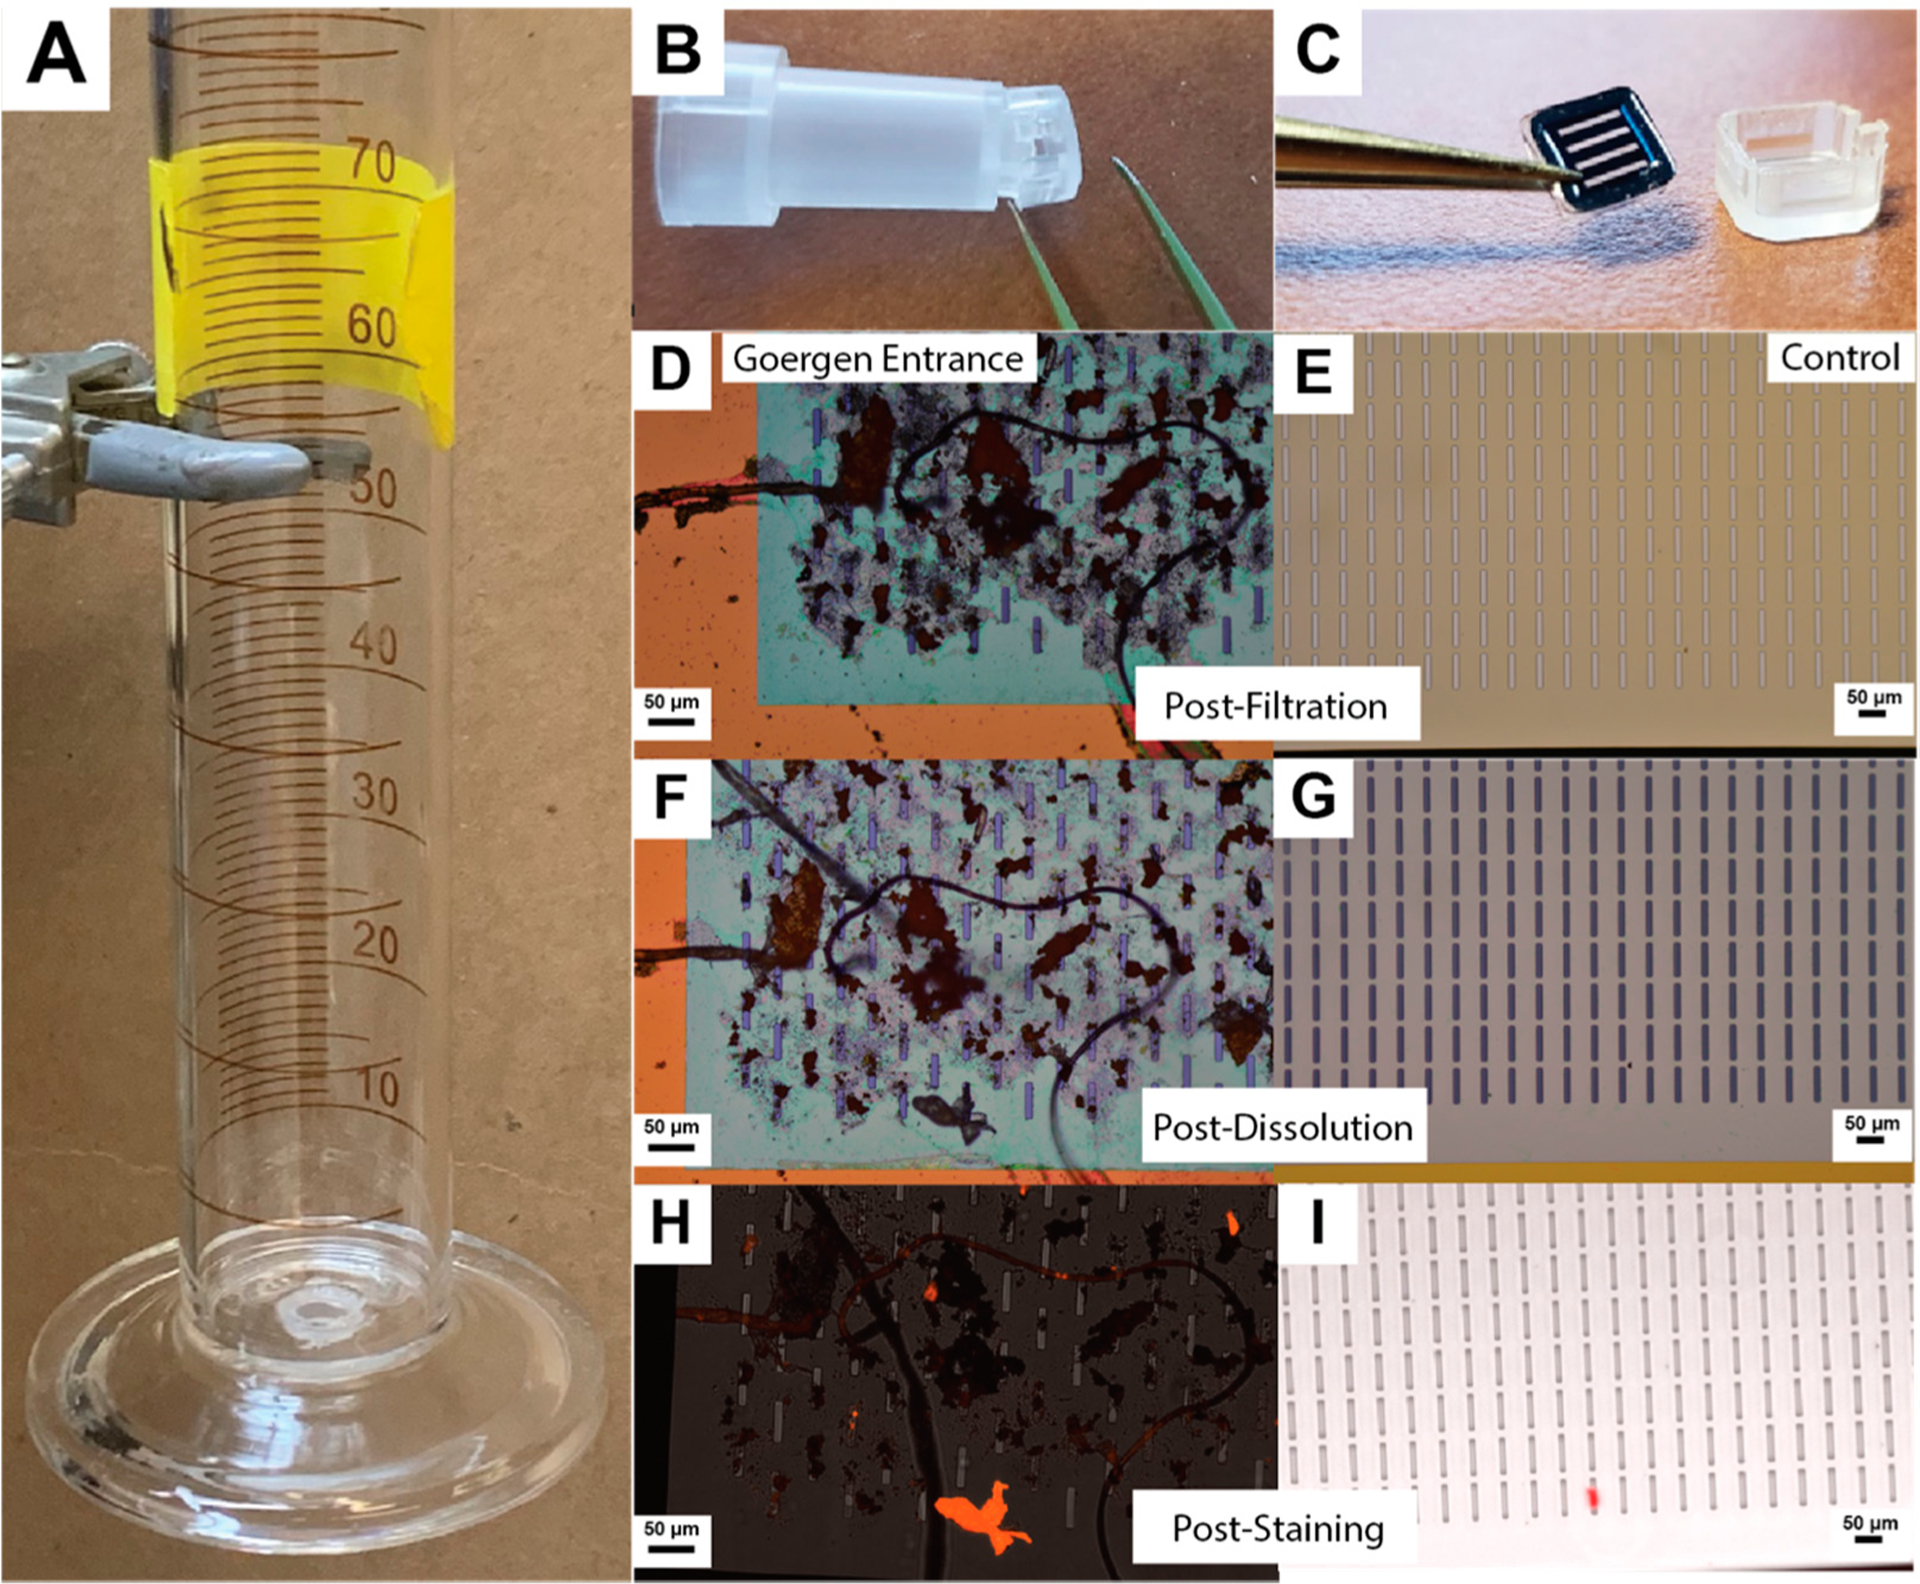
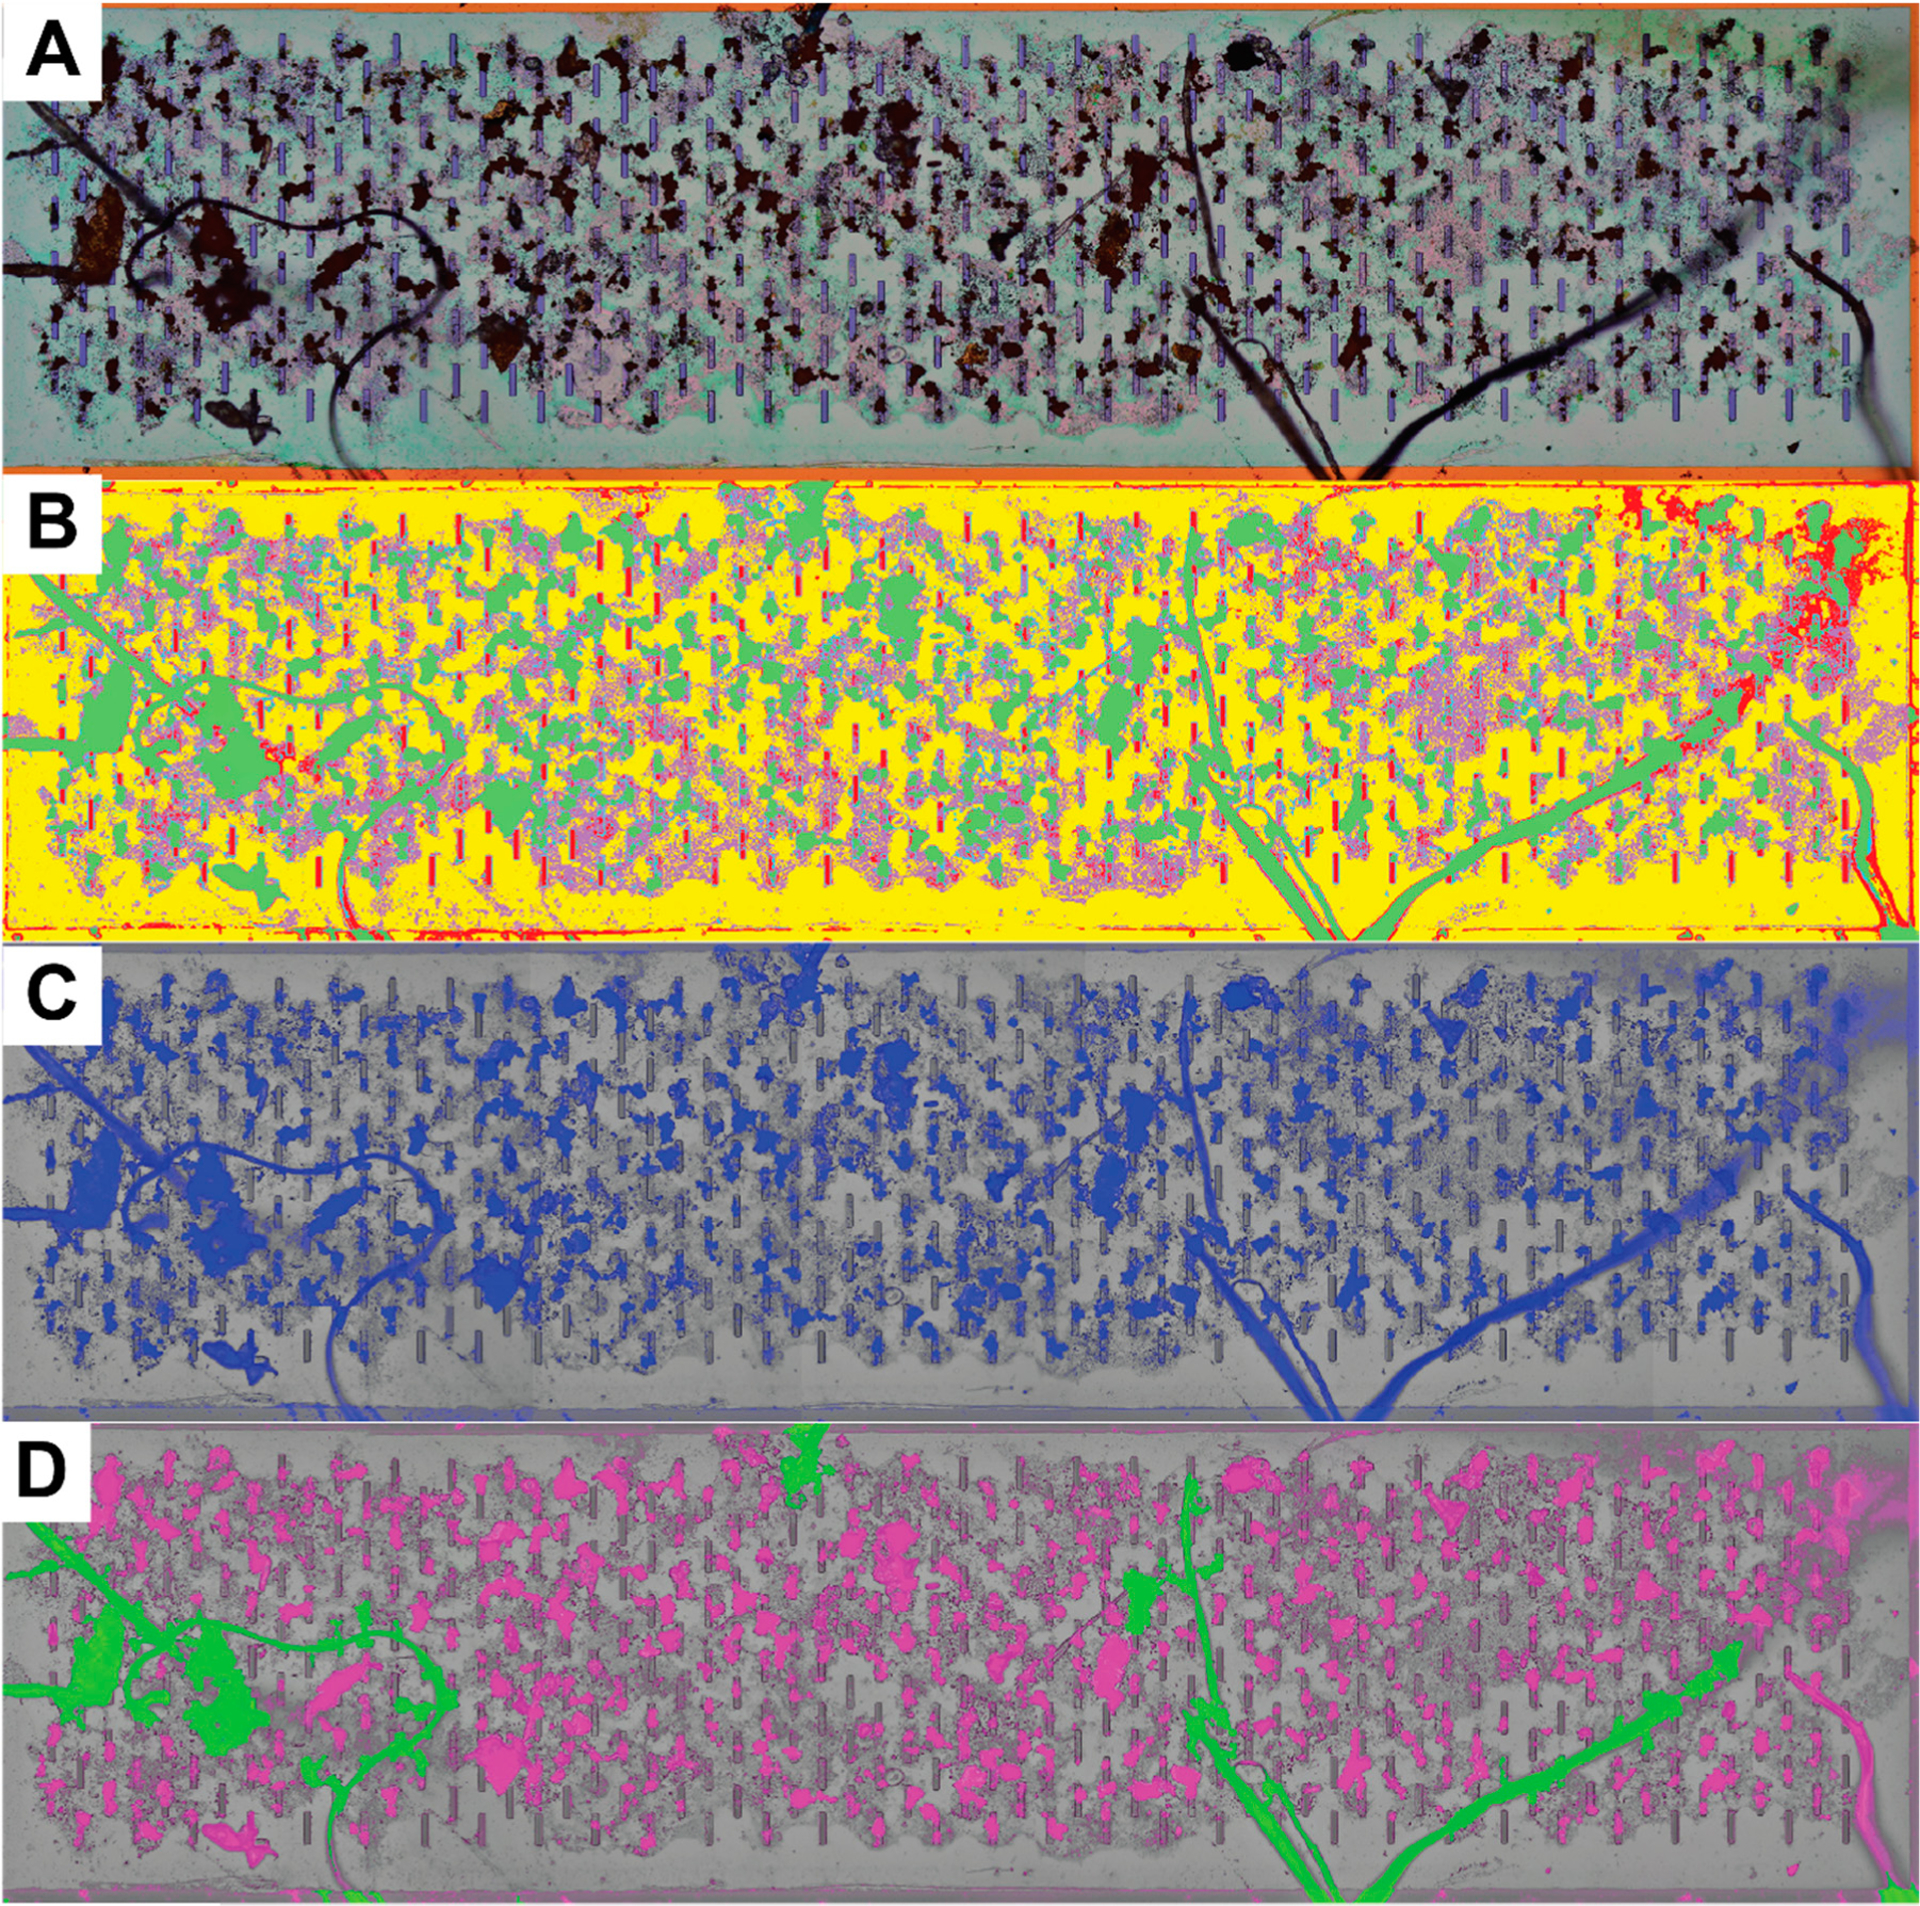
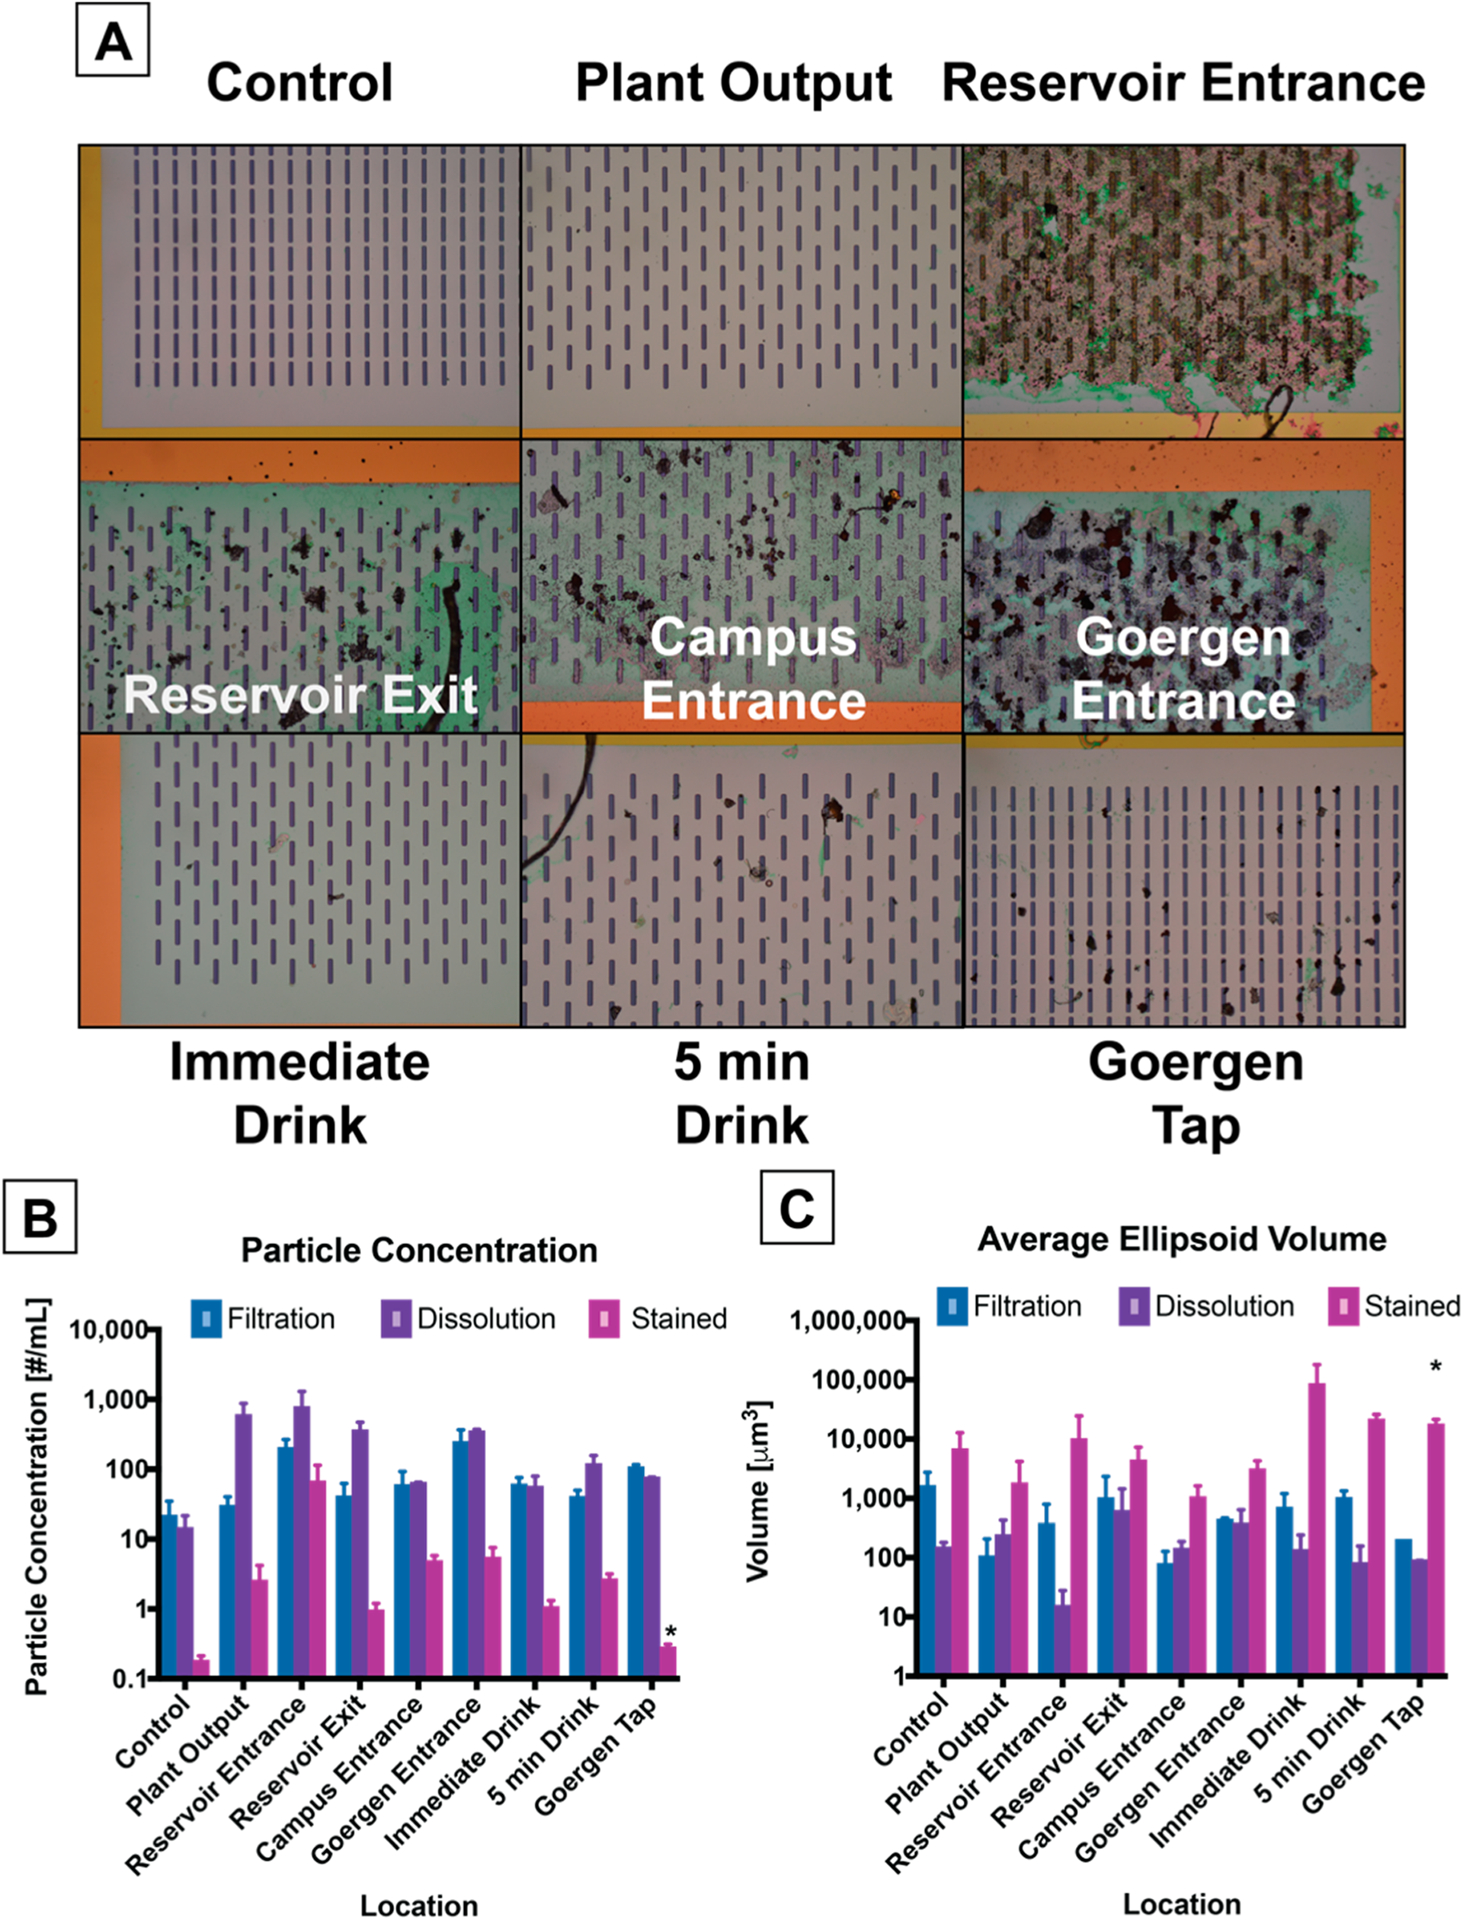
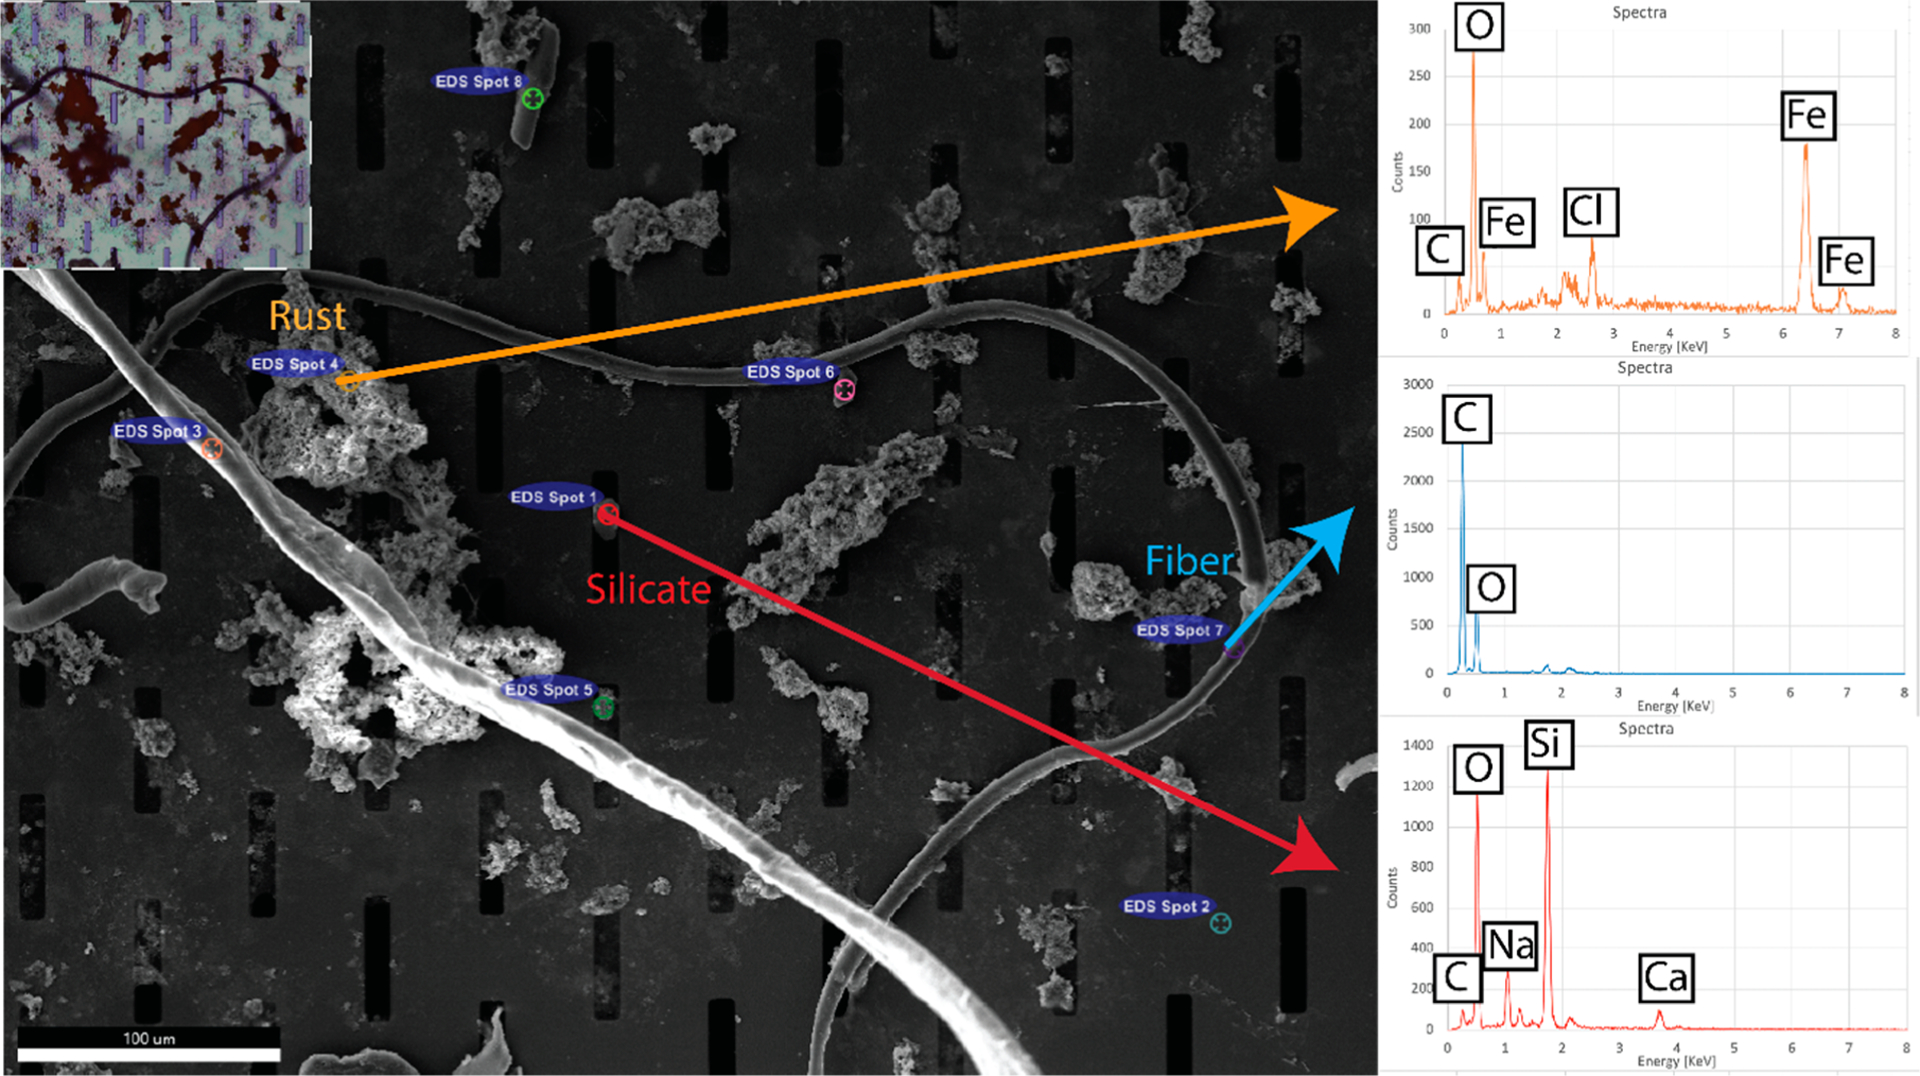
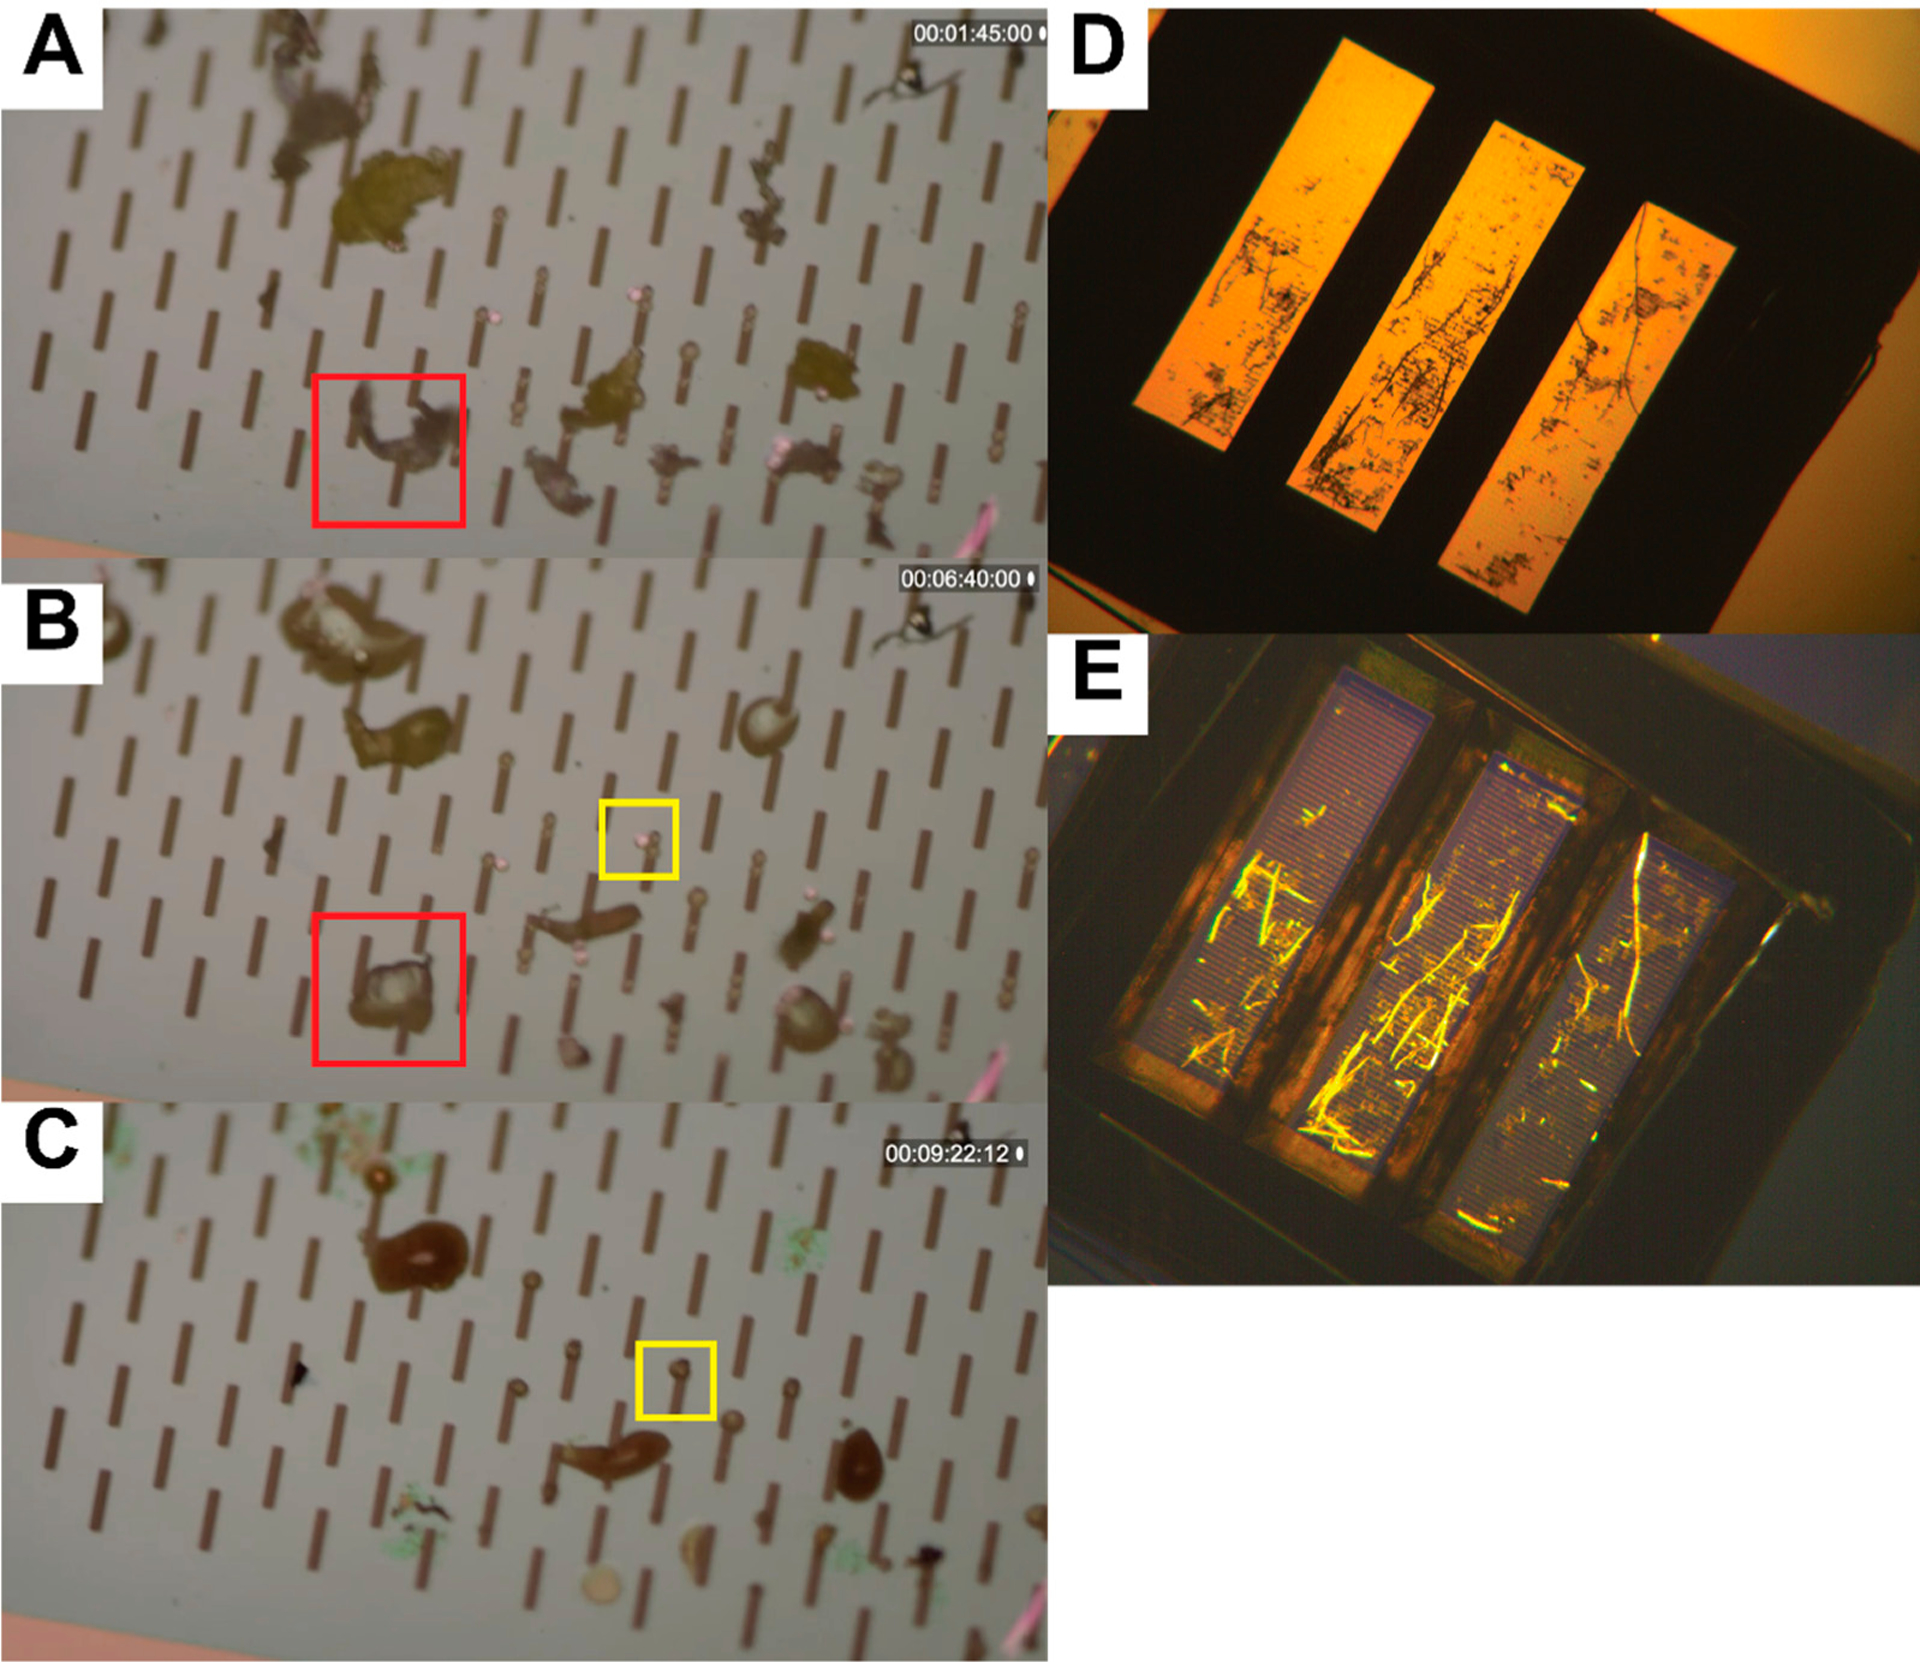
To better understand the origin of microplastics in municipal drinking water, we evaluated 50 mL water samples from different stages of the City of Rochester's drinking water production and transport route, from Hemlock Lake to the University of Rochester. We directly filtered samples using silicon nitride nanomembrane filters with precisely patterned slit-shaped pores, capturing many of the smallest particulates (<20 μm) that could be absorbed by the human body. We employed machine learning algorithms to quantify the shapes and quantity of debris at different stages of the water transport process, while automatically segregating out fibrous structures from particulate. Particulate concentrations ranged from 13 to 720 particles/mL at different stages of the water transport process and fibrous pollution ranged from 0.4 to 8.3 fibers/mL. A subset of the debris (0.2-8.6%) stained positively with Nile red dye which identifies them as hydrophobic polymers. Further spectroscopic analysis also indicated the presence of many non-plastic particulates, including rust, silicates, and calcium scale. While water leaving the Hemlock Lake facility is mostly devoid of debris, transport through many miles of piping results in the entrainment of a significant amount of debris, including plastics, although in-route reservoirs and end-stage filtration serve to reduce these concentrations.

Keywords: microplastics; municipal water; silicon nanomembrane; ultrafiltration.


Conflict of interest statement

Conflicts of Interest: James L. McGrath is a cofounder of SiMPore, Inc. Gregory R. Madejski, Wayne H. Knox, and James L. McGrath are cofounders of Parverio, Inc.

Figures

Figure 1.
Figure 1.
Sampling Path from Hemlock Lake to Goergen Hall. Water is transported through many different types of pipes and reservoirs before it is utilized at a drinking fountain on campus.
Figure 2.
Figure 2.
Direct isolation, dissolution, and staining of microparticulate debris. (A) Liquid samples (50 mL) are poured into 100 mL graduated cylinder apparatus and filtered through a silicon nanomembrane (5.4 × 5.4 mm chip, three 0.7 × 3.0 mm rectangular windows, 8 μm slits), attached at the bottom of the cylinder with a SEPCON adapter. (B,C) After filtration, the nanomembrane is removed from its protective housing and dried, (D,E) then imaged using a DIC microscope (transmission and reflection mode, white light). (F,G) After a dissolution protocol, the membranes are imaged again. (H,I) Membranes are stained with Nile Red dye as an indicator of plastic material and imaged using fluorescence (red false color, z-stack max projection).
Figure 3.
Figure 3.
Semi-Automated image segmentation and particle counting. Individual images were merged in Photoshop to create the full membrane composite (Goergen Entrance). (A) Brightfield DIC images are used to train a classifier from 5–10 manually identified regions on each sample (Simple Random Forest [27], 100 iterations) (B) producing a set of probability maps for each classification (debris-green, slot-red, edge-cyan (thin features that are not visible here), membrane-yellow, and residue-purple). (C) The debris probability map is thresholded (Auto-threshold [33], Minimum 150 counts, overlaid in blue), then watershedded to separate aggregates. (D) Fibers (green) are extracted from particulate (magenta) analysis.
Figure 4.
Figure 4.
Particulate quantification along the water transport route. (A) Representative images of the captured particulate are shown (10× objective magnification, 8 μm wide slits). (B) Particle Concentration normalized to the volume of water filtered. (C) Average volume of a particle calculated from minor and major axis of image projection. N = 3 replicates, 9–36 images/replicate for dissolution and filtration stages, 1–2 whole field images for stained stage (N = 2 for asterisk [*]). Error bars are the standard error of the mean.
Figure 5.
Figure 5.
EDS measurement of debris captured on silicon nanomembrane. (Inset) Brightfield-DIC image of the region under inspection (Goergen Entrance). The placement of the microparticulate is well preserved, save an additional fiber laying down after transferring to the vacuum chamber of the SEM. Spectra taken from a number of individual microparticulates show a variety of elemental compositions, including likely identifications of rust and sand.
Figure 6.
Figure 6.
Alternative methods for material characterizations on silicon nanomembranes. (AC) Microplastics differentiation by glass transition temperature. (A) Polystyrene beads and polyethylene shreds are captured on silicon nanomembrane (8 μm slit width). (B) The nanomembrane is heated on a ceramic resistor (350 °C surface), and the polyethylene shreds deform as the particles reach their glass transition temperature (red box). (C) After a few minutes, the polystyrene beads deform (yellow box) as these materials reach their glass transition temperature. (D,E) Microplastics differentiation by birefringence. A plastic tea bag was shredded and captured onto a silicon nanomembrane, then imaged under a bespoke polarizing microscope. (D) Viewed under yellow light, the plastic debris is not easily differentiable from tea leaf matter, however, (E) polarized illumination reveals birefringent properties of the tea bag shreds (yellow).

References

    1. Zalasiewicz J; Waters CN; Ivar do Sul JA; Corcoran PL; Barnosky AD; Cearreta A; Edgeworth M; Gałuszka A; Jeandel C; Leinfelder R; et al. The geological cycle of plastics and their use as a stratigraphic indicator of the Anthropocene. Anthropocene 2016, 13, 4–17.
    1. Mani T; Hauk A; Walter U; Burkhardt-Holm P Microplastics Profile along the Rhine River. Sci. Rep 2015, 5, 17988. - PMC - PubMed
    1. Blettler MCM; Ulla MA; Rabu etti AP; Garello N Plastic pollution in freshwater ecosystems: Macro-, meso-, and microplastic debris in a floodplain lake. Environ. Monit. Assess 2017, 189, 581. - PubMed
    1. Wang W; Ndungu AW; Li Z; Wang J Microplastics pollution in inland freshwaters of China: A case study in urban surface waters of Wuhan, China. Sci. Total Environ 2017, 575, 1369–1374. - PubMed
    1. Allen S; Allen D; Phoenix VR; Le Roux G; Durántez Jiménez P; Simonneau A; Binet S; Galop D Atmospheric transport and deposition of microplastics in a remote mountain catchment. Nat. Geosci 2019, 12, 339–344.