

Anti-G protein antibodies targeting the RSV G protein CX3C chemokine region improve the interferon response
- PMID: 36938145
- PMCID: PMC10017941
- DOI: 10.1177/20499361231161157
Anti-G protein antibodies targeting the RSV G protein CX3C chemokine region improve the interferon response
Abstract
Background: Respiratory syncytial virus (RSV) is a poor inducer of antiviral interferon (IFN) responses which result in incomplete immunity and RSV disease. Several RSV proteins alter antiviral responses, including the non-structural proteins (NS1, NS2) and the major viral surface proteins, that is, fusion (F) and attachment (G) proteins. The G protein modifies the host immune response to infection linked in part through a CX3 C chemokine motif. Anti-G protein monoclonal antibodies (mAbs), that is, clones 3D3 and 2D10 that target the G protein CX3C chemokine motif can neutralize RSV and inhibit G protein-CX3CR1 mediated chemotaxis.
Objectives: Determine how monoclonal antibodies against the RSV F and G proteins modify the type I and III IFN responses to RSV infection.
Design: As the G protein CX3 C motif is implicated in IFN antagonism, we evaluated two mAbs that block G protein CX3C-CX3CR1 interaction and compared responses to isotype mAb control using a functional cellular assay and mouse model.
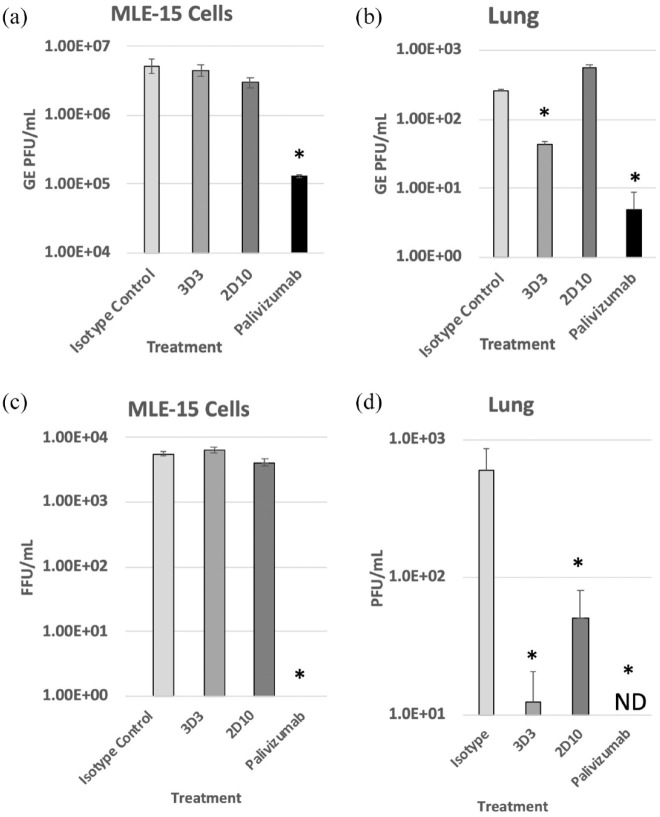
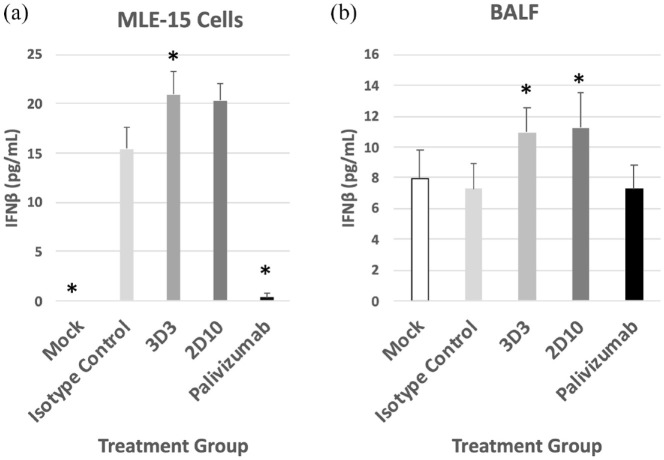
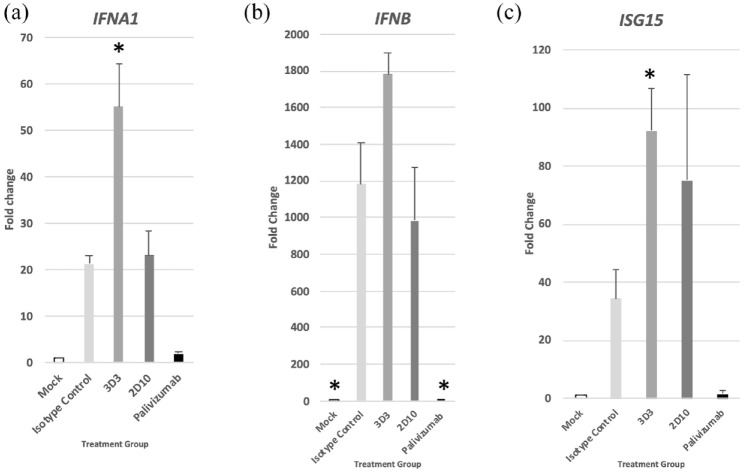
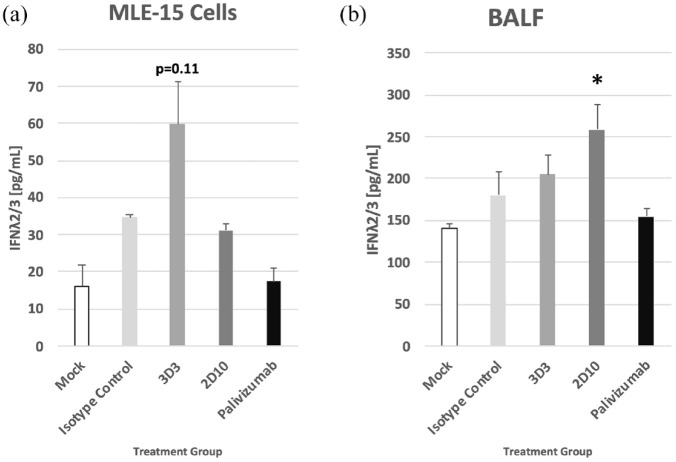
Methods: Mouse lung epithelial cells (MLE-15 cells) and BALB/c mice were infected with RSV Line19 F following prophylactic mAb treatment. Cell supernatant or bronchoalveolar lavage fluid (BALF) were assayed for types I and III IFNs. Cells were interrogated for changes in IFN-related gene expression.
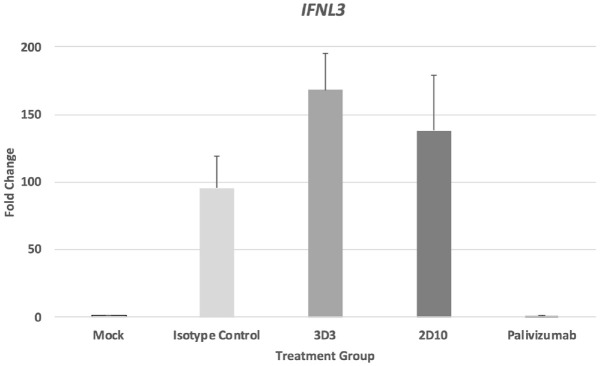
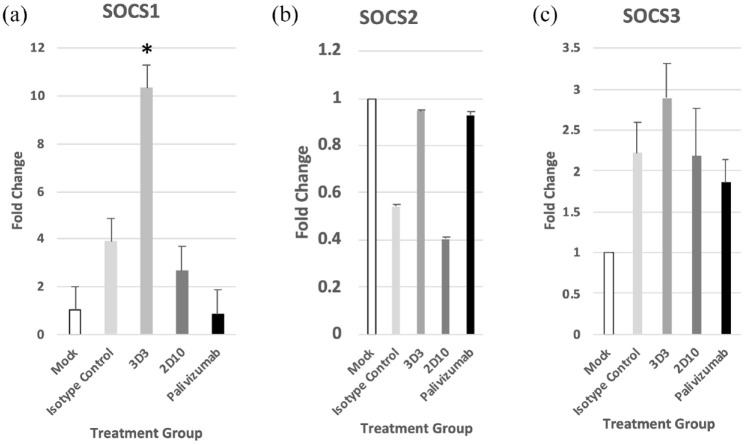
Results: Treatment with an anti-G protein mAb (3D3) resulted in improved IFN responses compared with isotype control following infection with RSV, partially independently of neutralization, and this was linked to upregulated SOCS1 expression.
Conclusions: These findings show that anti-G protein antibodies improve the protective early antiviral response, which has important implications for vaccine and therapeutic design.
Plain language summary: RSV is a leading cause of respiratory disease in infants and the elderly. The only Food and Drug Administration-approved prophylactic treatment is limited to an anti-F protein monoclonal antibody (mAb), that is, palivizumab which has modest efficacy against RSV disease. Accumulating evidence suggests that targeting the RSV attachment (G) protein may provide improved protection from RSV disease. It is known that the G protein is an IFN antagonist, and IFN has been shown to be protective against RSV disease. In this study, we compared IFN responses in mouse lung epithelial (MLE-15) cells and in mice infected with RSV Line19 F treated with anti-G protein or anti-F protein mAbs. The levels of type I and III IFNs were determined. Anti-G protein mAbs improved the levels of IFNs compared with isotype-treated controls. These findings support the concept that anti-G protein mAbs mediate improved IFN responses against RSV disease, which may enable improved treatment of RSV infections.
Keywords: F protein; G protein; IFN; ISG; Line19 F; RSV; mAb; monoclonal antibody; palivizumab.
© The Author(s), 2023.
Conflict of interest statement
The authors declared the following potential conflicts of interest with respect to the research, authorship, and/or publication of this article: LMK is the founder and chief scientific officer of Trellis Bioscience.
Figures
Similar articles
-
The role of respiratory syncytial virus G protein in immune cell infection and pathogenesis.EBioMedicine. 2024 Sep;107:105318. doi: 10.1016/j.ebiom.2024.105318. Epub 2024 Aug 31. EBioMedicine. 2024. PMID: 39217853 Free PMC article. Review.
-
Immune Prophylaxis Targeting the Respiratory Syncytial Virus (RSV) G Protein.Viruses. 2023 Apr 27;15(5):1067. doi: 10.3390/v15051067. Viruses. 2023. PMID: 37243153 Free PMC article.
-
Respiratory syncytial virus G protein CX3C motif impairs human airway epithelial and immune cell responses.J Virol. 2013 Dec;87(24):13466-79. doi: 10.1128/JVI.01741-13. Epub 2013 Oct 2. J Virol. 2013. PMID: 24089561 Free PMC article.
-
Anti-respiratory syncytial virus (RSV) G monoclonal antibodies reduce lung inflammation and viral lung titers when delivered therapeutically in a BALB/c mouse model.Antiviral Res. 2018 Jun;154:149-157. doi: 10.1016/j.antiviral.2018.04.014. Epub 2018 Apr 17. Antiviral Res. 2018. PMID: 29678551 Free PMC article.
-
An Unexpected Encounter: Respiratory Syncytial Virus Nonstructural Protein 1 Interacts with Mediator Subunit MED25.J Virol. 2022 Oct 12;96(19):e0129722. doi: 10.1128/jvi.01297-22. Epub 2022 Sep 14. J Virol. 2022. PMID: 36102648 Free PMC article. Review.
Cited by
-
Respiratory syncytial virus (RSV): over 60 years of research but still so many unanswered questions.Ther Adv Infect Dis. 2023 Mar 21;10:20499361231159991. doi: 10.1177/20499361231159991. eCollection 2023 Jan-Dec. Ther Adv Infect Dis. 2023. PMID: 36968553 Free PMC article. No abstract available.
-
Association of disease severity and genetic variation during primary Respiratory Syncytial Virus infections.BMC Med Genomics. 2024 Jun 19;17(1):165. doi: 10.1186/s12920-024-01930-7. BMC Med Genomics. 2024. PMID: 38898440 Free PMC article.
-
Interferons-Implications in the Immune Response to Respiratory Viruses.Microorganisms. 2023 Aug 29;11(9):2179. doi: 10.3390/microorganisms11092179. Microorganisms. 2023. PMID: 37764023 Free PMC article. Review.
-
Vesicular Stomatitis Virus: Insights into Pathogenesis, Immune Evasion, and Technological Innovations in Oncolytic and Vaccine Development.Viruses. 2024 Dec 18;16(12):1933. doi: 10.3390/v16121933. Viruses. 2024. PMID: 39772239 Free PMC article. Review.
-
The role of respiratory syncytial virus G protein in immune cell infection and pathogenesis.EBioMedicine. 2024 Sep;107:105318. doi: 10.1016/j.ebiom.2024.105318. Epub 2024 Aug 31. EBioMedicine. 2024. PMID: 39217853 Free PMC article. Review.
References
-
- Boyoglu-Barnum S, Tripp RA. Up-to-date role of biologics in the management of respiratory syncytial virus. Expert Opin Biol Ther 2020; 20: 1073–1082. - PubMed
-
- Dalziel SR, Haskell L, O’Brien S, et al.. Bronchiolitis. Lancet 2022; 400: 392–406. - PubMed
-
- Georgescu G, Chemaly RF. Palivizumab: where to from here? Expert Opin Biol Ther 2009; 9: 139–147. - PubMed
-
- Bergeron HC, Tripp RA. Emerging small and large molecule therapeutics for respiratory syncytial virus. Expert Opin Investig Drugs 2020; 29: 285–294. - PubMed
LinkOut - more resources
Full Text Sources
Research Materials
Miscellaneous
