. 2023 Mar 4;9(3):e14219.
doi: 10.1016/j.heliyon.2023.e14219. eCollection 2023 Mar.

Clinical symptoms and immune injury reflected by low CD4/CD8 ratio should increase the suspicion of HIV coinfection with tuberculosis

Affiliations

Clinical symptoms and immune injury reflected by low CD4/CD8 ratio should increase the suspicion of HIV coinfection with tuberculosis

Li Li et al. Heliyon. .

Abstract

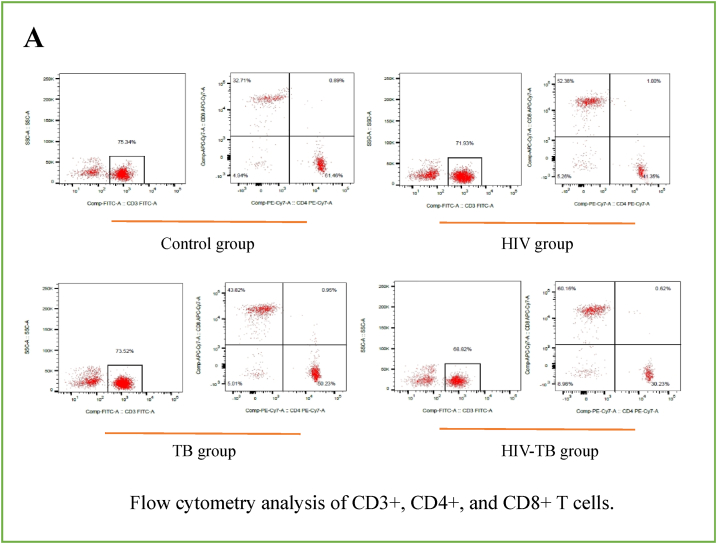
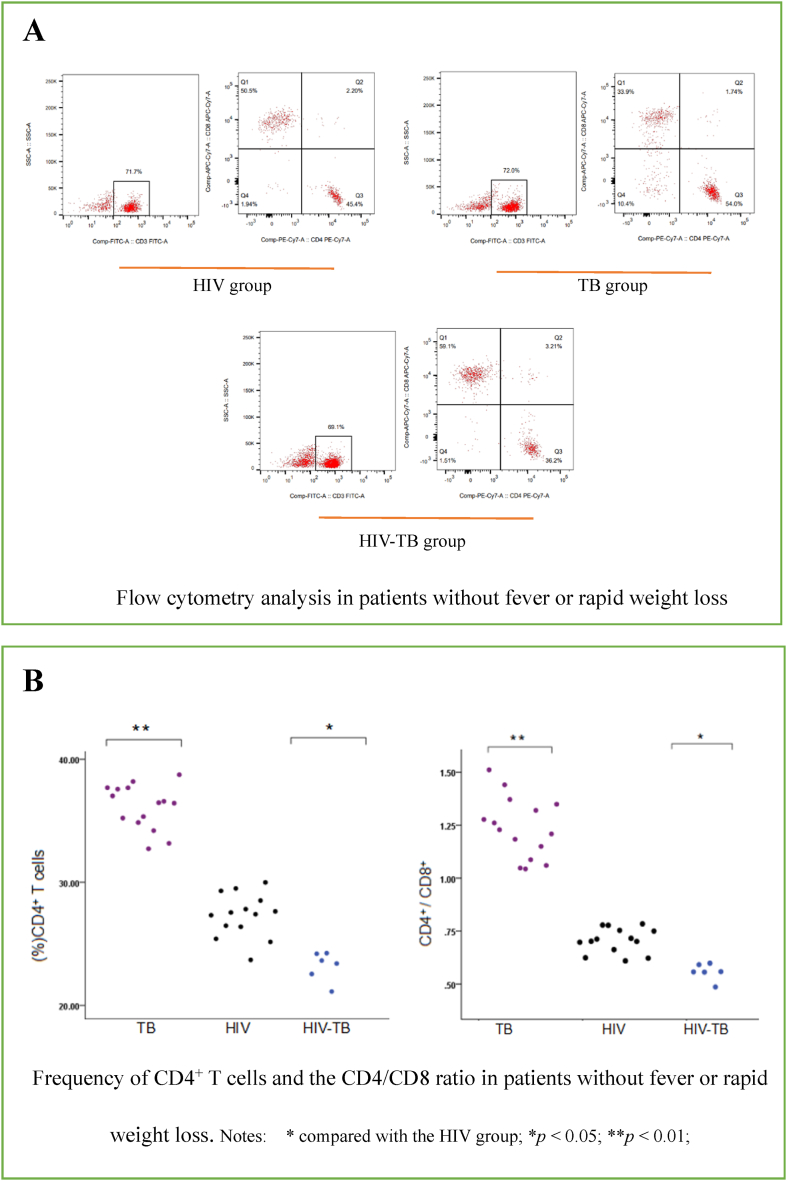
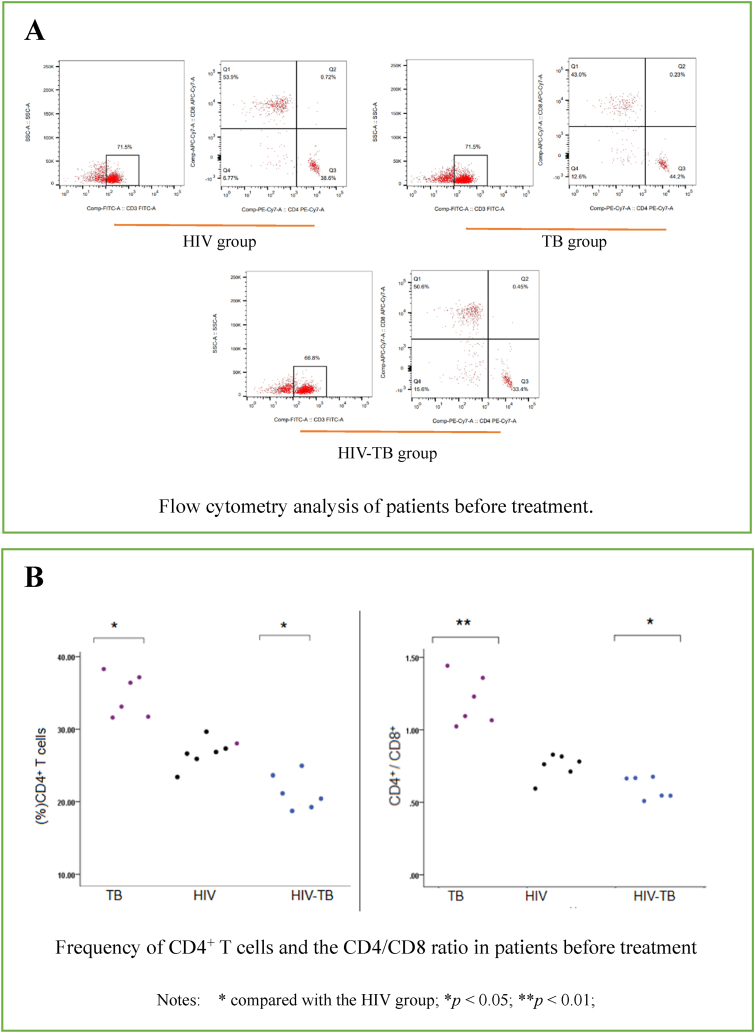
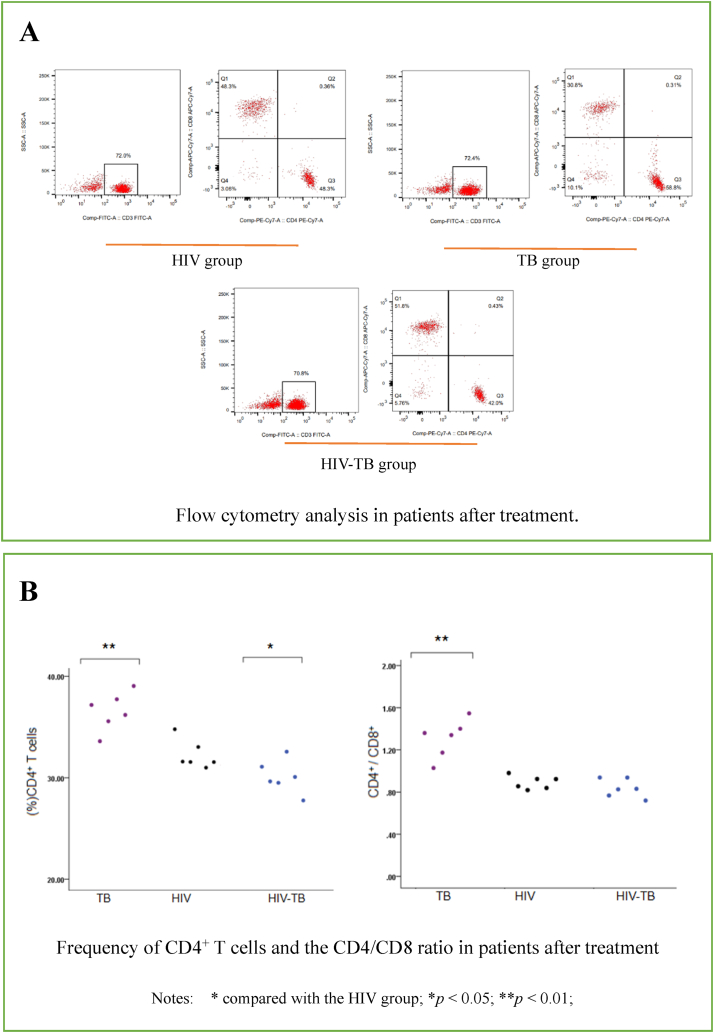
Background: Patients who are coinfected with human immunodeficiency virus 1 (HIV) and Mycobacterium tuberculosis (TB) benefit from timely diagnosis and treatment. In the present study frequencies of CD3+, CD4+, and CD8+ T cells among peripheral blood mononuclear cells (PBMCs) of patients in the Kashi region of China infected with HIV, TB, and both HIV and TB (HIV-TB) were investigated to provide a basis for rapid identification of coinfected patients.

Methods: A total of 62 patients with HIV, TB, or HIV-TB who were first hospitalized at our institution were included in the study, as were 30 controls. PBMCs were isolated, and the frequencies of CD3+, CD4+, and CD8+ T cells were determined via flow cytometry.

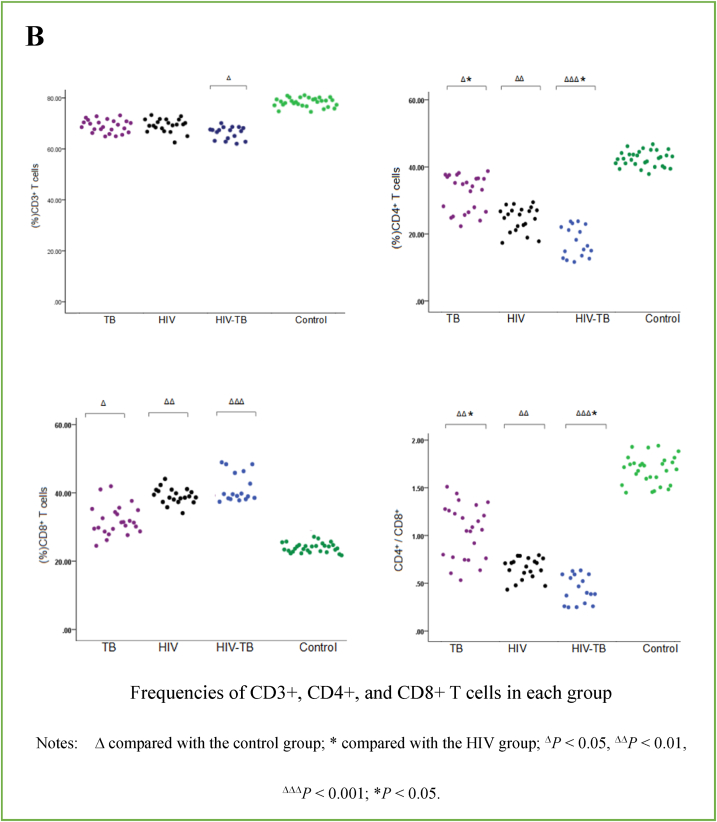
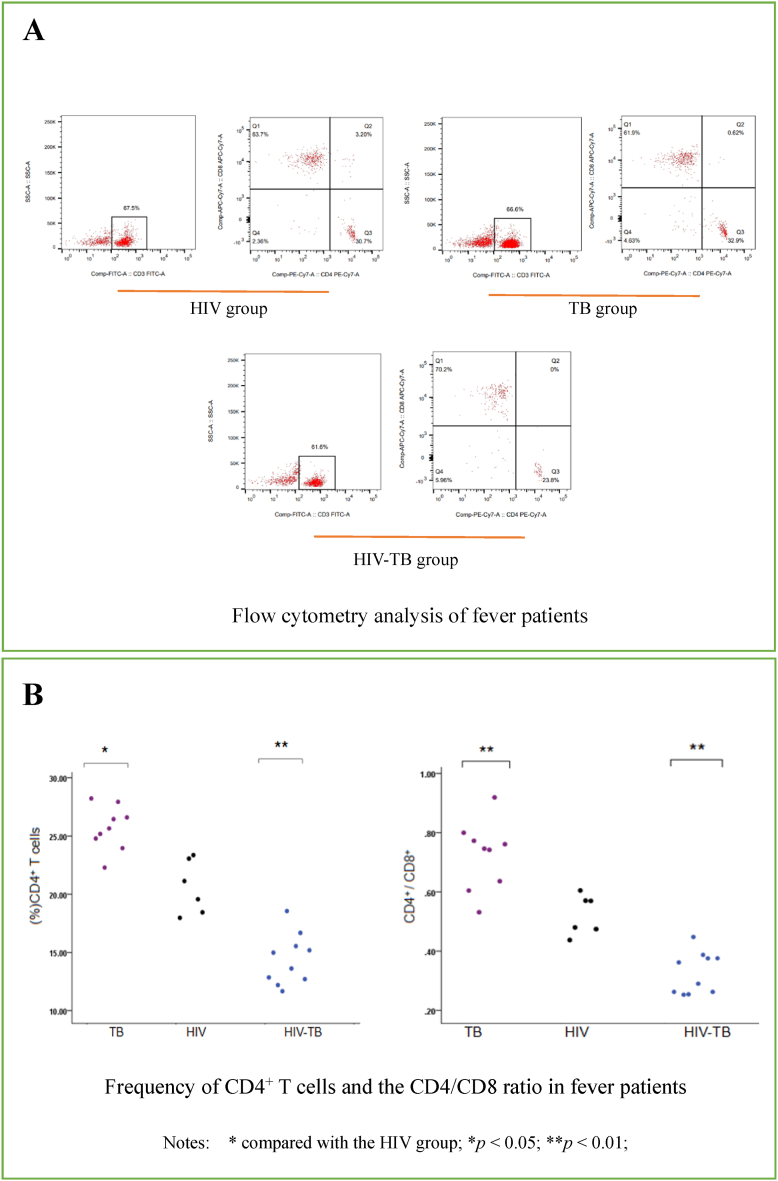
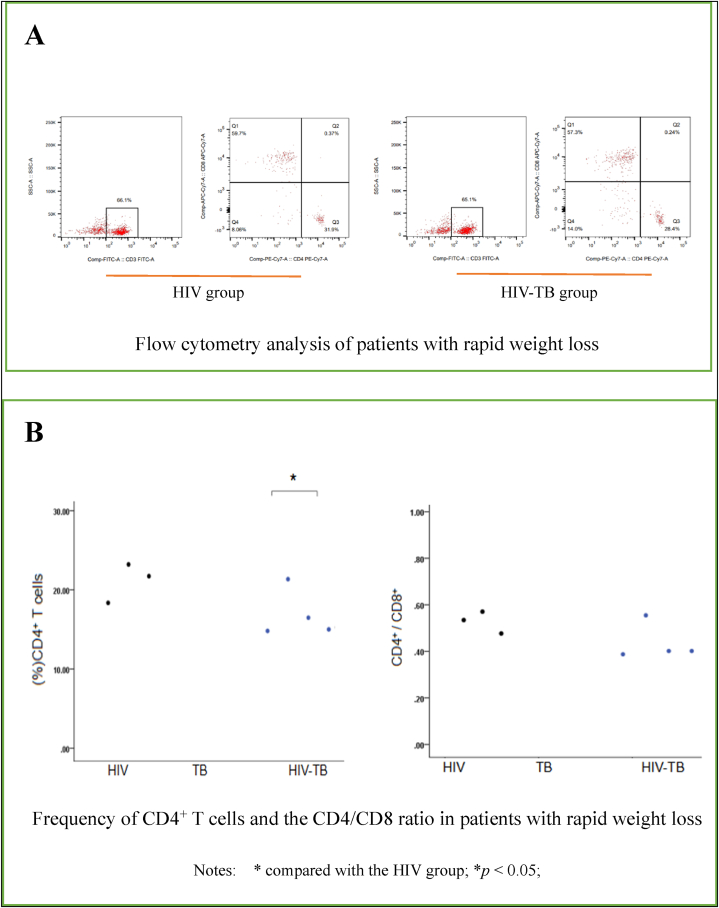
Results: The frequency of CD4+ T cells and the CD4/CD8 ratio were significantly lower in the HIV-TB group than in the other three groups. In fever patients the frequency of CD4+ T cells and the CD4/CD8 ratio were significantly lower in the HIV-TB group than in the HIV group and the TB group. In patients who exhibited rapid weight loss there were no significant differences in the frequency of CD4+ T cells or the CD4/CD8 ratio between the groups. The results of treatment were compared in the HIV, TB, and HIV-TB groups after 7 days, and there were obvious improvements in the frequency of CD4+ T cells and the CD4/CD8 ratio.

Conclusion: Clinical symptoms and the degree of immune injury can heighten suspicion for HIV-TB coinfection.

Keywords: CD4+ T cells; CD4/CD8 ratio; HIV-TB coinfection.


Conflict of interest statement

The authors declare no competing interests.

Figures

Fig. 1
Fig. 1
a Flow cytometry analysis of CD3+, CD4+, and CD8+ T cells. b Frequencies of CD3+, CD4+, and CD8+ T cells in each group. Notes: Δ compared with the control group; * compared with the HIV group; ΔP < 0.05, ΔΔP < 0.01,ΔΔΔP < 0.001; *P < 0.05.
Fig. 1
Fig. 1
a Flow cytometry analysis of CD3+, CD4+, and CD8+ T cells. b Frequencies of CD3+, CD4+, and CD8+ T cells in each group. Notes: Δ compared with the control group; * compared with the HIV group; ΔP < 0.05, ΔΔP < 0.01,ΔΔΔP < 0.001; *P < 0.05.
Fig. 2
Fig. 2
a Flow cytometry analysis of fever patients. b Frequency of CD4+ T cells and the CD4/CD8 ratio in fever patients. Notes: * compared with the HIV group; *p < 0.05; **p < 0.01.
Fig. 3
Fig. 3
a Flow cytometry analysis of patients with rapid weight loss. b Frequency of CD4+ T cells and the CD4/CD8 ratio in patients with rapid weight loss. Notes: * compared with the HIV group; *p < 0.05.
Fig. 4
Fig. 4
a Flow cytometry analysis in patients without fever or rapid weight loss. b Frequency of CD4+ T cells and the CD4/CD8 ratio in patients without fever or rapid weight loss. Notes: * compared with the HIV group; *p < 0.05; **p < 0.01.
Fig. 5
Fig. 5
a Flow cytometry analysis of patients before treatment. b Frequency of CD4+ T cells and the CD4/CD8 ratio in patients before treatment. Notes: * compared with the HIV group; *p < 0.05; **p < 0.01.
Fig. 6
Fig. 6
a Flow cytometry analysis in patients after treatment. b Frequency of CD4+ T cells and the CD4/CD8 ratio in patients after treatment. Notes: * compared with the HIV group; *p < 0.05; **p < 0.01.

Similar articles

Cited by

References

    1. Douek D.C., Roederer M., Koup R.A. Emerging concepts in the immunopathogenesis of AIDS. Annu. Rev. Med. 2009;60:471–484. doi: 10.1146/annurev.med.60.041807.123549. - DOI - PMC - PubMed
    1. Deeks S.G., Kitchen C.M.R., Liu L., et al. Immune activation set point during early HIV infection predicts subsequent CD4+ T-cell changes independent of viral load. Blood. 2004;104(4):942–947. doi: 10.1182/blood-2003-09-3333. - DOI - PubMed
    1. Schnappinger D., Ehrt S., Voskuil M.I., et al. Transcriptional adaptation of Mycobacterium tuberculosis within macrophages: insights into the phagosomal environment. J. Exp. Med. 2003;198(5):693–704. doi: 10.1084/jem.20030846. - DOI - PMC - PubMed
    1. Whalen C., Horsburgh C.R., Hom D., et al. Accelerated course of human immunodeficiency virus infection after tuberculosis. Am. J. Respir. Crit. Care Med. 1995;151(1):129–135. doi: 10.1164/ajrccm.151.1.7812542. - DOI - PubMed
    1. Badri M., Ehrlich R., Wood R., et al. Association between tuberculosis and HIV disease progression in a high tuberculosis prevalence area. Int. J. Tubercul. Lung Dis. 2001;5:225–232. - PubMed