. 2023 Feb 1;2(3):pgad005.
doi: 10.1093/pnasnexus/pgad005. eCollection 2023 Mar.

Shifting social-ecological fire regimes explain increasing structure loss from Western wildfires

Affiliations

Shifting social-ecological fire regimes explain increasing structure loss from Western wildfires

Philip E Higuera et al. PNAS Nexus. .

Abstract

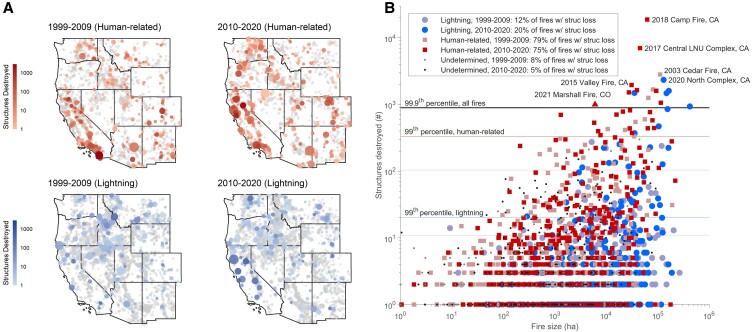
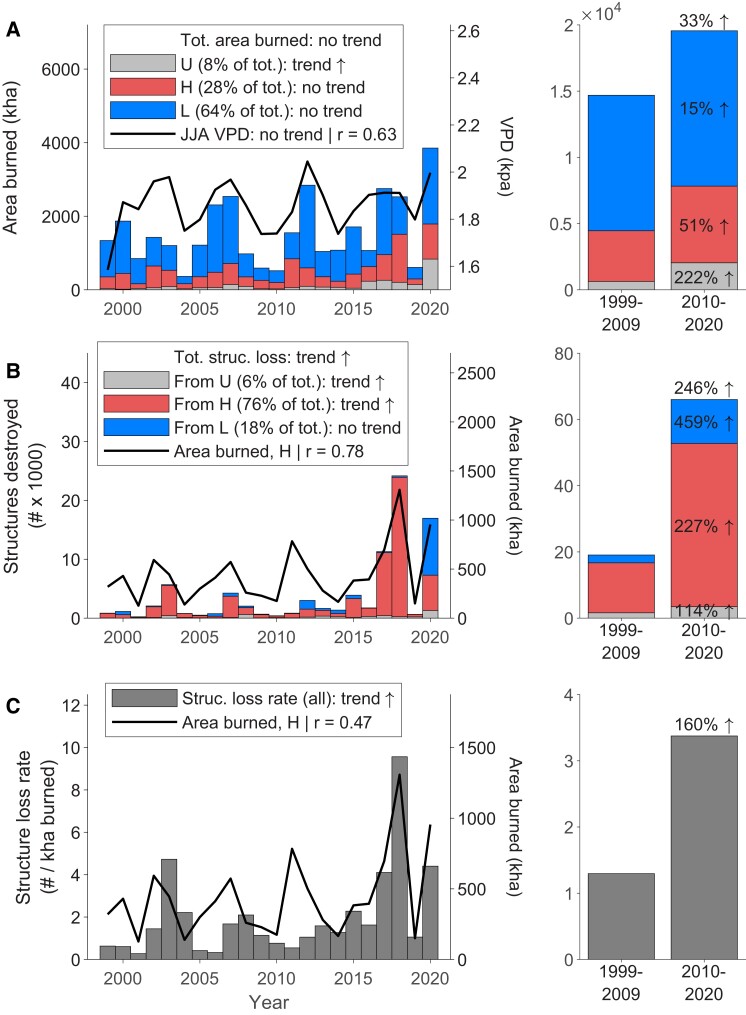
Structure loss is an acute, costly impact of the wildfire crisis in the western conterminous United States ("West"), motivating the need to understand recent trends and causes. We document a 246% rise in West-wide structure loss from wildfires between 1999-2009 and 2010-2020, driven strongly by events in 2017, 2018, and 2020. Increased structure loss was not due to increased area burned alone. Wildfires became significantly more destructive, with a 160% higher structure-loss rate (loss/kha burned) over the past decade. Structure loss was driven primarily by wildfires from unplanned human-related ignitions (e.g. backyard burning, power lines, etc.), which accounted for 76% of all structure loss and resulted in 10 times more structures destroyed per unit area burned compared with lightning-ignited fires. Annual structure loss was well explained by area burned from human-related ignitions, while decadal structure loss was explained by state-level structure abundance in flammable vegetation. Both predictors increased over recent decades and likely interacted with increased fuel aridity to drive structure-loss trends. While states are diverse in patterns and trends, nearly all experienced more burning from human-related ignitions and/or higher structure-loss rates, particularly California, Washington, and Oregon. Our findings highlight how fire regimes-characteristics of fire over space and time-are fundamentally social-ecological phenomena. By resolving the diversity of Western fire regimes, our work informs regionally appropriate mitigation and adaptation strategies. With millions of structures with high fire risk, reducing human-related ignitions and rethinking how we build are critical for preventing future wildfire disasters.

Keywords: anthropogenic wildfires; fire disasters; human impacts; western United States; wildfire crisis.


Figures

Fig. 1.
Fig. 1.
Area burned and structure loss from wildfires in the western United States, 1999–2020. (A) Geographic distribution of wildfires, by ignition source (rows) and time period (columns). Circle size represents fire size (log scale), color represents structure loss (log scale), with gray indicating no associated structure loss. (B) Total structure loss as a function of fire size for the 1,825 fires from A (12% of total) with associated structure loss, stratified by ignition source and time period. Extremes are defined by 99th percentile for each ignition type and decade, and by the 99.9th percentile for the overall data set. Legend includes the percent of total fires in each category with structure loss. Note: the 2021 Marshall Fire (triangle) is included as an example but is not part of the 1999–2020 data set analyzed; although it occurred without regional lightning activity, at time of publication it has a yet-undetermined ignition source.
Fig. 2.
Fig. 2.
Temporal patterns of area burned and structure loss from wildfires in the western United States. (A) Annual area burned, by ignition source, and annual average June–August vapor pressure deficit (JJA VPD): “H” unplanned human-related ignitions; “L” lightning-caused ignitions; “U” undetermined ignition source. Only annual area burned from undetermined ignition sources exhibited a significant temporal trend over the analysis period. Annual area burned was significantly correlated with JJA VPD. Right panel summarizes statistics over the two halves of the analysis period. (B) Annual structure loss and (C) structure-loss rate (i.e. structures destroyed per 1,000 ha burned) both increased significantly over time, largely from a significant increase in structure loss from unplanned human-related ignitions. Both structure loss and the structure-loss rate were correlated with annual area burned from human-related ignitions. Temporal trends were assessed via the non-parametric Theil-Sen slope test, and correlations were assessed with a Pearson correlation (between log-transformed values); trends and correlations were considered significant at P < 0.10 level (see “Materials and methods”).
Fig. 3.
Fig. 3.
Selected fire-regime attributes by ignition source for the western United States. Fire characteristics (A–C) and fire impacts (D–F) differ significantly between fires from human-related and lightning ignitions, as summarized from 15,001 fire events between 1999 and 2020. Legends include the percent of total area burned (A, B) and total number of fires (C) accounted for by fires from each ignition source. Fire seasonality (C) and structure-loss seasonality (F) include bars spanning the season length, with * indicating difference in season length. Legends across the bottom row (D–E) include percentages for the total number of structures destroyed from fires originating from each ignition source, and total number of fires (F). For all panels except (B), “count” refers to the number of fires; median values are displayed as dots (excluding structure loss [D]; medians = 0) and are significantly different, based on a Wilcoxon rank-sum test (0.000 < P < 0.005). “Structure-loss rate” (E) is defined as the number of structures destroyed per 1,000 ha burned in a single fire event. Note: analysis for vegetation type burned is from a subset of fires (n = 6321, accounting for 75% of the total area burned in the larger data set); thus, percentages in legend differ from (A) (see “Materials and methods”).
Fig. 4.
Fig. 4.
Rank and change in fire-regime attributes for the western United States. Area burned by ignition source (A–C), and proportion of total area burned in forest vegetation (D). Climate (E), summarized by mean June–August VPD (VPD). Fire-climate relationships (F), summarized by the b parameter for regression models predicting annual area burned as a function of June–August vapor pressure deficit (n = 22, over 1999–2020). Difference in fire-season length (based on fire start dates; G) and the peak in fire ignitions (i.e. median start date; H) between human-related and lightning ignitions. Structure loss (I), structure abundance (J), and differences in the timing (K) and peak (L) of fire-related structure loss (based on fire start dates). The ordering of states differs among panels, based on the rank for each specific metric.
Fig. 5.
Fig. 5.
Predictors and correlates of annual and total structure loss from wildfires in the western United States. (A) Annual area burned from human-related ignitions explains 61% of the variability in annual structure loss. (B) Total structure loss from wildfires at the state level (1999–2020) is well explained by structure abundance in flammable vegetation (from 2010). (C) Total area burned from human-related ignitions at the state level is well correlated with structure abundance in flammable vegetation (from 2010). See Fig. S3 for the same relationships in (A) and (C), using area burned from human-related and undetermined ignitions (r2 = 0.68 for A, and r = 0.79 for C).
Fig. 6.
Fig. 6.
Changes in core components of social-ecological fire regimes in the western United States over the first two decades of the 21st century. (A) Western states plotted based on the rates of area burned (x) and structure loss (y), with circle size scaled to the percent of total area burned from human-related and undetermined ignitions. Quadrants are labeled relative to the West-wide rates from 1999 to 2009. Note: axes are log scales. (B) Changes in rates of area burned (x) and structure loss (y) between the two analysis periods (i.e. radial vector analysis of A), with triangle size scaled to change in percent of total area burned from human-related and undetermined ignitions (+/gray indicates more area burned from human and undetermined sources). Note: axes are on linear scales, to illustrate absolute change and accommodate negative changes.

References

    1. Balch JK, et al. 2022. Warming weakens the night-time barrier to global fire. Nature 602:442–448. - PubMed
    1. Jolly WM, et al. 2015. Climate-induced variations in global wildfire danger from 1979 to 2013. Nat Commun. 6:7537. - PMC - PubMed
    1. Bowman DMJS, et al. 2017. Human exposure and sensitivity to globally extreme wildfire events. Nat Ecol Evol. 1:58. - PubMed
    1. United Nations Environment Programme . 2022. Spreading like Wildfire – The rising threat of extraordinary landscape fires. A UNEP rapid response assessment. Nairobi: UNEP.
    1. USDA Forest Service . 2022. Confronting the wildfire crisis: a strategy for protecting communities and improving resilience in America's Forests. Washington (DC): US Department of Agriculture.