. 2023 Feb 3;2(3):pgad034.
doi: 10.1093/pnasnexus/pgad034. eCollection 2023 Mar.

Crisscross multilayering of cell sheets

Affiliations

Crisscross multilayering of cell sheets

Trinish Sarkar et al. PNAS Nexus. .

Abstract

Hydrostatic skeletons such as the Hydra's consist of two stacked layers of muscle cells perpendicularly oriented. In vivo, these bilayers first assemble, and then the muscle fibers of both layers develop and organize with this crisscross orientation. In the present work, we identify an alternative mechanism of crisscross bilayering of myoblasts in vitro, which results from the prior local organization of these active cells in the initial monolayer. The myoblast sheet can be described as a contractile active nematic in which, as expected, most of the +1/2 topological defects associated with this nematic order self-propel. However, as a result of the production of extracellular matrix (ECM) by the cells, a subpopulation of these comet-like defects does not show any self-propulsion. Perpendicular bilayering occurs at these stationary defects. Cells located at the head of these defects converge toward their core where they accumulate until they start migrating on top of the tail of the first layer, while the tail cells migrate in the opposite direction under the head. Since the cells keep their initial orientations, the two stacked layers end up perpendicularly oriented. This concerted process leading to a crisscross bilayering is mediated by the secretion of ECM.

Keywords: active cell nematics; collective cell behaviors; multilayers; orientation.


Figures

Fig. 1.
Fig. 1.
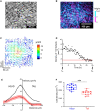
(A) C2C12 bilayer (hematoxylin stained fixed cells, bright field, contrast-enhanced) showing the perpendicular orientation of the two stacked layers. (B) Confocal image of the same showing the two stacked layers at orthogonal orientations (Fixed cells, actin labeling. The color codes for the height.) (C) Before bilayering, the average orientation field (black lines) and the velocity field (colored arrows) measured at a +1/2 defect are consistent with a contractile active nematic description (average over 5,398 observations from 350 independent defects [three independent experiments]). (D) The surface density of +1/2 defects decreases with time but plateaus at typically 2 defects/mm² several hours before the onset of bilayering (representative experiment, three replicates). (E) Average velocity profiles along the axis of the +1/2 defects. Black line: all defects (N = 350), red line: immobile defects (N = 15, 3 independent experiments). x = 0 is the position of the core. Note the zero velocity in the tail of the stationary defects while the velocity in the head remains finite. Colored areas are the SEMs. (F) As cells of the head of the immobile defects flow toward their core, the cell density increases in the head. Measurements performed in the hour preceding bilayering (N = 15, 3 independent experiments).
Fig. 2.
Fig. 2.
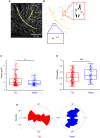
(A) Focal adhesions (FAs) (fixed cells, paxillin labeling) at a stationary +1/2 defect just before bilayering. The defect has been outlined in yellow. (B) Thresholded image. Note the elongated FAs in the tail while they are more circular in the head. (C, D) Quantification of the area and circularity of the FAs in the tail and head regions of the stationary defects (4 independent defects from two independent experiments). Although the distributions of the FAs’ areas are very similar, FAs in the tail are more elongated (circularity in the head = 0.4 ± 0.2 (SD); in the tail = 0.5 ± 0.2 (SD); p = 5E-5). (E) Corresponding histograms of the orientations of the FAs in the tail (red) and in the head (blue) of stationary defects. The defects are oriented along the 0° direction.
Fig. 3.
Fig. 3.
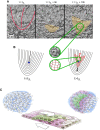
(A) Sequence of snapshots (phase contrast) illustrating the progression of the bilayering. The orange area highlights the crisscross bilayer. The outline of the defect at t = t2L is shown as a red line. See full movie in Movie S2. (B) Schematic of the bilayering process. The red lines correspond to the orientation field lines of layer 2 while the black lines refer to layer 1. The blue dot shows the initial position of the core. Note the crisscross organization of the two layers when t > t2L (insets). (C) Artist view of the bilayering process. Note that this is an idealized picture. In reality, layers 1 and 2 are very thin and their heights are not as well defined as depicted. As a consequence, layers 1 and 2 are somewhat intertwined. Moreover, parallel bilayering, which results from single cells being extruded from layer 1, is not represented in this panel.
Fig. 4.
Fig. 4.
(A) Fibrillar ExtraCellular Matrix mediates cell–cell and cell–substrate contacts (image acquired in layer 2 in a well-developed multilayer). Maximum intensity projection of a confocal stack. Fixed cells. The mostly yellow color demonstrates the colocalization of laminin and fibronectin. (B, C) ECM (laminin (B) and collagen (C)) localizes between the cells of layers 1 and 2 in a multilayered sample (these images are confocal slices acquired at the interface between layer 1 and layer 2 in a well-developed multilayer). Note the colocalization of ECM proteins with the Focal Adhesions (FAs) (labeled by paxillin), characteristic of the 3D organization of the cells. (D, E) The FAs structure is very different for layer 1 interacting with glass (D) compared with the subsequent layers (E). For cells adhering on glass, one recovers the classical well-defined FAs at the extremities of the stress fibers (D). In the case of multilayers, cell–cell adhesion is mediated by the cell-secreted ECM. The fibrillar structure of the FAs that colocalizes with actin within the multilayered assembly is then typical of a tridimensional organization of the cells (E) (confocal slice at the basal side of layer 1 (D) and in the multilayer, 10 µm above (E) Fixed cells). (F) Superimposed positions of the cells in a stationary defect during a 10 h sequence (starting at t2L—10 h and ending at t2L). For this analysis, 10% of the cells were Actin-mCherry so that they could be tracked independently (see Movie S1). All images of the movie have been colored according to time and summed up. The cells move actively along the orientation lines of the defect explaining how the defect can be stationary and the cells motile.

References

    1. Ribatti D. 2017. A revisited concept: contact inhibition of growth. From cell biology to malignancy. Exp Cell Res. 359(1):17–19. - PubMed
    1. McClatchey AI, Yap AS. 2012. Contact inhibition (of proliferation) redux. Curr Opin Cell Biol. 24(5):685–694. - PubMed
    1. Irvine KD, Shraiman BI. 2017. Mechanical control of growth: ideas, facts and challenges. Development. 144(23):4238–4248. - PMC - PubMed
    1. Gumbiner BM, Kim N-G. 2014. The hippo-YAP signaling pathway and contact inhibition of growth. J Cell Sci. 127(4):709–717. - PMC - PubMed
    1. Puliafito A, et al. . 2012. Collective and single cell behavior in epithelial contact inhibition. Proc Natl Acad Sci. 109(3):739–744. - PMC - PubMed