. 2023 Jun 9;51(10):4831-4844.
doi: 10.1093/nar/gkad184.

The molecular grammar of protein disorder guiding genome-binding locations

Affiliations

The molecular grammar of protein disorder guiding genome-binding locations

Felix Jonas et al. Nucleic Acids Res. .

Abstract

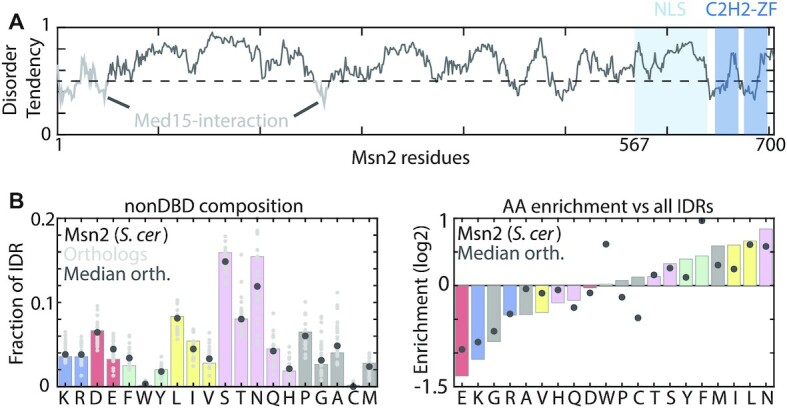
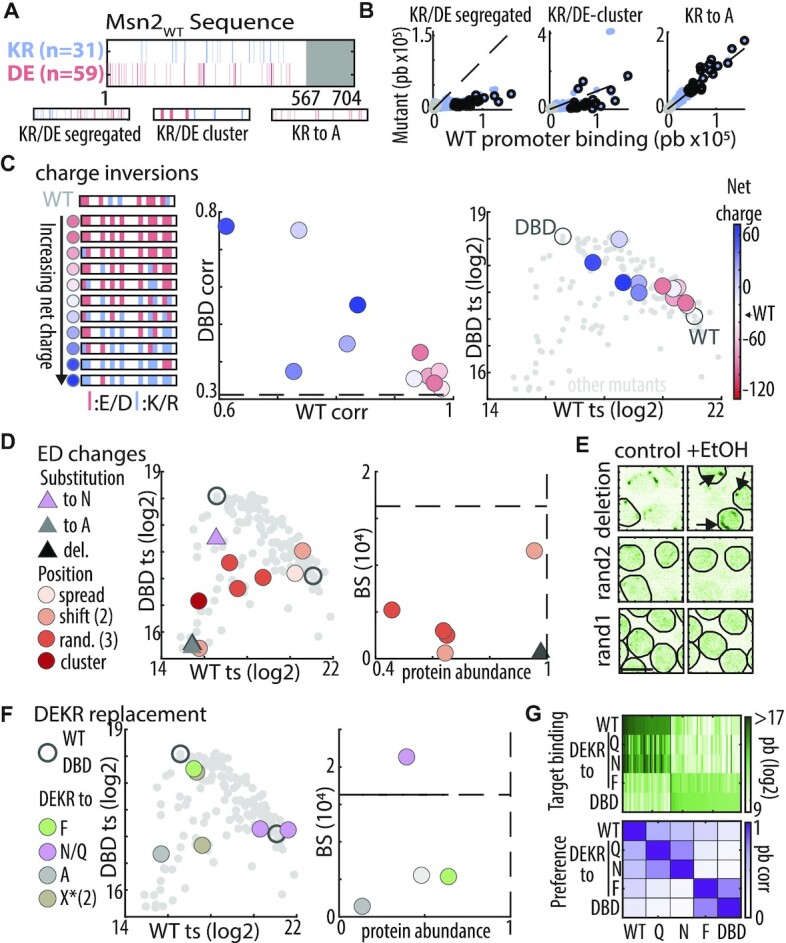
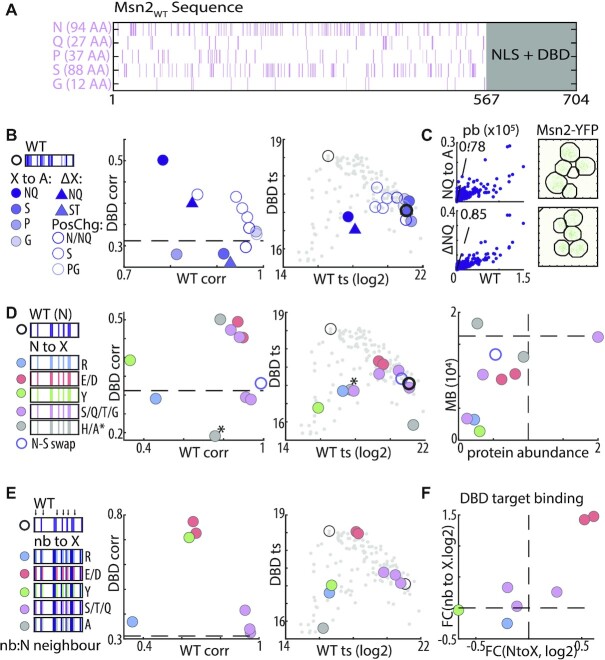
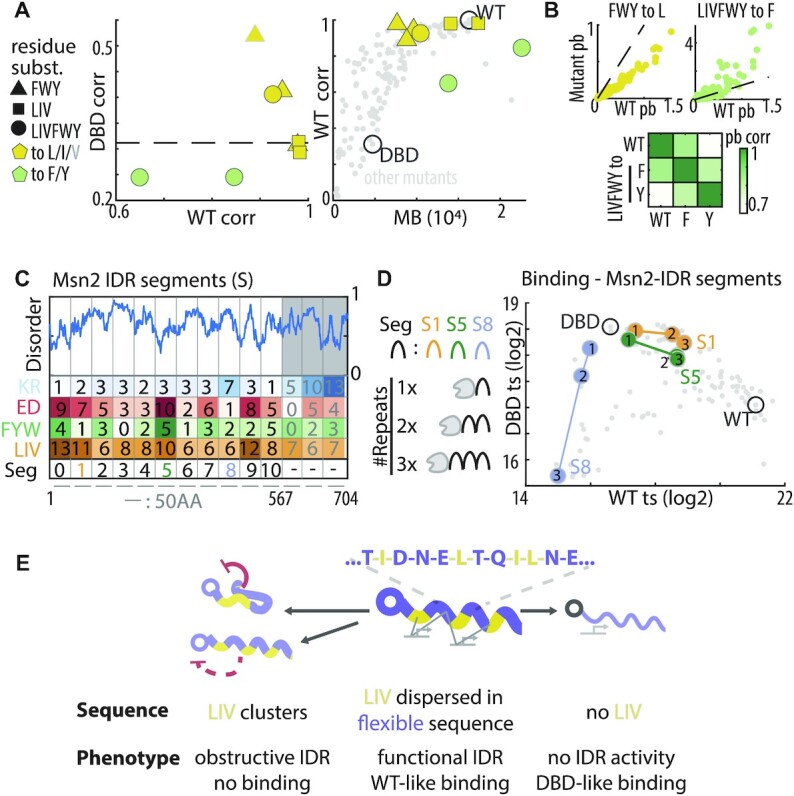
Intrinsically disordered regions (IDRs) direct transcription factors (TFs) towards selected genomic occurrences of their binding motif, as exemplified by budding yeast's Msn2. However, the sequence basis of IDR-directed TF binding selectivity remains unknown. To reveal this sequence grammar, we analyze the genomic localizations of >100 designed IDR mutants, each carrying up to 122 mutations within this 567-AA region. Our data points at multivalent interactions, carried by hydrophobic-mostly aliphatic-residues dispersed within a disordered environment and independent of linear sequence motifs, as the key determinants of Msn2 genomic localization. The implications of our results for the mechanistic basis of IDR-based TF binding preferences are discussed.


Figures

Figure 1.
Figure 1.
Msn2 IDR enrichment signature is conserved across yeast species. (A) The Msn2 protein: Shown is the predicted disorder tendency along the Msn2 sequence. The DBD and NLS (64) are indicated (light and dark blue). Mutations were restricted to the 567 AA N-terminus (white). (B) The sequence composition of Msn2: Shown is the frequency of each amino acid within the Msn2 nonDBD (left), and their enrichment relative to other IDRs in the budding yeast proteome (right). Enrichment was examined for Msn2 of S. cerevisiae and for 25 homologs from 17 yeast species.
Figure 2.
Figure 2.
IDR sequence mutants span a range of binding profiles. (A) Msn2 mutant types- a scheme: Engineered mutations included (1) removing same-identity residues by substituting with other residues or by deletion, and (2) changing locations of same-identity residues (‘shift’, ‘cluster’ or ‘random’). Red lines indicate mutated residues. (B) Binding phenotypes of Msn2 mutants: The 509 promoters bound strongly by at least one of the Msn2 mutants were selected. Heatmap shows the relative binding of each mutant to each promoter, ordered by clustering. Note the three general patterns: Msn2WT-like (cluster 1), Msn2DBD-like (cluster 2), and loss of binding (cluster 3). The two bottom rows indicate the identity of the Msn2WT (WT) and Msn2DBD (DBD) unique target promoters (Supplementary Figure S1B, and materials and methods). Bar graphs on the right show the correlation of binding preferences of each mutant with the Msn2WT and Msn2DBD, and its overall binding to the Msn2 motif (MB). (C−G) Msn2 mutants span a range of binding correlations and binding strengths: Shown in (C) are the similarity (correlation) in promoter binding preferences between mutants and Msn2WT or Msn2DBD, as a function of binding signal at Msn2WT or Msn2DBD unique target promoters, as indicated (target signal, ts). Binding signals at those target sets are compared in (D−G), color-coded by mutant-Msn2WT correlation (D), mutant-Msn2DBD correlation (E), mutant protein abundance (F), and mutants subcellular localization (G). Examples for differential localization is shown in G, with scale bar corresponding to 5 μm (see Supplementary Figure S2D for full frames). In all plots, mutants with missing data are indicated as small grey dots. In (D) dot size indicates total motif binding (MB). Of note, target signal is highly reproducible with 80% of mutants showing <25% in WT ts and <13% variance in DBD ts between biological repeats (i.e. Supplementary Figure S2A-C).
Figure 3.
Figure 3.
Charged residues do not explain the IDR-based DNA binding: (A) Distribution of basic and acidic residues within Msn2 nonDBD: shown are the locations of basic (R or K, blue) and acidic (D or E, red) residues within Msn2 IDR (top) and in three indicated mutants (bottom). (B) IDR function is sensitive to clustering of charged residues but insensitive to removal of positive residues: the plots compare promoter preferences. Each dot is a promoter, located according to binding signal of Msn2 and the indicated mutant. Black and grey dots correspond to Msn2WT and Msn2DBD unique promoters, respectively (see Supplementary Figure S3 for KR to E/D mutants). (C) Increasing IDR charge reduces binding at Msn2WT promoters: acidic and basic residues at different ratios were distributed randomly within the 90-charged locations of the tested IDR (left). Shown are similarity (correlation) of promoter preferences between mutants and Msn2WT or Msn2DBD (middle), and binding signal at Msn2WT and Msn2DBD unique targets (right). Color-coding indicates net charge (Msn2WT: -28). For comparison, dashed black line indicates the Msn2WT–Msn2DBD correlation (promoter preference plot), or small grey dots indicate the position of all mutants and empty circles Msn2WT and Msn2DBD position (target signal plot). (DE) Acidic residues may contribute to IDR-based binding: shown in (D) are the binding signals at Msn2DBD versus Msn2WT promoters (middle) and the absolute motif binding vs. protein abundance relative to Msn2WT (right) for the indicated mutants. Dashed black lines indicate the relative protein abundance (= 1) and motif binding of Msn2WT. Nuclear localization before and after EtOH addition is shown in (E). Black arrows indicate cytoplasmic Msn2 clusters (scale bar corresponds to 5 μm). (FG) Asparagine and glutamine can compensate for acidic residues: shown in (F) are binding signals at Msn2DBD vs. Msn2WT promoters (left) and the absolute motif binding versus relative protein abundance relative to Msn2WT (right) for the indicated mutants. The consequences of charge→polar replacements are shown also in (G), displaying promoter binding across all target promoters (top, Msn2WT promoters on the left, Msn2DBD promoters on the right) and correlation of promoter preferences between the indicated mutants (bottom). Note that DEKR replacement by either Q or N maintains binding to WT targets and avoids DBD targets, but changes the ordering among those targets in a similar way.
Figure 4.
Figure 4.
Asparagine provides the disordered environment required for DNA binding. (A) Distribution of disorder promoting residues within Msn2 nonDBD: shown are the locations and number of the indicated residues within Msn2 IDR. (BC) Replacing N + Q residues with alanine strongly reduces binding strength and nuclear localization but not binding preferences: binding phenotypes of the indicated mutants are summarized as in Figure 3C (B). Also shown is the similarity of promoter binding preferences between Msn2WT and the N + Q→A and NQ deletion mutant (scatter plots in C, left) and their effect on nuclear localization after EtOH exposure (C, right). (D) Disorder promoting residues retrieve N contribution to IDR-based binding: binding phenotypes of the indicated mutants are summarized as in Figure 3C above (D). Also shown is the absolute motif binding vs. relative protein abundance (right) of the same mutants. Dashed black line indicates Msn2WT to Msn2DBD correlation (left) or Msn2WT abundance and motif binding (right). The NQ to A mutant is indicated with *. (EF) Acidic residues bias binding towards Msn2DBD promoters: binding phenotypes of the indicated mutants are summarized as in Figure 3C above (E). Change in binding to Msn2DBD targets, measured as fold-change (FC), is also compared between control substitution of N-neighboring and the respective N-to-X substitution (F).
Figure 5.
Figure 5.
Dispersion of aliphatic and aromatic residues is required for IDR-based binding. (A) Distribution of hydrophobic residues within the Msn2 nonDBD: shown are the locations of the indicated hydrophobic residues within the Msn2 IDR. (BC) Clustering of hydrophobic residues perturbs genomic binding and nuclear localization. Binding phenotypes of the indicated mutants are summarized as in Figures 3C above (Color indicates target residue and shape mutation type). Also shown is the localization of LIV cluster mutants after EtOH exposure (C, arrows indicate possible aggregates, scale bar corresponds to 5 μm). Note that binding preferences remain invariant to random or shifted positioning of the hydrophobic residues, while clustering leads to complete loss of binding and nuclear localization. (D) Deletion of hydrophobic residues or non-similar replacement biases binding towards Msn2DBD promoters: binding phenotypes of the indicated mutants are summarized as in Figures 3C above (Shape indicates target residue and color indicates mutation type, see also Supplementary Figure S5B, for target signal and Supplementary Figure S5C for alanine replacements). (E) Genomic preferences depend on the additive contribution of hydrophobic residues located throughout the IDR. Shown are the effects of sequential deletion of hydrophobic residues from either end of the IDR on promoter preference similarity with Msn2WT (left), Msn2DBD (middle) and absolute motif binding (right). The effects of sequential IDR truncation are also shown for comparison (Data from (22)). Note that removing only the hydrophobic residues has a similar effect to deleting the corresponding IDR region, and that the effect only depends on the number of the removed residues not on their position, i.e. N- or C-terminal.
Figure 6.
Figure 6.
IDR based binding preferences remain invariant to the replacement of aromatic by aliphatic residues: (AB) Aliphatic but not aromatic residues are critical for promoter preferences. Shown in (A) are the phenotypes of the indicated mutants, summarized as in Figure 3C above (left). Also shown is a comparison between the promoter preference similarity of each mutant to Msn2WT as a function of its motif binding strengths (right, each dot is a mutant with indicated mutants highlighted). Grey outline indicates the valine replacement which did not provide full rescue. Also shown are the scatter plots comparing promoter binding by the two indicated exemplary mutants and Msn2WT (top, line indicates equal 1:1 binding) and a heatmap showing the respective pairwise correlations (bottom). (C, D) Predicting the phenotype of tandem Msn2 segments: all 50-AA Msn2 IDR segments include multiple aliphatic residues and most are negatively charged (C, left). In total, 28 tandem repeat constructs of different segments were created (C, right) and profiled. The binding phenotype of tandem repeats for three representative segments is shown, one of which only contains one aromatic residue (S1) and one is positively charged (S8) (D, see Supplementary Figure S6 for all segment tandem repeats). (E) Model for IDR-based binding: hydrophobic and in particular aliphatic residues provide the specific interactions mediating IDR-based TF targeting. This role requires dispersion of these residues within a disordered environment, in the absence of which the same residues abolish all binding at both Msn2WT and Msn2DBD promoters, either via direct DBD inhibition or by overruling the NLS and preventing its nuclear localization.

References

    1. Liu J., Perumal N.B., Oldfield C.J., Su E.W., Uversky V.N., Dunker A.K.. Intrinsic disorder in transcription factors. Biochemistry. 2006; 45:6873–6888. - PMC - PubMed
    1. Wang C., Uversky V.N., Kurgan L.. Disordered nucleiome: abundance of intrinsic disorder in the DNA- and RNA-binding proteins in 1121 species from Eukaryota, Bacteria and Archaea. Proteomics. 2016; 16:1486–1498. - PubMed
    1. Minezaki Y., Homma K., Kinjo A.R., Nishikawa K.. Human transcription factors contain a high fraction of intrinsically disordered regions essential for transcriptional regulation. J. Mol. Biol. 2006; 359:1137–1149. - PubMed
    1. Ward J.J., Sodhi J.S., McGuffin L.J., Buxton B.F., Jones D.T.. Prediction and functional analysis of native disorder in proteins from the three kingdoms of life. J. Mol. Biol. 2004; 337:635–645. - PubMed
    1. Brodsky S., Jana T., Barkai N.. Order through disorder: the role of intrinsically disordered regions in transcription factor binding specificity. Curr. Opin. Struct. Biol. 2021; 71:110–115. - PubMed

Publication types

MeSH terms

Substances