. 2023 May 22;51(9):e50.
doi: 10.1093/nar/gkad198.

A new method to synthesize multiple gRNA libraries and functional mapping of mammalian H3K4me3 regions

Affiliations

A new method to synthesize multiple gRNA libraries and functional mapping of mammalian H3K4me3 regions

Chen Pan et al. Nucleic Acids Res. .

Abstract

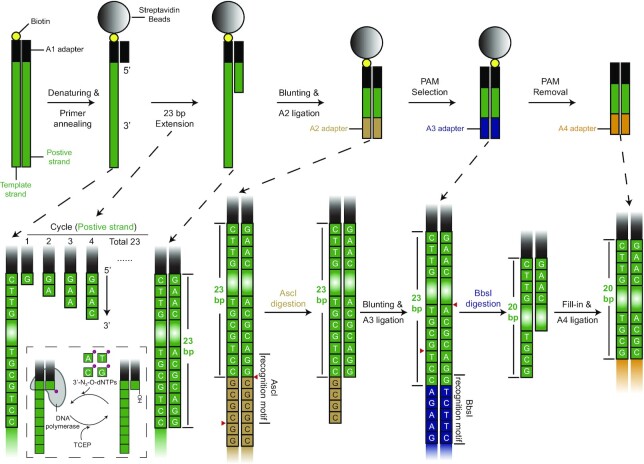
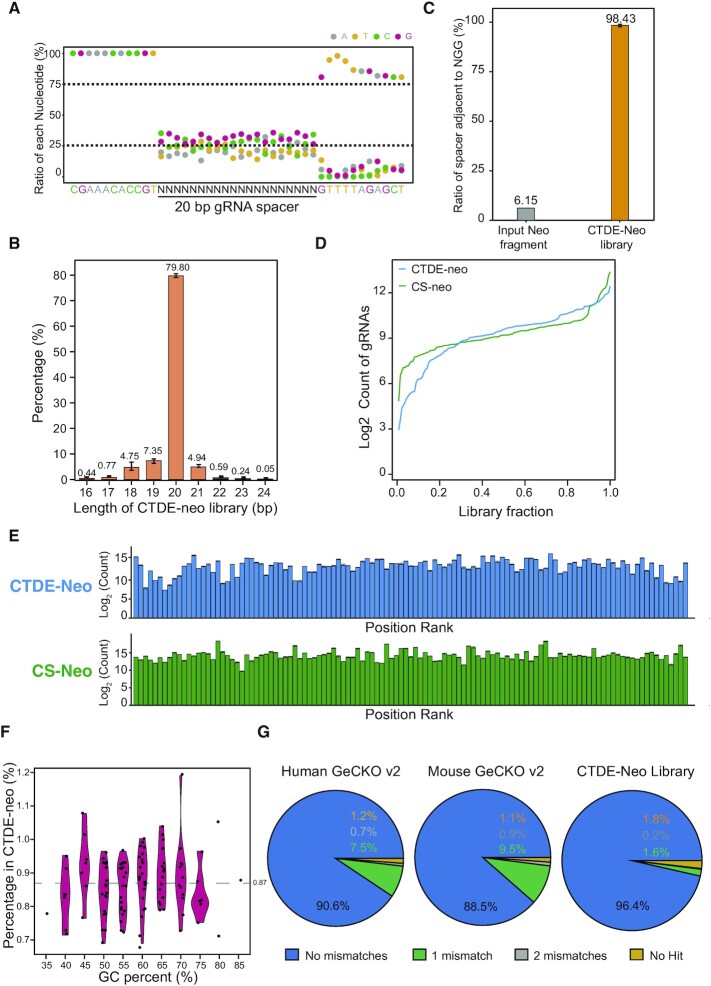
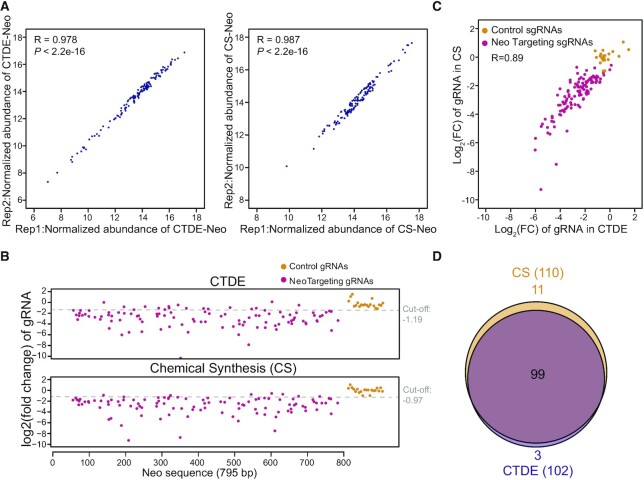
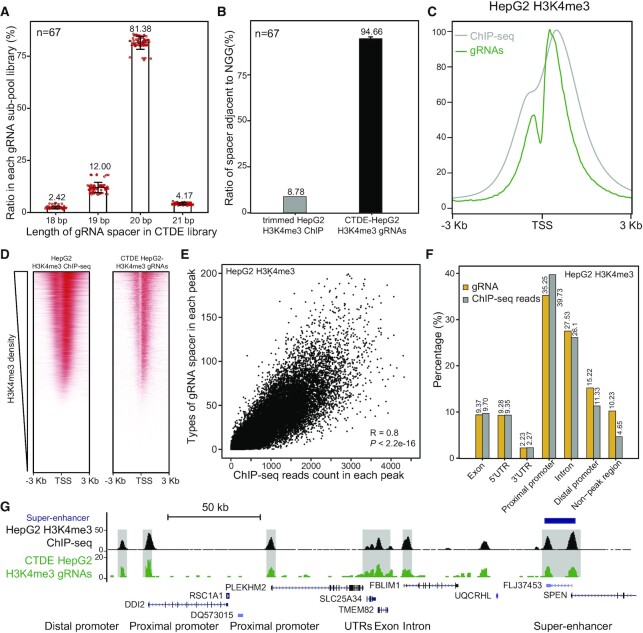
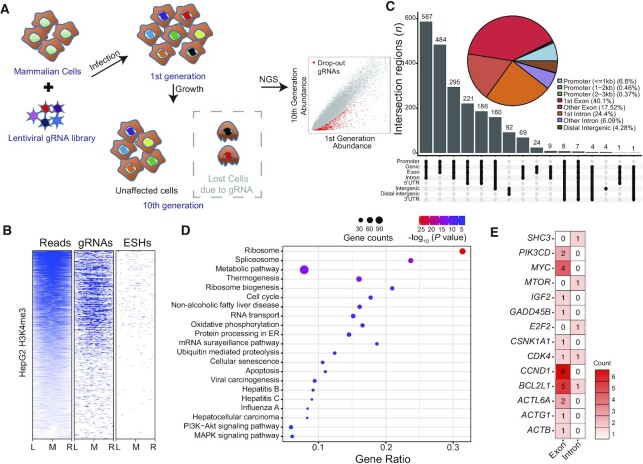
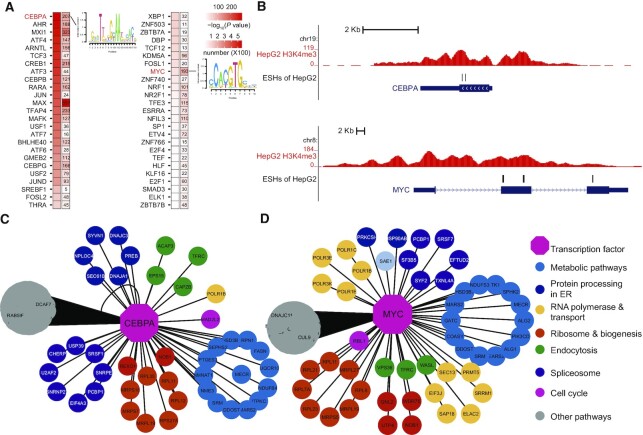
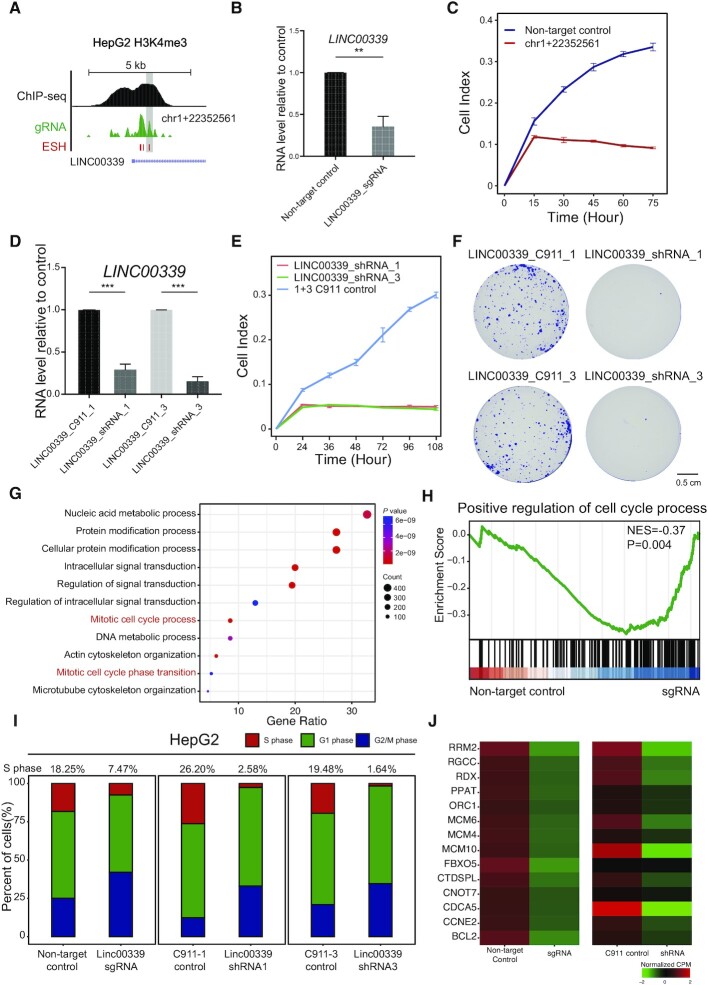
Genetic screening based on the clustered regularly interspaced palindromic repeat (CRISPR) system has been indicated to be a powerful tool for identifying regulatory genes or cis-elements. However, when applying CRISPR screens to pinpoint functional elements at particular loci, a large number of guide RNA (gRNA) spacers may be required to achieve saturated coverage. Here, we present a controlled template-dependent elongation (CTDE) method relying on reversible terminators to synthesize gRNA libraries with genomic regions of interest. By applying this approach to H3K4me3 chromatin immunoprecipitation (ChIP)-derived DNA of mammalian cells, mega-sized gRNA libraries were synthesized in a tissue-specific manner, with which we conducted screening experiments to annotate essential sites for cell proliferation. Additionally, we confirmed that an essential site within the intron of LINC00339 regulates its own mRNA and that LINC00339 is a novel regulator of the cell cycle that maintains HepG2 proliferation. The CTDE method has the potential to be automated with high efficiency at low cost, and will be widely used to identify functional elements in mammalian genomes.


Figures

Figure 1.
Figure 1.
Design of length control and PAM selection in CTDE procedures. Briefly, input DNA was polished and ligated to Biotin-A1 adapter after sonication shearing. After being captured on T1 beads, DNA was denatured and annealed with a primer for extension. After 23 nt extension by reversible terminator reactions, the 5′ overhang of DNA was removed by mung bean nuclease. The gRNAs terminated with NGG triplets were enriched and NGG triplets were removed before gRNAs were cloned into the expressing vector.
Figure 2.
Figure 2.
CTDE efficiently synthesizes a fixed length of the gRNA spacer with high fidelity. (A) Mass sequencing of a representative CTDE-Neo gRNA library. The x-axis is the base position in reads from the fastq file and the y-axis is the percentage of each kind of nucleotide. (B) The length distribution of the gRNA in the CTDE-Neo gRNA library (795 bp Neo). Spacers of 16–24 bp were collected. (C) The ratio of spacer sequences adjacent to the NGG PAM. For the input Neo fragment, this value is calculated from Neo fragment library sequencing data (both position 22 and 23 are G in the fastq file). (D) Cumulative distribution of the log2 count of gRNAs in the CTDE-Neo (blue) and CS-Neo (green) library. (E) The abundance of each gRNA in the CTDE (blue)/CS (green) library. The x-axis is ranked by the position of spacers at the Neo reference (direction: N- to C-terminal). (F) Violin plot shows the abundance of gRNAs with different GC content in the CTDE-Neo library. The indicated line is in theory the median value 0.87 (equal to 1/115). (G) Evaluation of the fidelity of gRNA libraries for GeCKO gRNA libraries (microarray-based oligo synthesis) and CTDE. Error types are according to the alignment reports of spacer sequences in each library. Data are representative of three (A, D, E, F) independent experiments; n = 3 (B, C) independent biological replicates. Data are presented as the mean ± SD.
Figure 3.
Figure 3.
The CTDE gRNA library is compatible with the screen experiment. (A) Spearman correlation analysis between two technical replicate experiments for the CTDE-Neo (left) and CS-Neo (right) gRNA library. (B) Log2 fold change of each gRNA in the CTDE- (up) and CS-Neo (down) gRNA library screen. Yellow dots are non-target control gRNAs; red dots are sgRNAs targeting the Neo sequence. These gRNAs are arranged by the position of the NGG PAM sites. (C) Correlation of log2 fold change of gRNAs between CTDE and CS-Neo screen experiments. Spearman correlation coefficient was calculated (R = 0.89). Yellow dots represent non-targeting control gRNA and red dots are gRNA targeting the Neo gene. (D) The Venn plot shows the overlap of dropout gRNAs from the CS and CTDE gRNA library.
Figure 4.
Figure 4.
CTDE can construct tissue-specific gRNA libraries. (A) The length distribution of gRNA spacers in 67 HepG2 H3K4me3 gRNA sublibraries. Spacers of 18–21 bp were collected. (B) The ratio of spacer sequence adjacent to the NGG PAM in 67 HepG2 H3K4me3 gRNA libraries. We trimmed the read from HepG2 H3K4me3 ChIP-seq fastq to 23 bp and the count ratio of sequences ending with GG at position 22 and 23. (C) The distribution of HepG2 H3K4me3 ChIP-seq (gray) and gRNA (green) signals from −3 kb to +3 kb surrounding the center of the TSS in HepG2 cells. (D) Heatmap of HepG2 H3K4me3 ChIP-seq (left) and gRNA (right) signals, ranked by H3K4me3 ChIP-seq signals in HepG2 cells. All signals are displayed from −3 kb to +3 kb surrounding the center of the TSS. (E) Correlation analysis between ChIP-seq read count and gRNA types in each mESC H3K4me3 peak. (F) The percentages of HepG2 H3K4me3 gRNA (yellow) and ChIP-seq reads (gray) in the indicated genomic elements. (G) Genome Browser tracks of H3K4me3 ChIP-seq signals and gRNA in HepG2 cells at selected genomic locations.
Figure 5.
Figure 5.
Annotation of the essential sites inside H3K4me3 regions supporting HepG2 cell proliferation. (A) Schematic view of the functional negative genetic screen. Briefly, the lentivirus library infected cells with a low MOI; continuous culturing of virus-infected cells for 10 generations; the gRNAs dropped out in the final library were picked for downstream analysis. (B) The heatmaps of ChIP-seq signals (left), gRNAs (middle) and ESHs (right) in H3K4me3 regions of HepG2 cells, ranked by H3K4me3 ChIP-seq signals in HepG2 cells. All signals are displayed in normalized length of the H3K4me3 peak. L, left boundary; M, middle (the center of H3K4me3 peak); R, right boundary (blue, enriched; white, not enriched). (C) The distribution of ESHs from HepG2 cells in the genome; the pie chart indicates the distribution of ESHs in genomic features; the bar plot indicates the distribution of ESHs in overlapping annotation features in the genome. (D) The KEGG pathway enrichment analysis of all genes that ESHs are inside or nearest to in HepG2 cells. (E) The ESHs hitting genes that participate in hepatocellular carcinomas.
Figure 6.
Figure 6.
CEBPA and MYC acting upstream of the ESHs in HepG2 cells. (A) For the left panel: P-values (as determined by hyper geometric test) of each TF calculated by PWMEnrich for all ESHs. For the right panel: the number represents counts of TF-binding sites overlapping with the ESHs (TF ChIP-seq datasets are from ENCODE and are provided in Supplementary Table S9). The sequence logos are two TFs that have multiple ESHs inside an exon in (B). (B) Genomic track of H3K4me3 signal and ESHs at the CEBPA and MYC gene loci in HepG2 cells. (C and D) Connectivity network of downstream genes converged by two TFs. The connectivity was built using interactions (gray lines) between the genes inside or nearest to ESHs and TFs that regulate relative regions. Colored nodes denote KEGG pathways from Figure 5D; colors for each pathway are indicated at the right side.
Figure 7
Figure 7
LINC00339 is a novel regulator of the cell cycle in HepG2 cells. (A) Genomic track of the H3K4me3 ChIP-seq signal (black), gRNAs (green) and ESHs (red) at the LINC00339 locus. The genomic region with validated gRNA for ESH is shaded gray. (B) qPCR quantified LINC00339 RNA after gRNA (chr1+22352561) disruption. (C) Proliferation assay of HepG2 cells treated with gRNA (chr1+22352561, red) and non-target control (blue). After a 14 day culture following puromycin selection, cells were stained with crystal violet. (D) qPCR quantified the LINC00339 mRNA level after shRNA knockdown. (E) Proliferation assay of HepG2 cells treated with LINC00339_shRNA1 (red), LINC00339_shRNA3 (green) and C911 control shRNA (blue). Cell index data collected by the RTCA (Real Time Cell Analysis) machine are plotted. (F) Colony formation assay of HepG2 cells treated with LINC00339_shRNA1,3 and their C911 control shRNA. After 14 days of culture, cells were stained with crystal violet. (G) GO terms of down-regulated genes after gRNA targeting ESH in HepG2 cells. (H) Enrichment plot of the positive regulation of the cell cycle phase transition process for comparison between non-target control and gRNA targeting ESH in HepG2 cells. (I) Cell cycle analysis of gRNA (chr1+22352561), LINC00339_shRNA1,3 and their control gRNA/shRNA-treated HepG2 cells with flow cytometry. Cells were stained with propidium iodide after membrane penetration. (J) Heatmap of down-regulated genes in the G1/S transition of the mitotic cell cycle process after gRNA/shRNA targeting of LINC00339. Data are representative of three (F, I) independent experiments; n = 3 (B, C, D, E) independent biological replicates. Data are presented as the mean ± SD. Statistical analyses were performed using a two-tailed Student's t-test. *P <0.05, **P <0.01, ***P <0.001.

Similar articles

References

    1. Cong L., Ran F.A., Cox D., Lin S., Barretto R., Habib N., Hsu P.D., Wu X., Jiang W., Marraffini L.A.et al. .. Multiplex genome engineering using CRISPR/Cas systems. Science. 2013; 339:819–823. - PMC - PubMed
    1. Replogle J.M., Saunders R.A., Pogson A.N., Hussmann J.A., Lenail A., Guna A., Mascibroda L., Wagner E.J., Adelman K., Lithwick-Yanai G.et al. .. Mapping information-rich genotype–phenotype landscapes with genome-scale perturb-seq. Cell. 2022; 185:2559–2575. - PMC - PubMed
    1. Hussmann J.A., Ling J., Ravisankar P., Yan J., Cirincione A., Xu A., Simpson D., Yang D., Bothmer A., Cotta-Ramusino C.et al. .. Mapping the genetic landscape of DNA double-strand break repair. Cell. 2021; 184:5653–5669. - PMC - PubMed
    1. Koblan L.W., Arbab M., Shen M.W., Hussmann J.A., Anzalone A.V., Doman J.L., Newby G.A., Yang D., Mok B., Replogle J.M.et al. .. Efficient C·G-to-G·C base editors developed using CRISPRi screens, target-library analysis, and machine learning. Nat. Biotechnol. 2021; 39:1414–1425. - PMC - PubMed
    1. Oh S., Shao J., Mitra J., Xiong F., D’Antonio M., Wang R., Garcia-Bassets I., Ma Q., Zhu X., Lee J.H.et al. .. Enhancer release and retargeting activates disease-susceptibility genes. Nature. 2021; 595:735–740. - PMC - PubMed

Publication types