. 2023 Jun 13;29(12):2324-2335.
doi: 10.1158/1078-0432.CCR-22-1305.

Expression and Therapeutic Targeting of TROP-2 in Treatment-Resistant Prostate Cancer

Affiliations

Expression and Therapeutic Targeting of TROP-2 in Treatment-Resistant Prostate Cancer

Jamie M Sperger et al. Clin Cancer Res. .

Abstract

Purpose: Men with metastatic castration-resistant prostate cancer (mCRPC) frequently develop resistance to androgen receptor signaling inhibitor (ARSI) treatment; therefore, new therapies are needed. Trophoblastic cell-surface antigen (TROP-2) is a transmembrane protein identified in prostate cancer and overexpressed in multiple malignancies. TROP-2 is a therapeutic target for antibody-drug conjugates (ADC).

Experimental design: TROP-2 gene (TACSTD2) expression and markers of treatment resistance from prostate biopsies were analyzed using data from four previously curated cohorts of mCRPC (n = 634) and the PROMOTE study (dbGaP accession phs001141.v1.p1, n = 88). EPCAM or TROP-2-positive circulating tumor cells (CTC) were captured from peripheral blood for comparison of protein (n = 15) and gene expression signatures of treatment resistance (n = 40). We assessed the efficacy of TROP-2-targeting agents in a mouse xenograft model generated from prostate cancer cell lines.

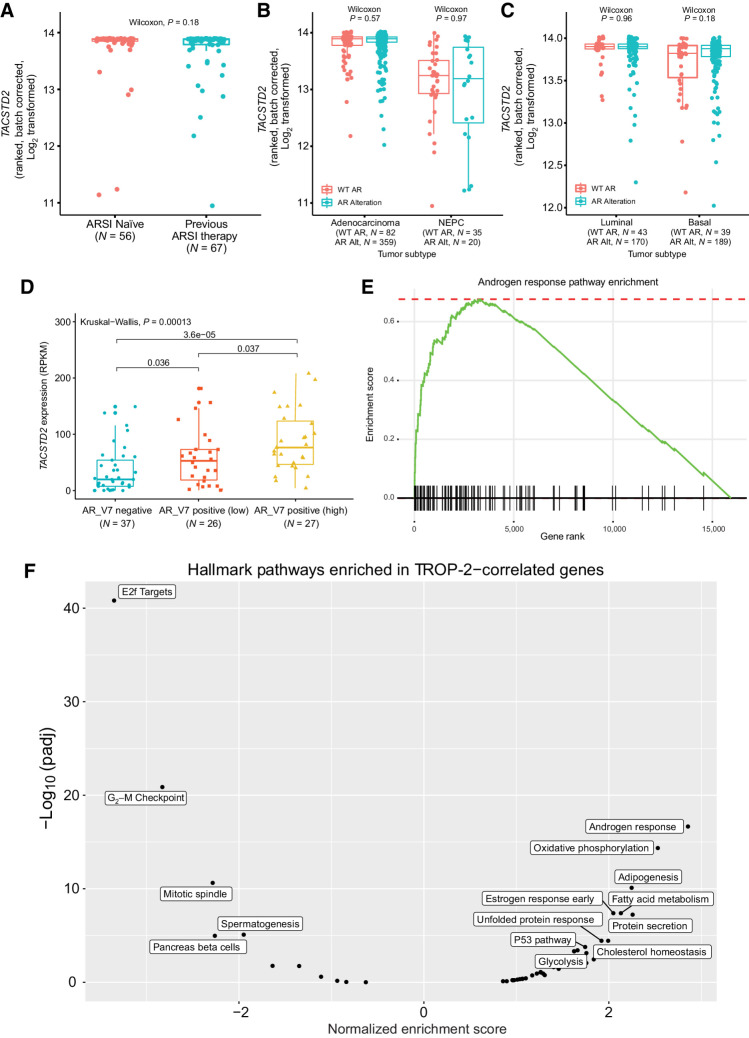
Results: We demonstrated that TACSTD2 is expressed in mCRPC from luminal and basal tumors but at lower levels in patients with neuroendocrine prostate cancer. Patients previously treated with ARSI showed no significant difference in TACSTD2 expression, whereas patients with detectable AR-V7 expression showed increased expression. We observed that TROP-2 can serve as a cell surface target for isolating CTCs, which may serve as a predictive biomarker for ADCs. We also demonstrated that prostate cancer cell line xenografts can be targeted specifically by labeled anti-TROP-2 agents in vivo.

Conclusions: These results support further studies on TROP-2 as a therapeutic and diagnostic target for mCRPC.


Figures

Figure 1. TROP-2 expression in metastatic prostate cancer. TACSTD2 expression stratified by (A) adenocarcinoma versus NEPC, (B) luminal versus basal, and (C) site of biopsy from patients with mCRPC (n = 634; normalization and batch correction of RNA-seq data described in Aggarwal et al.; ref. 29). All statistical tests performed in A–C are Wilcoxon rank-sum tests. (D) Survival analysis of TACSTD2 high, middle, and low samples from patients with prostate adenocarcinoma. The Kaplan–Meier curve shows tertiles for visualization purposes only. Statistical testing was performed using a Cox proportional hazard model on continuous TACSTD2 expression. For the Cox model, TACSTD2 expression was scaled by dividing each value by the standard deviation of TACSTD2 expression, thus a unit change of 1 represents a single standard deviation in TACSTD2 expression (Cox proportional hazard model on continuous TACSTD2 expression, P = 0.0118; HR, 0.8218; 95% CI, 0.7053–0.9574).
Figure 1.
TROP-2 expression in metastatic prostate cancer. TACSTD2 expression stratified by (A) adenocarcinoma versus NEPC, (B) luminal versus basal, and (C) site of biopsy from patients with mCRPC (n = 634; normalization and batch correction of RNA-seq data described in Aggarwal et al.; ref. 29). All statistical tests performed in A–C are Wilcoxon rank-sum tests. (D) Survival analysis of TACSTD2 high, middle, and low samples from patients with prostate adenocarcinoma. The Kaplan–Meier curve shows tertiles for visualization purposes only. Statistical testing was performed using a Cox proportional hazard model on continuous TACSTD2 expression. For the Cox model, TACSTD2 expression was scaled by dividing each value by the standard deviation of TACSTD2 expression, thus a unit change of 1 represents a single standard deviation in TACSTD2 expression (Cox proportional hazard model on continuous TACSTD2 expression, P = 0.0118; HR, 0.8218; 95% CI, 0.7053–0.9574).
Figure 2. Effect of ARSI Treatment and AR Alterations on TROP-2 Expression. A, TACSTD2 expression in patients from the 4 mCRPC studies stratified by ARSI naïve or previous ARSI therapy. B, TACSTD2 expression in tumor biopsies from patients with and without AR alterations (defined as AR mutation or AR copy number amplification) from the 4 mCRPC cohorts stratified by adenocarcinoma and NEPC. C, TACSTD2 expression in tumor biopsies with or without AR alteration as in (B), but stratified by luminal and basal mCRPC. Statistical tests performed in A–C are Wilcoxon rank sum tests. D, TACSTD2 expression in baseline (N = 92) samples from the PROMOTE study divided into tertiles by expression level of AR-V7 (Negative n = 37, low n = 26, high n = 27). E, Enrichment plot of the Androgen Response Pathway from the GSEA analysis performed in (F). F, GSEA analysis of hallmark pathways enriched in TACSTD2-correlated genes. A positive normalized enrichment score denotes positive correlation with TACSTD2 expression.
Figure 2.
Effect of ARSI Treatment and AR Alterations on TROP-2 Expression. A,TACSTD2 expression in patients from the 4 mCRPC studies stratified by ARSI naïve or previous ARSI therapy. B,TACSTD2 expression in tumor biopsies from patients with and without AR alterations (defined as AR mutation or AR copy number amplification) from the 4 mCRPC cohorts stratified by adenocarcinoma and NEPC. C,TACSTD2 expression in tumor biopsies with or without AR alteration as in (B), but stratified by luminal and basal mCRPC. Statistical tests performed in A–C are Wilcoxon rank sum tests. D,TACSTD2 expression in baseline (N = 92) samples from the PROMOTE study divided into tertiles by expression level of AR-V7 (Negative n = 37, low n = 26, high n = 27). E, Enrichment plot of the Androgen Response Pathway from the GSEA analysis performed in (F). F, GSEA analysis of hallmark pathways enriched in TACSTD2-correlated genes. A positive normalized enrichment score denotes positive correlation with TACSTD2 expression.
Figure 3. Analysis of TROP-2 Captured CTCs. CTCs were captured from patients with metastatic prostate cancer using the indicated antibody. Images of representative CTCs are shown for CTCs captured using antibodies to (A) EPCAM and (B) TROP-2. CTCs are stained with Hoechst (Blue), AR (Green), CD45/CD11B/CD14 (Exclusion, Red) and Pan-Cytokeratin (CK, White; scale bars, 5 μm). (C) Enumeration of CTCs from 15 patients with metastatic prostate cancer captured by the indicated antibody is shown. (D) Gene expression analysis of EPCAM-captured and TROP-2-captured (T) CTCs from 40 patients with prostate cancer.
Figure 3.
Analysis of TROP-2 Captured CTCs. CTCs were captured from patients with metastatic prostate cancer using the indicated antibody. Images of representative CTCs are shown for CTCs captured using antibodies to (A) EPCAM and (B) TROP-2. CTCs are stained with Hoechst (Blue), AR (Green), CD45/CD11B/CD14 (Exclusion, Red) and Pan-Cytokeratin (CK, White; scale bars, 5 μm). (C) Enumeration of CTCs from 15 patients with metastatic prostate cancer captured by the indicated antibody is shown. (D) Gene expression analysis of EPCAM-captured and TROP-2-captured (T) CTCs from 40 patients with prostate cancer.
Figure 4. CTCs are heterogeneous with respect to EPCAM and TROP-2 expression in a patient with NEPC. (A) CTCs were captured with EPCAM and TROP-2 antibodies in parallel and were identified positive for Hoechst (H) and pan-cytokeratin (CK) and negative for exclusion marker cocktail (Ex). Cells were also stained for EPCAM (EpC) and TROP-2 (Tr2); scale bar, 5 μm. (B) The mean fluorescent intensities (MFI) of TROP-2 versus EPCAM were graphed for each CTC identified after capture with antibodies to either TROP-2 (red) or EPCAM (blue) and plotted as individual cells. (C) Gene expression analysis of EPCAM captured and TROP-2–captured populations of cells shows expression of neuroendocrine genes and genes downstream of AR.
Figure 4.
CTCs are heterogeneous with respect to EPCAM and TROP-2 expression in a patient with NEPC. (A) CTCs were captured with EPCAM and TROP-2 antibodies in parallel and were identified positive for Hoechst (H) and pan-cytokeratin (CK) and negative for exclusion marker cocktail (Ex). Cells were also stained for EPCAM (EpC) and TROP-2 (Tr2); scale bar, 5 μm. (B) The mean fluorescent intensities (MFI) of TROP-2 versus EPCAM were graphed for each CTC identified after capture with antibodies to either TROP-2 (red) or EPCAM (blue) and plotted as individual cells. (C) Gene expression analysis of EPCAM captured and TROP-2–captured populations of cells shows expression of neuroendocrine genes and genes downstream of AR.
Figure 5. TROP-2 is an Effective Target for PET imaging and treatment of xenograft mCRPC tumors. (A) Serial PET imaging and ROI quantifications of TROP-2 in LAPC4, PC3, and 22rv1 tumor-bearing mice injected with 64Cu-labeled anti–TROP-2 antibody or non-specific IgG control as indicated at 4, 24, and 48 hours after injection. H-Heart, L-Liver, and T-Tumor. (B) Time–activity curves of the tumor, liver, blood, and muscle upon intravenous injection of 64Cu-labeled anti–TROP-2 antibody into LAPC4, PC3 or 22rv1 tumor-bearing mice (n = 3). (C) Treatment of LAPC4 xenograft tumors with 90Y-labeled TROP-2 or IgG. Tumor growth is measured as the percentage of initial tumor volume (n = 3). The primary endpoint of the study was pre-specified at 12 days, when all mice were sacrificed, and the time at which we would expect maximal treatment effect. Statistical inference was performed at the primary endpoint, where a Student t test was performed. *, p < 0.05 and was considered statistically significant. (D) H&E staining shows increased cell death in 90Y-labeled TROP-2 sample compared with the control PBS treatment.
Figure 5.
TROP-2 is an Effective Target for PET imaging and treatment of xenograft mCRPC tumors. (A) Serial PET imaging and ROI quantifications of TROP-2 in LAPC4, PC3, and 22rv1 tumor-bearing mice injected with 64Cu-labeled anti–TROP-2 antibody or non-specific IgG control as indicated at 4, 24, and 48 hours after injection. H-Heart, L-Liver, and T-Tumor. (B) Time–activity curves of the tumor, liver, blood, and muscle upon intravenous injection of 64Cu-labeled anti–TROP-2 antibody into LAPC4, PC3 or 22rv1 tumor-bearing mice (n = 3). (C) Treatment of LAPC4 xenograft tumors with 90Y-labeled TROP-2 or IgG. Tumor growth is measured as the percentage of initial tumor volume (n = 3). The primary endpoint of the study was pre-specified at 12 days, when all mice were sacrificed, and the time at which we would expect maximal treatment effect. Statistical inference was performed at the primary endpoint, where a Student t test was performed. *, p < 0.05 and was considered statistically significant. (D) H&E staining shows increased cell death in 90Y-labeled TROP-2 sample compared with the control PBS treatment.

References

    1. Robinson D, Van Allen EM, Wu YM, Schultz N, Lonigro RJ, Mosquera JM, et al. . Integrative clinical genomics of advanced prostate cancer. Cell 2015;161:1215–28. - PMC - PubMed
    1. Henzler C, Li Y, Yang R, McBride T, Ho Y, Sprenger C, et al. . Truncation and constitutive activation of the androgen receptor by diverse genomic rearrangements in prostate cancer. Nat Commun 2016;7:13668. - PMC - PubMed
    1. Quigley DA, Dang HX, Zhao SG, Lloyd P, Aggarwal R, Alumkal JJ, et al. . Genomic hallmarks and structural variation in metastatic prostate cancer. Cell 2018;174:758–69. - PMC - PubMed
    1. Li Y, Yang R, Henzler CM, Ho Y, Passow C, Auch B, et al. . Diverse AR gene rearrangements mediate resistance to androgen receptor inhibitors in metastatic prostate cancer. Clin Cancer Res 2020;26:1965–76. - PMC - PubMed
    1. Antonarakis ES, Lu C, Wang H, Luber B, Nakazawa M, Roeser JC, et al. . AR-V7 and resistance to enzalutamide and abiraterone in prostate cancer. N Engl J Med 2014;371:1028–38. - PMC - PubMed

Publication types