. 2023 Mar 1;12(3):18.
doi: 10.1167/tvst.12.3.18.

Monovision Correction Preference and Eye Dominance Measurements

Affiliations

Monovision Correction Preference and Eye Dominance Measurements

Victor Rodriguez-Lopez et al. Transl Vis Sci Technol. .

Abstract

Purpose: To propose new methods for eye selection in presbyopic monovision corrections.

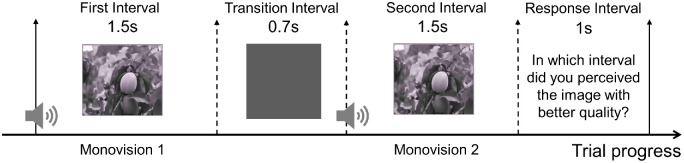
Methods: Twenty subjects with presbyopia performed two standard methods of binary eye dominance identification (sensory with +1.50 diopters [D ]and +0.50 D and sighting with "hole-in-the-card") and two psychophysical methods of perceived visual quality: (1) the Preferential test, 26 natural images were judged with the near addition in one eye or in the other in a 2-interval forced-choice task, and the Eye Dominance Strength (EDS) defined as the proportion of trials where one monovision is preferred over the other; (2) the Multifocal Acceptance Score (MAS-2EV) test, the perceived quality of a natural images set (for 2 luminance levels and distances) was scored and EDS defined as the score difference between monovision in one eye or the other. Left-eye and right-eye dominance are indicated with negative and positive values, respectively. Tests were performed using a Simultaneous Vision Simulator, which allows rapid changes between corrections.

Results: Standard sensory and sighting dominances matched in only 55% of subjects. The Preferential EDS (ranging from -0.7 to +0.9) and MAS-2EV EDS (ranging from -0.6 to +0.4) were highly correlated. Selecting the eye for far in monovision with the MAS-2EV, sensory, or sighting tests would have resulted in 79%, 64%, and 43% success considering the Preferential test as the gold standard.

Conclusions: Tests based on perceptual preference allow selection of the preferred monovision correction and measurement of dominance strength.

Translational relevance: The binocular visual simulator allows efficient implementation of eye preference tests for monovision in clinical use.


Conflict of interest statement

Disclosure: V. Rodriguez-Lopez, (N); X. Barcala, 2EyesVision (E); A. Zaytouny, (N); C. Dorronsoro, 2EyesVision (I, P, E, O); E. Peli, (N); S. Marcos, 2EyesVision (I, P, C, O)

Figures

Figure 1.
Figure 1.
Trial sequence in the Preferential test. A representative trial of the test is shown. In each interval, a monovision condition (randomly NAL or NAR) is presented for 1.5 seconds, separated by a gray field (during 0.7 seconds) and an auditory tone (speaker). Subjects were given 1 second to respond between trials. The example shows one of the 26 natural images used. The test consisted of 52 trials.
Figure 2.
Figure 2.
Eye dominance with clinical eye dominance tests for all subjects. The −1 stands for left-eye dominance and +1 is for right-eye dominance. Dark and light green bars represent sensory eye dominance using +1.50 D and +0.50 D blur, respectively, and dark magenta represents sighting eye dominance.
Figure 3.
Figure 3.
Examples of individual subjects’ results with the Preferential test. (A) For subject 19 for far vision, the proportion of preference for monovision in the left eye (NAL) and monovision in the right eye (NAR). (B) For subject 19 for near vision, the proportion of preference for NAL and NAR. This subject has a strong monovision preference and, consequently, high EDS. (C) For subject 9 for far vision, the proportion of preference for NAL and NAR conditions. (D) For subject 9 for near vision, the proportion of preference for monovision NAL and NAR. This subject is an example of weak monovision preference and, consequently, low EDS.
Figure 4.
Figure 4.
Eye Dominance Strength (EDS) with the Preferential test. (A) Preferential test EDS for far vision (all subjects). Filled blue bars indicate that the subject selected left-eye dominance with the clinical Sensory dominance test with +1.50 D and empty blue bars that the subject selected right-eye dominance. The shaded gray band indicates weak dominance (±0.1). Results above +0.1 indicate right-eye dominance, and below –0.1 left-eye dominance. Bottom subplot represents the average Preferential test EDS across subjects that selected left-eye dominance with clinical Sensory dominance test with +1.50 D (filled blue bar) and right-eye dominance (empty blue bar). (B) Preferential EDS for near vision (all subjects). Filled red bars indicate that the subject selected left-eye dominance with the clinical Sensory dominance test with +1.50 D and the empty red bars indicate that the subject selected right-eye dominance. Bottom subplot represents the Preferential test EDS across subjects that selected left-eye dominance with clinical Sensory dominance test using 1.50 D (filled red bar) and right-eye dominance (empty red bar). (C) Relationship between Preferential test EDS for far and near vision. The solid line represents a linear correlation (m = 0.87; r = 0.86; P < 0.05) and the dashed line represents a 1:1 relationship.
Figure 5.
Figure 5.
Example of individual subjects’ results with the MAS-2EV test. The MAS-2EV polygons for two subjects. Lines represent the scores for FF (black), monovision in the left eye (NAL, dotted light gray), and monovision in the right eye (NAR, dashed dark gray). (A) Subject 19 shows a large degradation at far with NAR and significant differences between NAL and NAR (high Eye Dominance Strength [EDS]). (B) Subject 11 shows small differences between NAL and NAR (low EDS).
Figure 6.
Figure 6.
Eye Dominance Strength (EDS) with MAS-2EV test. (A) Relationship between MAS-2EV eye dominance for far vision versus near vision. The solid line represents a linear correlation (m = 0.77; r = 0.79; P < 0.05) and the dashed line represents a 1:1 relationship. (B) MAS-2EV test EDS for all subjects for far. Filled blue bars indicate that the subject selected left-eye dominance with the clinical Sensory dominance test with 1.50 D and empty blue bars that the subject selected right-eye dominance. The shaded gray band indicates weak dominance (±0.1). Bottom subplot represents the average of the MAS-2EV test EDS across all subjects that selected left-eye dominance with clinical Sensory dominance test using 1.50 D (filled blue bar) and right-eye dominance (empty blue bar). (C) MAS-2EV test EDS for all subjects for near vision. Filled red bars indicate that the subject selected left-eye dominance with the clinical sensory dominance test with 1.50 D and empty red bars indicate that the subject selected right-eye dominance. Bottom subplot represents the average of MAS-2EV test EDS across subjects that selected left-eye dominance with clinical sensory dominance test using 1.50 D (filled red bar) and right-eye dominance (empty red bar).
Figure 7.
Figure 7.
Correspondence between Preferential and MAS-2EV eye dominance tests. Blue dots indicate far vision and red dots indicate near vision.
Figure 8.
Figure 8.
Proportion of successful patients. Proportion of subjects in whom the result of eye dominance provided for each test agreed with the results provided by the Preferential test, considered as the reference for monovision selection. The time to perform sensory eye tests with +1.50 D or +0.50 D is 45 seconds, although they are plotted shifted for visualization purposes.

Similar articles

Cited by

References

    1. Harris MG, Classé JG. Clinicolegal considerations of monovision. J Am Optom Assoc. 1988; 59: 491–495. - PubMed
    1. Jain S, Arora I, Azar DT. Success of monovision in presbyopes: Review of the literature and potential applications to refractive surgery. Surv Ophthalmol. 1996; 40: 491–499. - PubMed
    1. Mapp AP, Ono H, Barbeito R. What does the dominant eye dominate? A brief and somewhat contentious review. Percept Psychophys. 2003; 65: 310–317. - PubMed
    1. Barbeito R. Sighting dominance: An explanation based on the processing of visual direction in tests of sighting dominance. Vision Res. 1981; 21: 855–860. - PubMed
    1. Evans BJW. Monovision: A review. Ophthalmic Physiol Opt. 2007; 27: 417–439. - PubMed

Publication types