Clinical Trial
. 2023 Jul;72(7):2357-2373.
doi: 10.1007/s00262-023-03421-7. Epub 2023 Mar 20.

A phase I prospective, non-randomized trial of autologous dendritic cell-based cryoimmunotherapy in patients with metastatic castration-resistant prostate cancer

Affiliations
Clinical Trial

A phase I prospective, non-randomized trial of autologous dendritic cell-based cryoimmunotherapy in patients with metastatic castration-resistant prostate cancer

Liv Cecilie Vestrheim Thomsen et al. Cancer Immunol Immunother. 2023 Jul.

Abstract

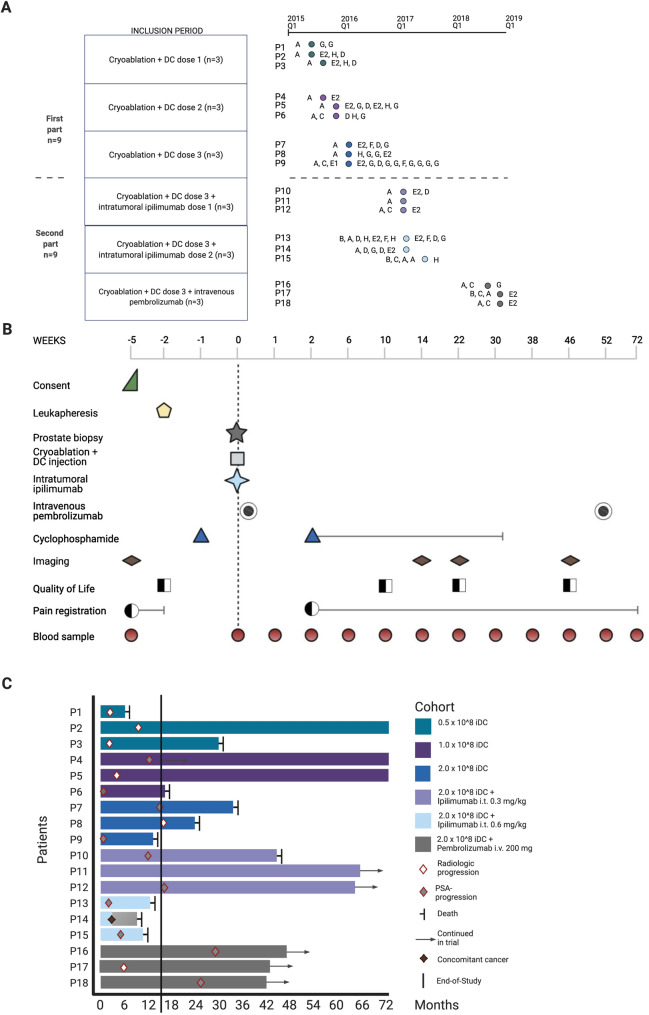
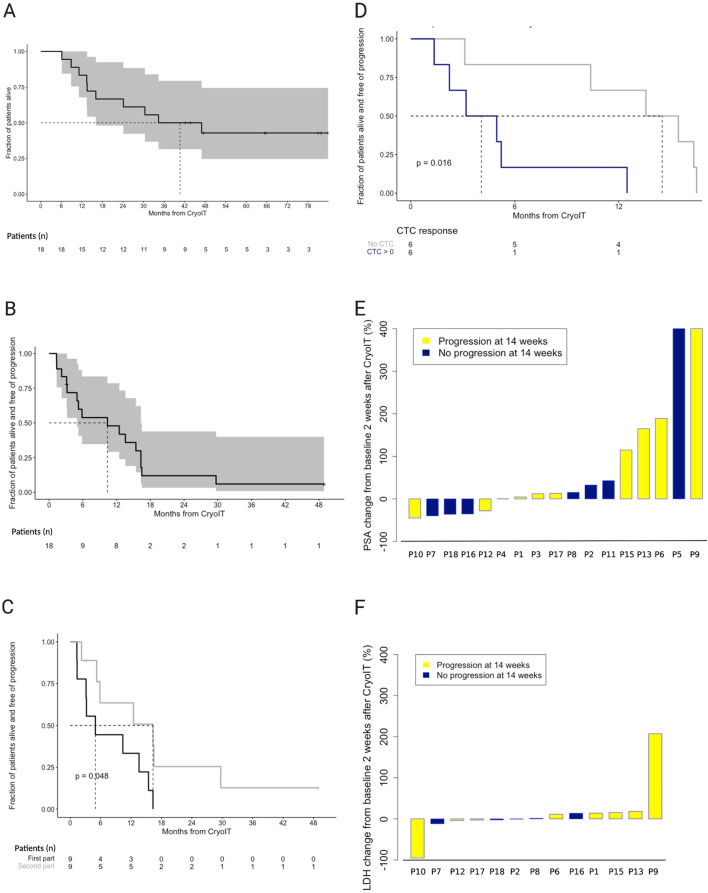
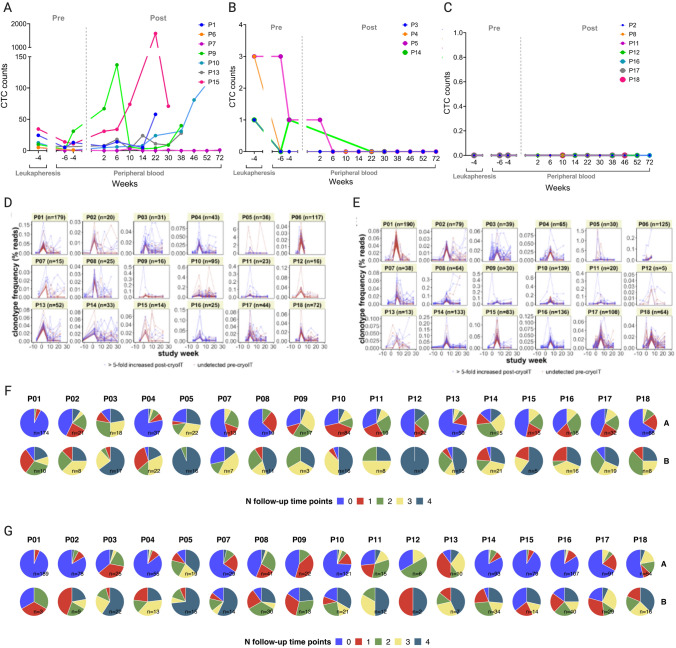
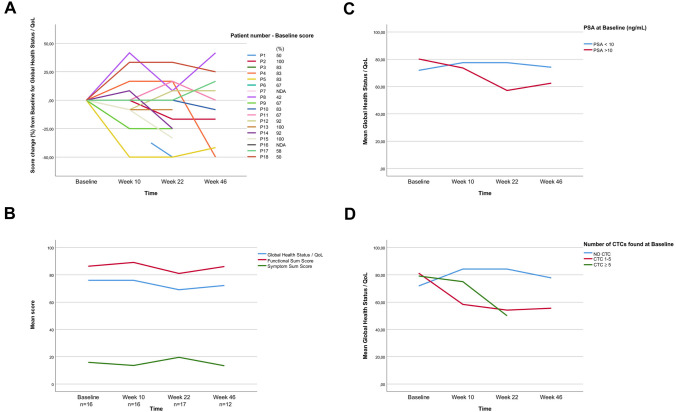
Metastatic castration-resistant prostate cancer (mCRPC) is an immunologically cold disease with dismal outcomes. Cryoablation destroys cancer tissue, releases tumor-associated antigens and creates a pro-inflammatory microenvironment, while dendritic cells (DCs) activate immune responses through processing of antigens. Immunotherapy combinations could enhance the anti-tumor efficacy. This open-label, single-arm, single-center phase I trial determined the safety and tolerability of combining cryoablation and autologous immature DC, without and with checkpoint inhibitors. Immune responses and clinical outcomes were evaluated. Patients with mCRPC, confirmed metastases and intact prostate gland were included. The first participants underwent prostate cryoablation with intratumoral injection of autologous DCs in a 3 + 3 design. In the second part, patients received cryoablation, the highest acceptable DC dose, and checkpoint inhibition with either ipilimumab or pembrolizumab. Sequentially collected information on adverse events, quality of life, blood values and images were analyzed by standard descriptive statistics. Neither dose-limiting toxicities nor adverse events > grade 3 were observed in the 18 participants. Results indicate antitumor activity through altered T cell receptor repertoires, and 33% durable (> 46 weeks) clinical benefit with median 40.7 months overall survival. Post-treatment pain and fatigue were associated with circulating tumor cell (CTC) presence at inclusion, while CTC responses correlated with clinical outcomes. This trial demonstrates that cryoimmunotherapy in mCRPC is safe and well tolerated, also for the highest DC dose (2.0 × 10⁸) combined with checkpoint inhibitors. Further studies focusing on the biologic indications of antitumor activity and immune system activation could be considered through a phase II trial focusing on treatment responses and immunologic biomarkers.

Keywords: Cryoablation; Immature dendritic cells; Immunotherapy; Metastatic castration-resistant prostate cancer; Phase I clinical trial; Safety.


Conflict of interest statement

Dr. Gjertsen reports other from Kinn Therapeutics AS, other from Alden Cancer Therapeutics 2 AS, personal fees from BerGenBio AS, personal fees from Novartis AS, personal fees from Seattle Genetics Inc., personal fees from Pfizer, non-financial support from Roche, non-financial support from MSD, outside the submitted work. Dr. Kalland reports grants from Research Council of Norway, grants from The Norwegian Cancer Society, during the conduct of the study; In addition, Dr. Kalland has a patent PCT/EP2017/077698 pending and is the CEO of and owns Stocks in the Company Alden Cancer Therapy II AS that has sponsored the trial registered at ClinicalTrials.gov Identifier: NCT02423928 and which is published in the presently submitted manuscript. He has received no salary or remuneration from Alden Cancer Therapy II AS. Dr. Øyan owns stocks in the Company Alden Cancer Therapy II AS that has sponsored the trial registered at ClinicalTrials.gov Identifier: NCT02423928 and which is published in the presently submitted manuscript. She has received no salary or remuneration from Alden Cancer Therapy II AS. Dr. Gabriel reports grants from Norwegian Cancer Society during the conduct of the study. Dr Thomsen reports personal fees from Bayer and AstraZeneca, sitting on the advisory board for Eisai Co., and financial support from AstraZeneca to a researcher-initiated trial. Dr Beisland reports personal fees from Pfizer, sitting on advisory boards for BMS and MSD, and having travel expenses covered by Olympus. The remaining authors have no conflicts of interest to report.

Figures

Fig. 1
Fig. 1
Study overview. A Graphical representation of the inclusion period of participants and cancer-directed treatment lines. The two cohort parts are separated by the horizontal dashed line. Time of inclusion according to year, quartile, and dose of study drugs is indicated by colored dots. Cancer-directed treatment received by each participant prior to inclusion (to the left of dots) and after disease progression during the trial participation period (to the right of dots) is listed as letters. A; GnRH agonist (+ initial 4 weeks with bicalutamide), B; GNRH antagonist, C; early chemotherapy (≤ 3 months after diagnosis), D; late chemotherapy (> 3 months after diagnosis), E; antiandrogen monotherapy (E1; bicalutamide, E2; enzalutamide), F; androgen-signaling inhibitor (abiraterone), G; external beam radiation (EBRT) for symptomatic disease, H; EBRT combined with i.v. radium-223. B Clinical trial design. Procedures performed as part of the CryoIT trial are listed to the left, and the symbols indicate at which time points during the trial the participants had each procedure done. The vertical dashed line at 0 weeks indicates the time of cryoablation and autologous dendritic cell injection. C Swimmer plot with response patterns. Each bar shows the response of one patient. The 0 on the horizontal axis indicates time of CryoIT treatment. The follow-up period in months is given along the horizontal axis. The vertical line indicates End-of-Trial 72 weeks after CryoIT. Of the 18 patients, 17 had subsequent progressive disease, and ten died. One participant (P14) had stable prostate cancer but developed concomitant malignant melanoma with rapid progression leading to death. This patient was only included in the analyses of the safety of the treatment and analyses where results were annotated by participant ID. Among the patients who were still in follow-up at the time of data cut-off, eight had progressed while one still had clinical treatment benefit according to the last follow-up of 48 months after treatment. Figure created with BioRender.com, i.t. intratumoral injection, i.v. intravenous infusion
Fig. 2
Fig. 2
Clinical, laboratory and radiological outcomes. A–D Survival estimates visualized by Kaplan–Meier curves. Progression was estimated based on radiologic images and PSA changes. The patient with concomitant cancer development (P14) was excluded from the analyses. A Overall survival in the total cohort (n = 18). B Progression-free survival (PFS) in the total cohort (n = 18). C PFS in the two parts of the trial, the first nine participants in black (First part), and the participants included as number 10–18 in gray (Second part). D CTC response two weeks after the CryoIT procedure. Grouped as No CTC (CTC = 0) or CTC > 0 independent on pre-treatment values. The p-values resulting from the comparisons in (C) and (D) are listed in the plots. For all four plots, the months of survival after the CryoIT are given along the x-axis. Fractions of the total patient cohort are listed along the y-axis. The dotted lines indicate the time point when 50 percent of the cohort had reached the end point. The number of patients used for the analyses are shown below the x-axis. The 95% confidence intervals are illustrated by a gray area in A and B. E–F show waterfall plots illustrating changes from baseline. Changes in PSA E and lactate dehydrogenase (LDH) F two weeks after CryoIT are shown. The bars indicating patients with progression are blue, and those with non-progressive disease at week 14 are yellow. Progression was defined radiologically and/or based on PSA increases > 25% and an absolute increase of 2 ng/mL
Fig. 3
Fig. 3
Changes in circulating tumor cells (CTC) and T cell receptor (TCR) clonotypes. A–C CellSearch platform numbers of CTC prior to cryoimmunotherapy (CryoIT) in 7.5 ml peripheral blood and in the leukapheresis sample are shown along the Y-axis. Weeks pre-CryoIT (-) and post-CryoIT are shown on the X-axis. Participants are grouped according to pre-treatment levels of CTC: A CTC ≥ 5, B CTC = 1–4, and (C) No detectable CTC. The vertical dashed line shows the time of CryoIT. D–E Frequency of clonotypes over the course of the clinical trial up to 30 weeks following CryoIT. Frequency changes to the top 200 largest (number of sequence counts) clonotypes at either D two weeks or E six weeks after CryoIT were examined. The individual patient graphs show how many (n) of the 200 largest clonotypes which were either undetectable prior to treatment (red) or > fivefold expanded after the CryoIT (blue). For the pretreatment time points, maximum clonal frequencies were used. Time in weeks is shown on the x-axis, with 0 indicating time of the CryoIT. Plots F and G show the longevity of clonotypes identified in the samples collected two F and six G weeks after the CryoIT. Pie charts are colored according to total number of follow-up time points at which the clonotypes in the samples were identified. Zero (blue) indicates clonotypes which were not detected in the samples at any of the four time points subsequent to either week 2 or 6 post-CryoIT. Group A: Clonotypes that were undetectable in all available pre-CryoIT samples; Group B: Clonotypes which were at least fivefold expanded compared to available pre-CryoIT samples
Fig. 4
Fig. 4
Health-related quality-of-life measurements. Time in weeks since trial inclusion (baseline) is illustrated along the x-axis of all plots. A Spider diagram illustrating the individual changes in the scoring of the Global Health Status/Quality of Life domain (questions 29–30 in the EORTC-QLQ-C30 questionnaire) over time. For each patient, the baseline score is presented next to the patient number. To the right, the individual pre-treatment (baseline) scores of the participants are given. B Line plot illustrating the overall stability of the functional and symptom sum scores, as well as the Global Health Status/Quality of Life. Numbers (n) indicate how many participants completed the EORTC-QLQ-C30 questionnaire at each time point. C-D Line plots demonstrating the effect on the Global Health Status/Quality of Life over time according to C the PSA-levels at baseline, and D the dichotomized presence or absence of circulating tumor cells (CTC) at baseline. QoL; Quality of Life
Fig. 5
Fig. 5
Results of the genetic and protein expression analyses of the tumor tissues. A The mutational landscape of 18 mCRPC tumor samples. Mutation distribution as detected by targeted sequencing of 360 cancer related genes, plotted as mutation per gene (rows) among the 18 patients (columns). Green, orange, and blue illustrate nonsense mutations, frameshift mutations, and missense mutations, respectively. Numbers listed above the gray area are estimates of tumor mutational burden (TMB) per sample, where black numbers indicate TMB based on results from the 360-gene custom panel and red numbers indicate TMB estimated form a similar analysis based on Illumina TSO500. Bars and percentages to the right of the gray panel represent mutation frequency per gene. The bar under the gray plot area indicates the tumor cell fraction (TCF) as above 20% (blue) or below 20% (red) as estimated by the FACETS algorithm. B-C Microscopy images of the immunohistochemical protein expression in a formalin-fixed paraffin-embedded sample of the four MMR proteins examined for estimation of cancer cell microsatellite instability: MLH1, PMS2, MSH2, and MSH6. For tissue orientation, hematoxylin–eosin (HE) staining was performed on the first representative slides from each patient biopsy sample. B Sample staining pattern with > 10% positive expression of MMR proteins, representative for 17/18 participants. C Staining pattern for the one sample with equivocal results demonstrating < 10% positivity of protein expression of MSH6 and MSH2 in the tumor cell nuclei. NA; missing

References

    1. Cornford P, Bellmunt J, Bolla M, et al. EAU-ESTRO-SIOG guidelines on prostate cancer part II: treatment of relapsing, metastatic, and castration-resistant prostate cancer. Eur Urol. 2017;71(4):630–642. doi: 10.1016/j.eururo.2016.08.002. - DOI - PubMed
    1. Westdorp H, Creemers JHA, van Oort IM, et al. Blood-derived dendritic cell vaccinations induce immune responses that correlate with clinical outcome in patients with chemo-naive castration-resistant prostate cancer. J Immunother Cancer. 2019;7(1):302. doi: 10.1186/s40425-019-0787-6. - DOI - PMC - PubMed
    1. Nuhn P, De Bono JS, Fizazi K, et al. Update on systemic prostate cancer therapies: management of metastatic castration-resistant prostate cancer in the era of precision oncology. Eur Urol. 2019;75(1):88–99. doi: 10.1016/j.eururo.2018.03.028. - DOI - PubMed
    1. Kantoff PW, Higano CS, Shore ND, et al. Sipuleucel-T immunotherapy for castration-resistant prostate cancer. N Engl J Med. 2010;363(5):411–422. doi: 10.1056/NEJMoa1001294. - DOI - PubMed
    1. de Bono J, Mateo J, Fizazi K, et al. Olaparib for metastatic castration-resistant prostate cancer. N Engl J Med. 2020;382(22):2091–2102. doi: 10.1056/NEJMoa1911440. - DOI - PubMed

Publication types

LinkOut - more resources