

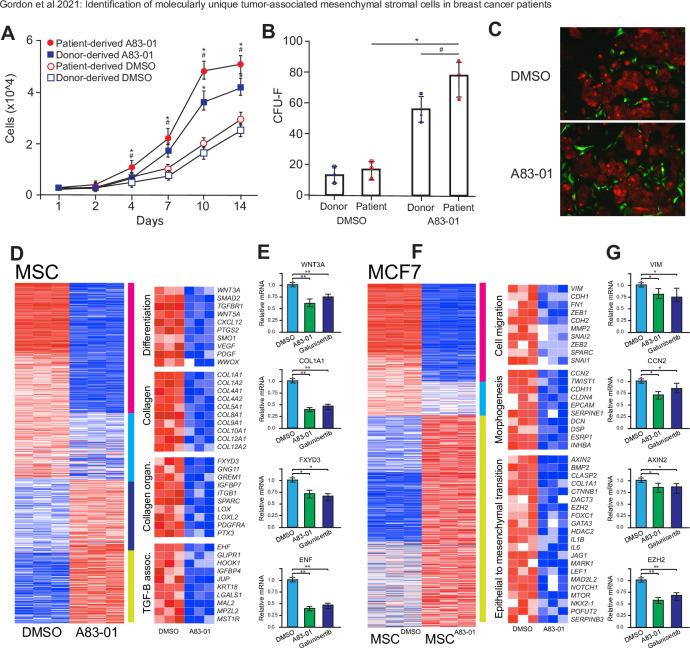
Identification of molecularly unique tumor-associated mesenchymal stromal cells in breast cancer patients
- PMID: 36940196
- PMCID: PMC10027225
- DOI: 10.1371/journal.pone.0282473
Identification of molecularly unique tumor-associated mesenchymal stromal cells in breast cancer patients
Abstract
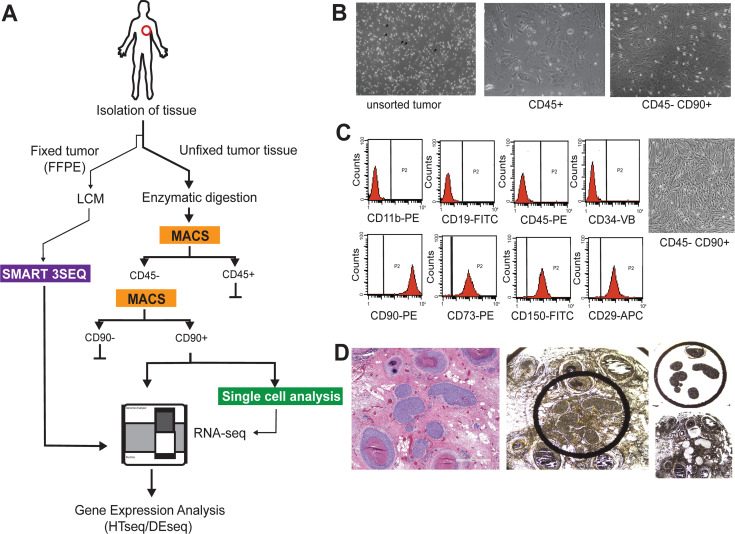
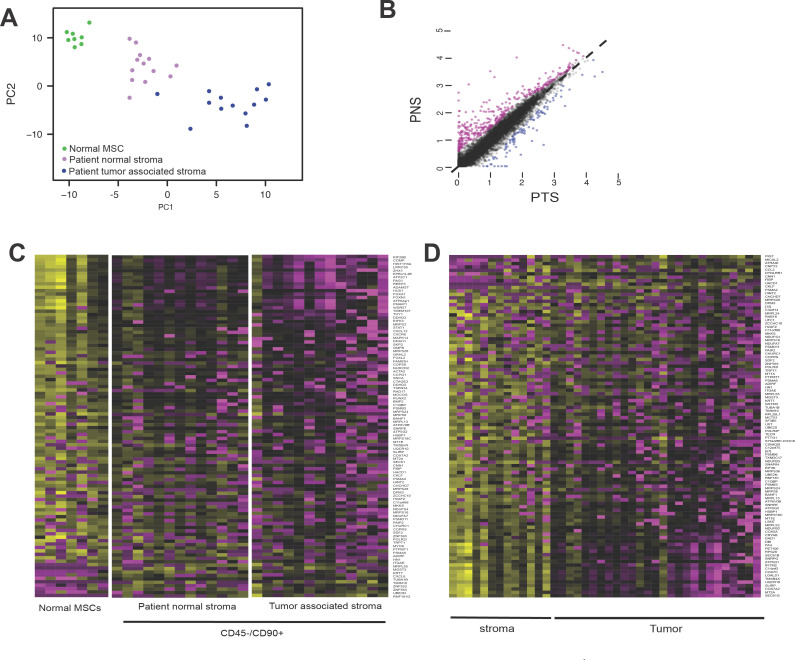
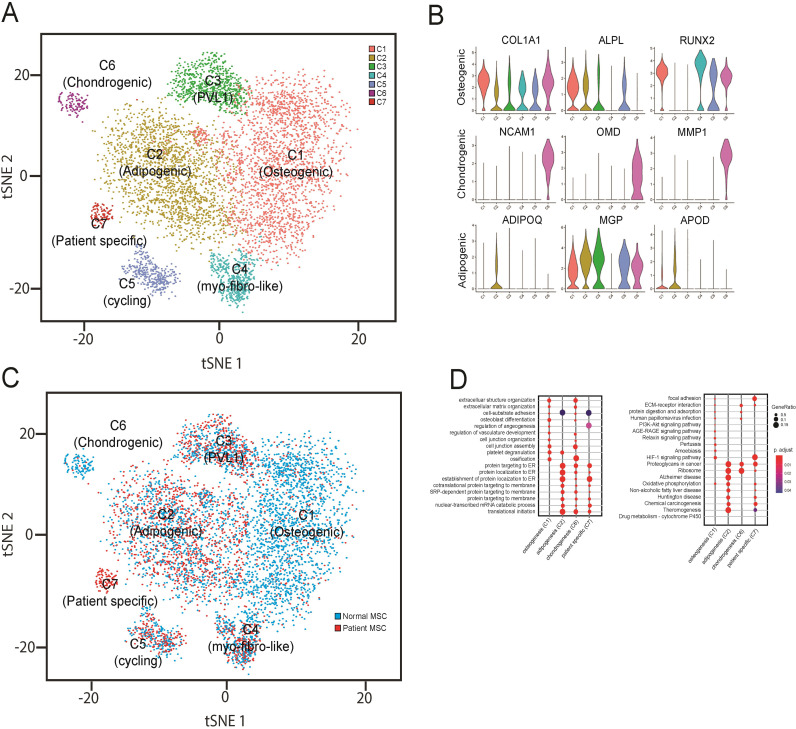
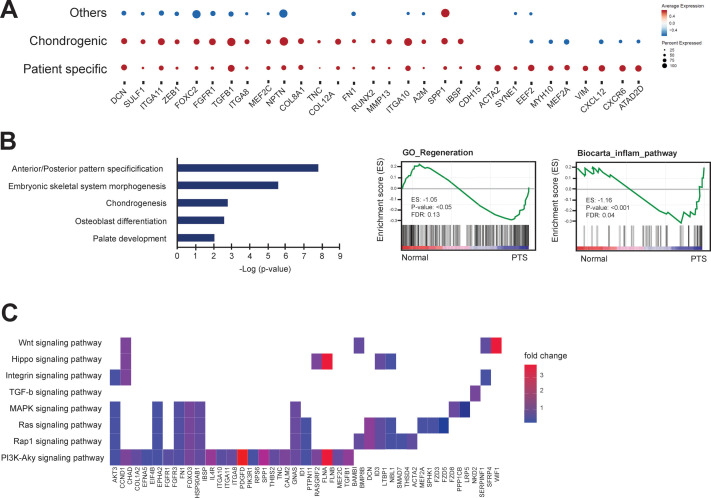
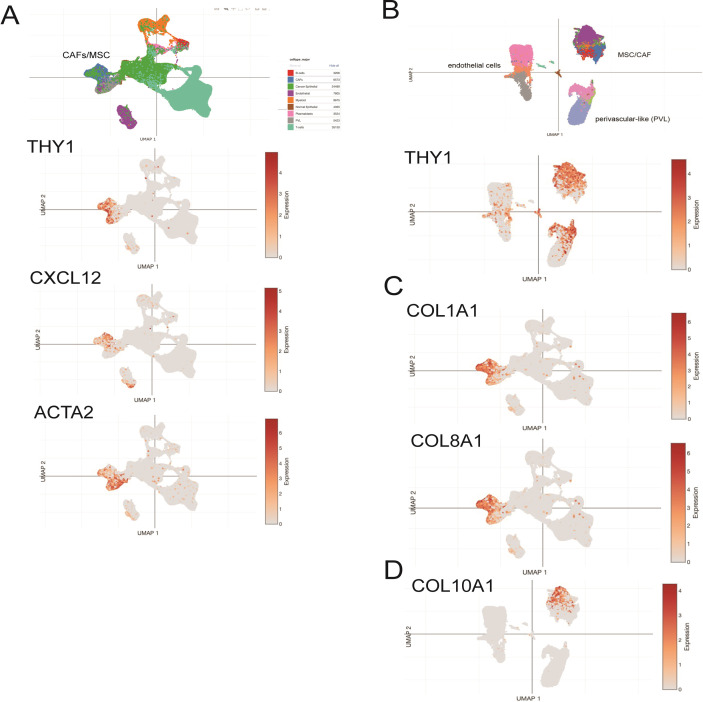
The tumor microenvironment is a complex mixture of cell types that bi-directionally interact and influence tumor initiation, progression, recurrence, and patient survival. Mesenchymal stromal cells (MSCs) of the tumor microenvironment engage in crosstalk with cancer cells to mediate epigenetic control of gene expression. We identified CD90+ MSCs residing in the tumor microenvironment of patients with invasive breast cancer that exhibit a unique gene expression signature. Single-cell transcriptional analysis of these MSCs in tumor-associated stroma identified a distinct subpopulation characterized by increased expression of genes functionally related to extracellular matrix signaling. Blocking the TGFβ pathway reveals that these cells directly contribute to cancer cell proliferation. Our findings provide novel insight into communication between breast cancer cells and MSCs that are consistent with an epithelial to mesenchymal transition and acquisition of competency for compromised control of proliferation, mobility, motility, and phenotype.
Copyright: © 2023 Gordon et al. This is an open access article distributed under the terms of the Creative Commons Attribution License, which permits unrestricted use, distribution, and reproduction in any medium, provided the original author and source are credited.
Conflict of interest statement
The authors have declared that no competing interests exist.
Figures
References
-
- Castro-Malaspina H, Gay RE, Resnick G, Kapoor N, Meyers P, Chiarieri D, et al.. Characterization of human bone marrow fibroblast colony-forming cells (CFU-F) and their progeny. Blood. 1980;56(2):289–301. - PubMed
Publication types
MeSH terms
Grants and funding
LinkOut - more resources
Full Text Sources
Medical
