An astonishing regularity in student learning rate
- PMID: 36940328
- PMCID: PMC10068755
- DOI: 10.1073/pnas.2221311120
An astonishing regularity in student learning rate
Abstract
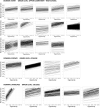
Leveraging a scientific infrastructure for exploring how students learn, we have developed cognitive and statistical models of skill acquisition and used them to understand fundamental similarities and differences across learners. Our primary question was why do some students learn faster than others? Or, do they? We model data from student performance on groups of tasks that assess the same skill component and that provide follow-up instruction on student errors. Our models estimate, for both students and skills, initial correctness and learning rate, that is, the increase in correctness after each practice opportunity. We applied our models to 1.3 million observations across 27 datasets of student interactions with online practice systems in the context of elementary to college courses in math, science, and language. Despite the availability of up-front verbal instruction, like lectures and readings, students demonstrate modest initial prepractice performance, at about 65% accuracy. Despite being in the same course, students' initial performance varies substantially from about 55% correct for those in the lower half to 75% for those in the upper half. In contrast, and much to our surprise, we found students to be astonishingly similar in estimated learning rate, typically increasing by about 0.1 log odds or 2.5% in accuracy per opportunity. These findings pose a challenge for theories of learning to explain the odd combination of large variation in student initial performance and striking regularity in student learning rate.
Keywords: deliberate practice; learning curves; learning rate; logistic regression growth modeling; educational equity.
Conflict of interest statement
The authors declare no competing interest.
Figures


References
-
- Cen H., Koedinger K. R., Junker B. “Learning Factors Analysis: A general method for cognitive model evaluation and improvement” in Proceedings of the 8th International Conference on Intelligent Tutoring Systems, Ikeda M., Ashley K. D., Chan T.-W., Eds. (Springer-Verlag, Berlin, 2006), pp. 164–175.
-
- Liu R., Koedinger K. R., Closing the loop: Automated data-driven cognitive model discoveries lead to improved instruction and learning gains. J. Educ. Data Mining 9, 25–41 (2017).
-
- Koedinger K. R., McLaughlin E. A. “Seeing language learning inside the math: Cognitive analysis yields transfer” in Proceedings of the 32nd Annual Conference of the Cognitive Science Society, Ohlsson S., Catrambone R., Eds. (Austin, TX, 2010), pp. 471–476.
-
- Koedinger K. R., Yudelson M. V., Pavlik P. I., Testing theories of transfer using error rate learning curves. Topics Cogn. Sci. 8, 589–609 (2016). - PubMed
-
- Ericsson K. A., Krampe R. T., Tesch-Romer C., The role of deliberate practice in the acquisition of expert performance. Psychol. Rev. 100, 363–406 (1993).
Grants and funding
LinkOut - more resources
Full Text Sources

