. 2023 Mar 28;120(13):e2218949120.
doi: 10.1073/pnas.2218949120. Epub 2023 Mar 20.

Human brain effects of DMT assessed via EEG-fMRI

Affiliations

Human brain effects of DMT assessed via EEG-fMRI

Christopher Timmermann et al. Proc Natl Acad Sci U S A. .

Abstract

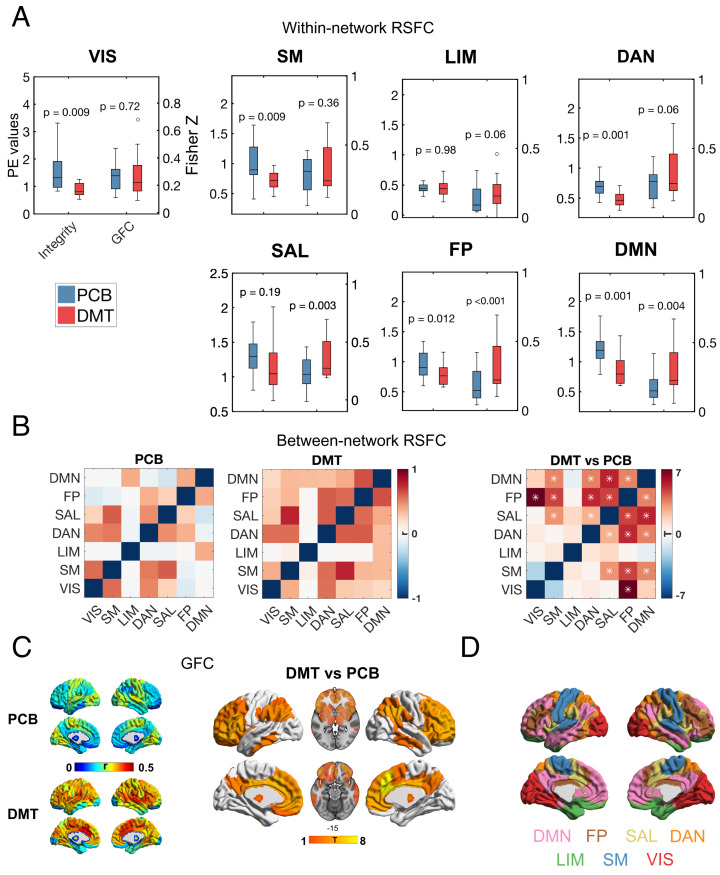
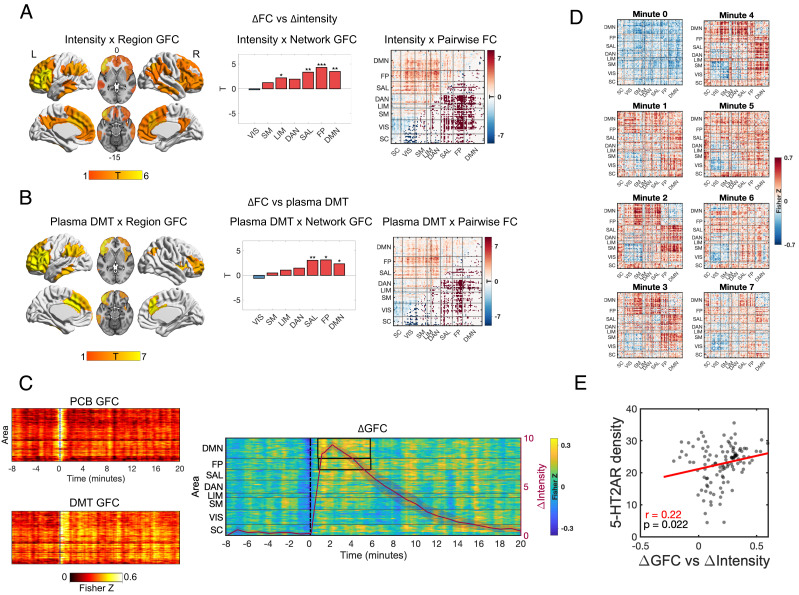
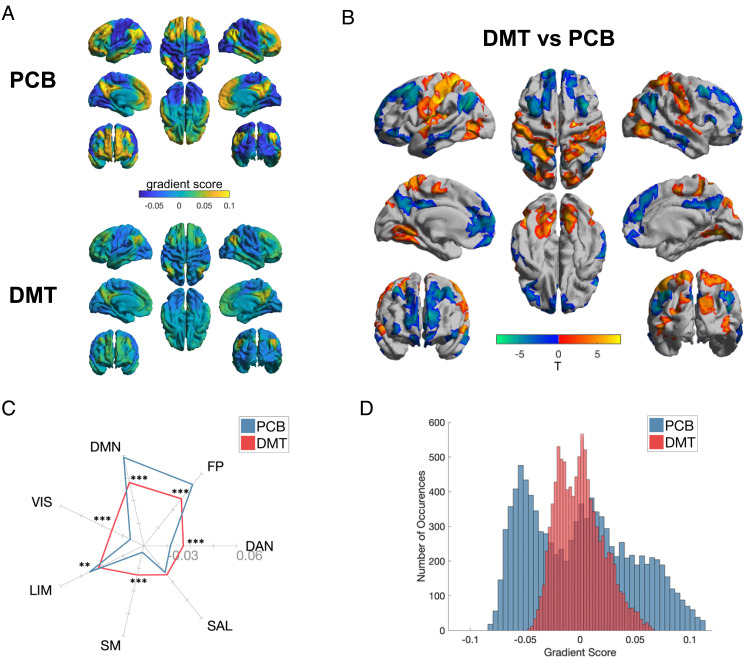
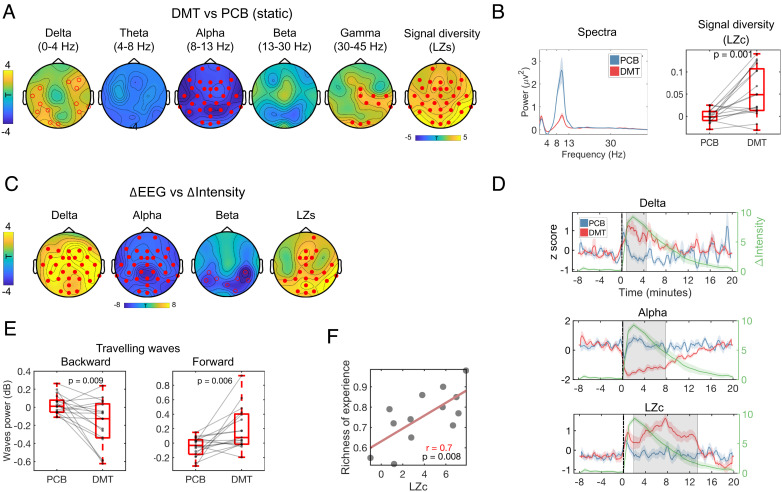
Psychedelics have attracted medical interest, but their effects on human brain function are incompletely understood. In a comprehensive, within-subjects, placebo-controlled design, we acquired multimodal neuroimaging [i.e., EEG-fMRI (electroencephalography-functional MRI)] data to assess the effects of intravenous (IV) N,N-Dimethyltryptamine (DMT) on brain function in 20 healthy volunteers. Simultaneous EEG-fMRI was acquired prior to, during, and after a bolus IV administration of 20 mg DMT, and, separately, placebo. At dosages consistent with the present study, DMT, a serotonin 2A receptor (5-HT2AR) agonist, induces a deeply immersive and radically altered state of consciousness. DMT is thus a useful research tool for probing the neural correlates of conscious experience. Here, fMRI results revealed robust increases in global functional connectivity (GFC), network disintegration and desegregation, and a compression of the principal cortical gradient under DMT. GFC × subjective intensity maps correlated with independent positron emission tomography (PET)-derived 5-HT2AR maps, and both overlapped with meta-analytical data implying human-specific psychological functions. Changes in major EEG-measured neurophysiological properties correlated with specific changes in various fMRI metrics, enriching our understanding of the neural basis of DMT's effects. The present findings advance on previous work by confirming a predominant action of DMT-and likely other 5-HT2AR agonist psychedelics-on the brain's transmodal association pole, i.e., the neurodevelopmentally and evolutionarily recent cortex that is associated with species-specific psychological advancements, and high expression of 5-HT2A receptors.

Keywords: ayahuasca; consciousness; dimethyltryptamine; psychedelics; serotonin.


Conflict of interest statement

The authors declare no competing interest.

Figures

Fig. 1.
Fig. 1.
Reduced RSN integrity and segregation and increased GFC with DMT. (A) Analysis of within-network sRSFC or integrity (parameter estimates and Fisher Z values) for DMT (red) versus placebo (blue) shows significant reductions in integrity for 5 of 7 networks, and increases in global functional connectivity (GFC) in 3 of 7 networks (FDR correction, P < 0.05). (B) Decreased between-network segregation was especially pronounced for the FP/DMN/SAL or TOP networks and other networks (*P < 0.05, FDR corrected). (C) Increases in GFC were especially pronounced for regions associated with the TOP of the human brain’s principal gradient (P < 0.05, FDR corrected). See SI Appendix, Figs. S2 and S3 for complementary analysis without motion confounds and SI Appendix, Fig. S5 for analysis using global signal regression. (D) Networks used for analyses (sRSFC = static resting-state functional connectivity; networks; VIS = visual; SM = somatomotor; DAN = dorsal attentional; SAL = ventral attentional/salience; LIM = limbic; FP = frontoparietal; DMN = default mode; TOP = transmodal association pole).
Fig. 2.
Fig. 2.
Dynamics changes in brain RSFC under DMT. (A, Left) Areas showing a significant association between real-time intensity ratings and dynamic global functional connectivity (GFC) for DMT minus placebo (P < 0.05, FDR corrected). (A, Middle) Dynamic effects of DMT versus placebo on network GFC, showing significant increases in GFC for DMN/FP/SAL networks—all associated with the TOP of the brain’s principal functional gradient, as well as the LIM network (*P < 0.05, **P < 0.01, ***P < 0.001; FDR corrected). (A, Right) Pairwise functional connectivity (FC) matrix representing the association between intensity ratings and dynamic functional connectivity (significant links are highlighted in the lower diagonal; FDR corrected). (B) Areas showing a significant association between DMT plasma levels and regional GFC, network GFC, and pairwise FC (FDR corrected). (C, Left) Regional GFC across time for placebo, DMT, and (C, Right) DMT minus placebo, overlayed with reported average intensity ratings (±SEM). Black boxes highlight epochs where changes in network GFC are statistically significant (cluster corrected, P < 0.05). (D) Average (DMT—placebo) pairwise FC matrices for the first seven minutes following DMT/placebo administration. (E) A significant association was found between 5-HT2AR density maps and dynamic GFC (representing beta values of the relationship between GFC and intensity ratings). (Networks: VIS = visual; SM = somatomotor; DAN = dorsal attentional; SAL = ventral attentional/salience; LIM = limbic; FP = frontoparietal; DMN = default mode; SC = subcortical regions; TOP = transmodal association pole).
Fig. 3.
Fig. 3.
Compression of the principal gradient under DMT. (A) Mean principal gradient for the placebo (Top) and DMT (Bottom) conditions, representing the principal axis from unimodal to transmodal cortex. (B) DMT > Placebo between-group vertex-wise (Top) and (C) network-wise (Bottom) contrasts. Network-wise radial plot displays the mean intranetwork principal gradient score for each network for DMT and placebo (*P < 0.05, **P < 0.01, ***P < 0.001; FDR corrected). (D) Histogram showing the distribution of principal gradient values for placebo and DMT conditions for each brain area. (Networks: VIS = visual; SM = somatomotor; DAN = dorsal attentional; SAL = ventral attentional/salience; LIM = limbic; FP = frontoparietal; DMN = default mode).
Fig. 4.
Fig. 4.
Effects of DMT on EEG spectral power and signal diversity. (A) DMT-induced widespread decreases in alpha power and increases in signal diversity (estimated via Lempel–Ziv, [LZ]) plus delta and gamma power. (B) Whole-brain power spectra and signal diversity (LZc) showed consistent between-condition differences. (C) Minute-by-minute intensity ratings correlated positively with increases in delta power and LZs and negatively with global alpha and posterior beta power changes (•P < 0.01, ºP < 0.05, cluster corrected). (D) Temporally resolved effects of DMT on delta and alpha power, plus LZc (shaded areas correspond to epochs of between-condition statistical difference, P < 0.05, cluster corrected). The green trace reflects average subjective intensity ratings over time. (E) Significantly backward wave (BW) power and increased forward wave (FW) power was observed in the DMT versus placebo contrast (each condition was baseline corrected). (F) Correlation between LZc and “richness of the experience.” LZs = Lempel–Ziv per channel; LZc = Lempel–Ziv averaged across channels.
Fig. 5.
Fig. 5.
EEG changes in relation to fMRI RSFC changes. Displayed in AD are associations between EEG measures and global functional connectivity (GFC) per region (left brain surfaces; significant regions displayed; P < 0.05, FDR corrected), network GFC (middle bar plots; significant P < 0.05, FDR corrected), and pairwise functional connectivity (FC) (right correlation matrices with significant links displayed in the lower quadrants; P < 0.05, FDR corrected). (A) Frontal delta power was positively associated with widespread GFC and distributed connections. (B) Parietal alpha power was negatively associated with GFC in high-level and attentional networks, as well as the limbic network. (C) Occipital gamma power was positively associated with increases in GFC at frontoparietal and limbic networks. (D) Signal diversity (LZc) was associated with increases in GFC at high-level and limbic networks (*< 0.05, **P < 0.01, ***P < 0.001; FDR corrected). (Networks: VIS = visual; SM = somatomotor; DAN = dorsal attentional; SAL = ventral attentional/salience; LIM = limbic; FP = frontoparietal; DMN = default mode; SC = subcortical regions)

References

    1. Miller M. J., Albarracin-Jordan J., Moore C., Capriles J. M., Chemical evidence for the use of multiple psychotropic plants in a 1,000-year-old ritual bundle from South America. Proc. Natl. Acad. Sci. U.S.A. 166, 11207–11212 (2019), 10.1073/pnas.1902174116. - DOI - PMC - PubMed
    1. Nichols D. E., Psychedelics. Pharmacol. Rev. 68, 264–355 (2016). - PMC - PubMed
    1. Carhart-harris R. L., et al. , Trial of Psilocybin versus Escitalopram for depression. N. Engl. J. Med. 384, 1402–1411 (2021), 10.1056/nejmoa2032994. - DOI - PubMed
    1. Goodwin G. M., et al. , Single-dose psilocybin for a treatment-resistant episode of major depression. N. Engl. J. Med. 387, 1637–1648 (2022), 10.1056/nejmoa2206443. - DOI - PubMed
    1. Palhano-Fontes F., et al. , Rapid antidepressant effects of the psychedelic ayahuasca in treatment-resistant depression: A randomised placebo-controlled trial. Psychol. Med. 49, 655–663 (2018), 10.1017/S0033291718001356. - DOI - PMC - PubMed

Publication types