. 2023 Mar 28;120(13):e2219978120.
doi: 10.1073/pnas.2219978120. Epub 2023 Mar 20.

Proteasome inhibitor bortezomib stabilizes and activates p53 in hematopoietic stem/progenitors and double-negative T cells in vivo

Affiliations

Proteasome inhibitor bortezomib stabilizes and activates p53 in hematopoietic stem/progenitors and double-negative T cells in vivo

Yuezhen Xue et al. Proc Natl Acad Sci U S A. .

Abstract

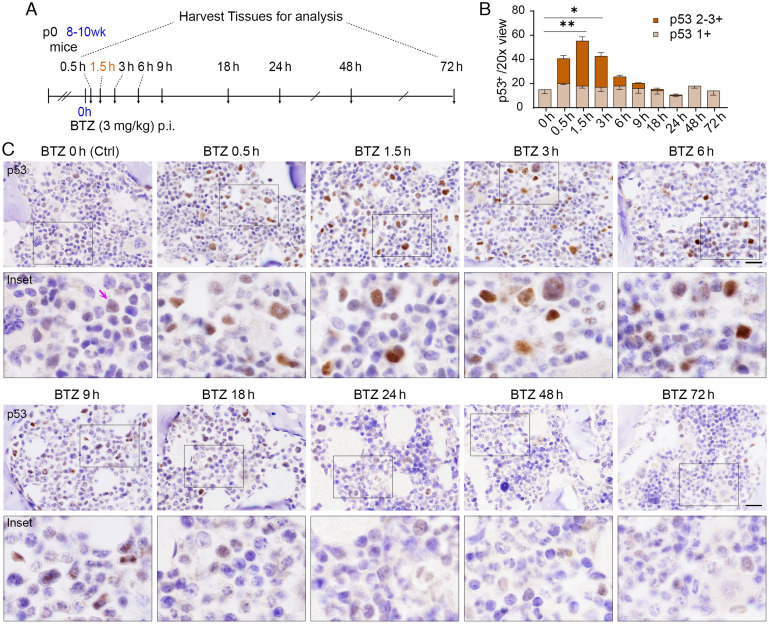
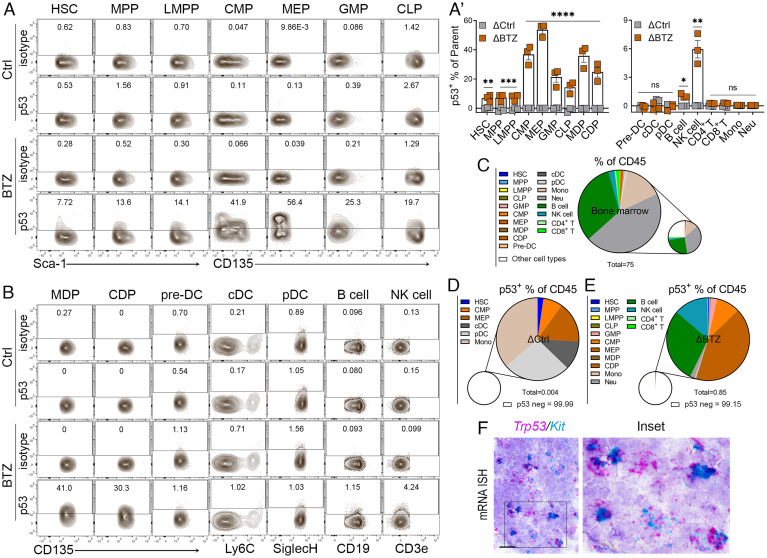
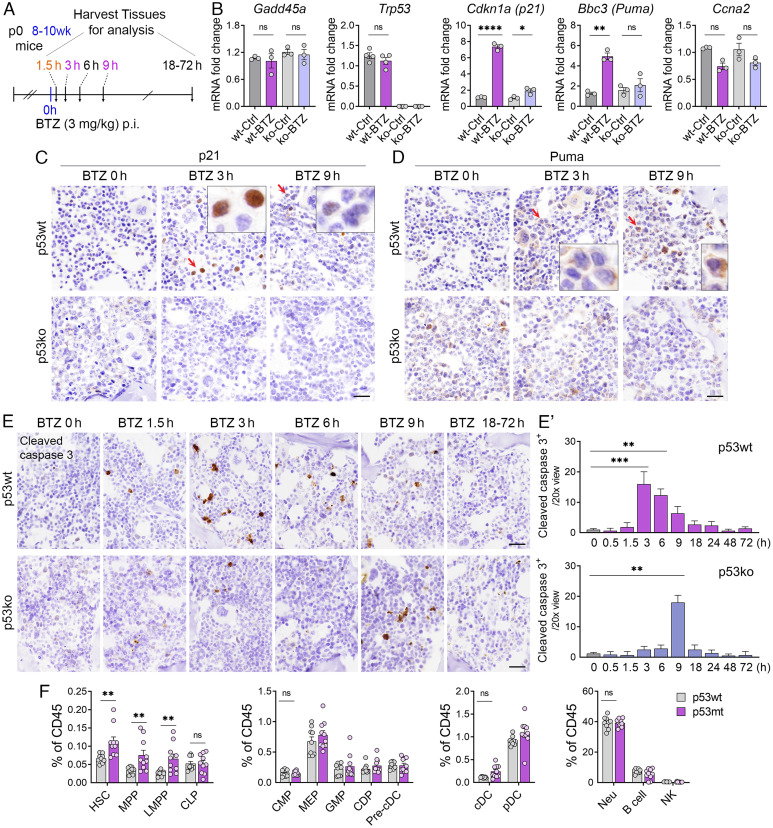
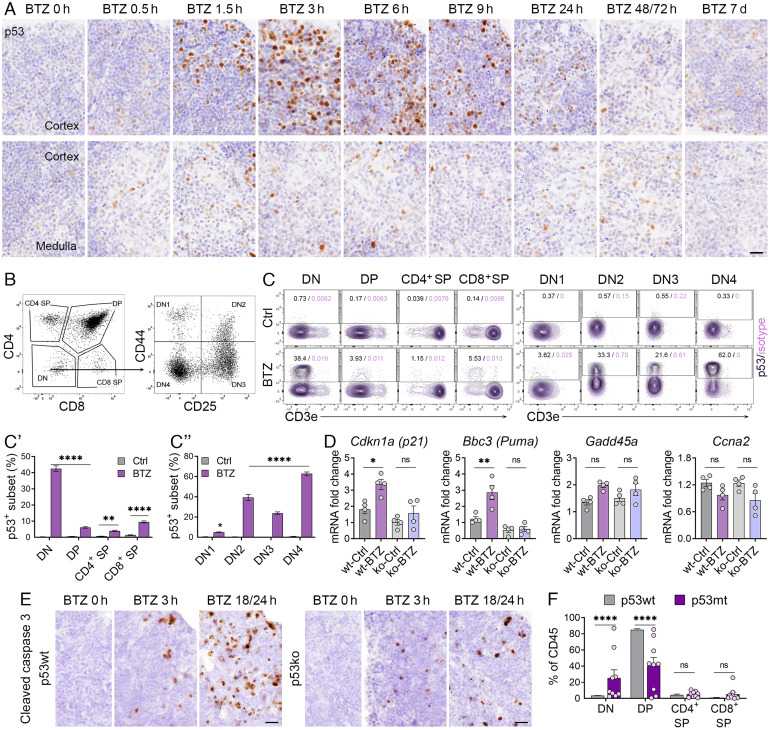
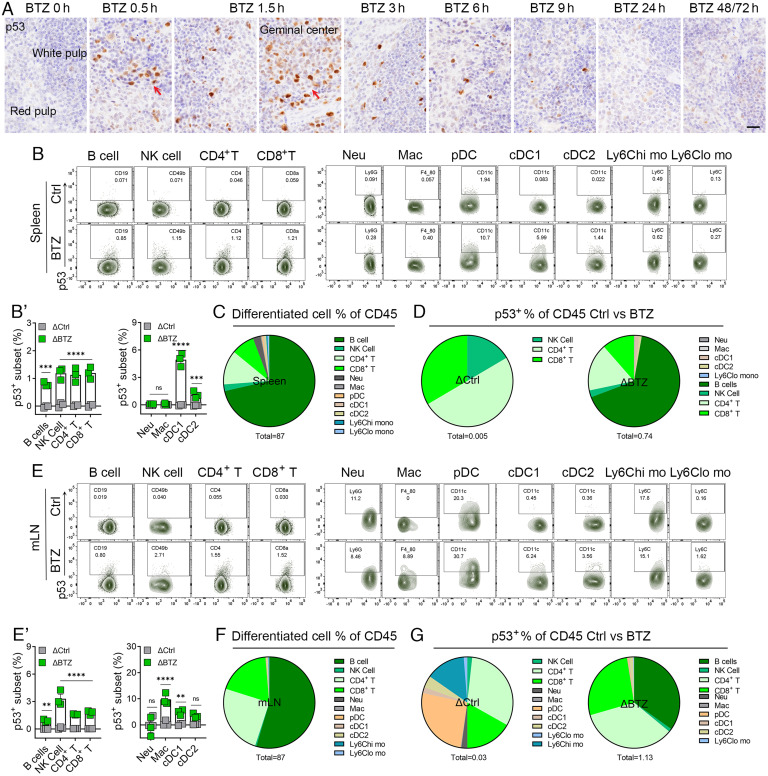
We have previously shown that proteasome inhibitor bortezomib stabilizes p53 in stem and progenitor cells within gastrointestinal tissues. Here, we characterize the effect of bortezomib treatment on primary and secondary lymphoid tissues in mice. We find that bortezomib stabilizes p53 in significant fractions of hematopoietic stem and progenitor cells in the bone marrow, including common lymphoid and myeloid progenitors, granulocyte-monocyte progenitors, and dendritic cell progenitors. The stabilization of p53 is also observed in multipotent progenitors and hematopoietic stem cells, albeit at lower frequencies. In the thymus, bortezomib stabilizes p53 in CD4-CD8- T cells. Although there is less p53 stabilization in secondary lymphoid organs, cells in the germinal center of the spleen and Peyer's patch accumulate p53 in response to bortezomib. Bortezomib induces the upregulation of p53 target genes and p53 dependent/independent apoptosis in the bone marrow and thymus, suggesting that cells in these organs are robustly affected by proteasome inhibition. Comparative analysis of cell percentages in the bone marrow indicates expanded stem and multipotent progenitor pools in p53R172H mutant mice compared with p53 wild-type mice, suggesting a critical role for p53 in regulating the development and maturation of hematopoietic cells in the bone marrow. We propose that progenitors along the hematopoietic differentiation pathway express relatively high levels of p53 protein, which under steady-state conditions is constantly degraded by Mdm2 E3 ligase; however, these cells rapidly respond to stress to regulate stem cell renewal and consequently maintain the genomic integrity of hematopoietic stem/progenitor cell populations.

Keywords: T cells; bortezomib; cancer; hematopoietic; p53.


Conflict of interest statement

The authors declare no competing interest.

Figures

Fig. 1.
Fig. 1.
Time course for the stabilization of p53 by bortezomib in mouse bone marrow. (A) The schedule of bortezomib (BTZ) time course experiments (n = 3 to 4). p0, neonatal; wk, week, h, hour; p.i., intraperitoneal injection. (B) Quantification of p53-positive frequencies at various time points from mice treated with vehicle (BTZ 0 h) or BTZ. Moderate and strong p53 staining signals are classified as p53 2-3+ (in brown), mild p53 staining signals are classified as p53 1+ (in light brown). The indicated P values were calculated by multiple unpaired t tests using Prism. *P < 0.05; **P < 0.001. Error bars represent the mean (SEM) for each group. (C) IHC analysis of p53 in bone marrow from mice at indicated time points after 3 mg/kg BTZ treatment. Purple arrow points to detectable p53 in cells treated with vehicle, indicating high p53 activity in the bone marrow. (Scale bars, 20 μm.)
Fig. 2.
Fig. 2.
Stabilization of p53 in the HSPCs of mouse bone marrow by bortezomib. (A) Representative fluorescence-activated cell sorting (FACS) plots showing bone marrow cells stained for p53 or isotype controls from mice treated with Ctrl or BTZ, gated on different HSPC populations (n = 3 to 4). (A′) Quantification of p53-positive frequencies of HSPCs and mature cells from mice treated with Ctrl (in grey) or BTZ (in brown). The indicated P values were calculated by multiple unpaired t tests using Prism. *P < 0.05; **P < 0.001; ***P < 0.0001; ****P < 0.0001; ns, no significance. The error bars represent the mean (SEM) for each group. (B) Representative FACS plots showing the bone marrow cells stained for p53 or isotype control from mice treated with Ctrl or BTZ, gated on DC progenitors/precursors, matured DC and B/NK cells (n = 3 to 4). (C) Quantification of frequencies of various CD45+ HSPCs and mature cells from mice treated with Ctrl only. (D and E) Quantification of frequencies of p53+ in HSPCs and mature cells of CD45+ bone marrow cells from mice treated with Ctrl and BTZ. ΔCtrl and ΔBTZ were calculated to remove nonspecific staining (Δ = p53+ frequency − isotype+ frequencies). Note: 0.004% of CD45+ cells in Ctrl mice and 0.85% of CD45+ cells in BTZ-treated mice positive for p53, whereas 99.99%, and 99.15% CD45+ cells in Ctrl and BTZ-treated mice are p53 negative. (F) Duplex mRNA ISH analysis of Trp53/Kit in the bone marrow of p53 wild-type mice. (Scale bars, 20 μm.)
Fig. 3.
Fig. 3.
p53 target gene expression and apoptosis induction in bone marrow following bortezomib treatment. (A) The schedule of bortezomib (BTZ) experiments for detecting p53 target gene and apoptotic induction (n = 3 to 4). p0, neonatal; wk, week, h, hour; p.i., intraperitoneal injection. (B) qRT-PCR analysis of Cdkn1a, Puma, Gadd45a, Trp53, and Ccna2 expression in the bone marrow of p53wt and p53ko mice treated with BTZ (3 mg/kg, 3 h). (C and D) IHC analysis of p21 and Puma in the bone marrow from mice at indicated time points after vehicle (BTZ 0 h) or 3 mg/kg BTZ treatment. (Scale bars, 20 μm.) (E and E′) IHC analysis and quantification of the expression of cleaved caspase 3 in the bone marrow of p53wt and p53ko mice at indicated time points post vehicle (BTZ 0 h) or 3 mg/kg BTZ treatment (n = 3 to 4). (Scale bars, 20 μm.) (F) Quantification of the frequencies of HSPCs and various mature cells in the bone marrow from p53wt and p53mt mice (n = 9 to 10). For B, the indicated P values were calculated by two-way ANOVA using Prism. For C′ and D, the indicated P values were calculated using multiple unpaired t tests using Prism. *P < 0.05; **P < 0.001; ***P < 0.0001; ****P < 0.00001, ns, no significance. The error bars represent the mean (SEM) for each group.
Fig. 4.
Fig. 4.
Stabilization of p53 in the thymus by bortezomib. (A) IHC analysis of p53 levels in the thymus from mice at indicated time points post vehicle or 3 mg/kg BTZ treatment. Upper panel: thymus cortex. Bottom panel: thymus medulla or medulla/cortex region (n = 3 to 4). (Scale bars, 20 μm.) (B) Gating strategy for analyzing thymocytes based on expression of CD4 and CD8, and DN subsets based on expression of CD44 and CD25. (C) Representative FACS plots of p53-positive subsets in various T cell development stages and the DN subsets. (C′ and C″) Quantification of the frequency of p53+ subsets in respective parent cell populations. (D) qRT-PCR analysis of Cdkn1a, Puma, Gadd45a, Trp53, and Ccna2 expression in the thymus of p53wt and p53ko mice treated with BTZ (3 mg/kg, 3 h). (E) IHC analysis of the expression of cleaved caspase 3 in the thymus of p53wt and p53ko mice at indicated time points post vehicle (BTZ 0 h) or 3 mg/kg BTZ treatment (n = 3 to 4). (Scale bars, 20 μm.) (F) Quantification of the frequencies of various T cell subsets in the thymus from p53wt and p53mt mice (n = 7 to 9). For C′, C″, and F, the indicated P values were calculated by multiple unpaired t tests of using Prism; For D, the indicated P values were calculated by two-way ANOVA using Prism; *P < 0.05; **P < 0.001; ***P < 0.0001; ****P < 0.00001; ns, no significance. Error bars, mean (SEM) for each group.
Fig. 5.
Fig. 5.
Stabilization of p53 in the spleen and lymph node by bortezomib. (A) IHC analysis of p53 levels in the spleen from mice at indicated time points post vehicle control (Ctrl, BTZ 0 h) or 3 mg/kg BTZ treatment. Red arrows point to the germinal center. (Scale bars, 20 μm.) (B) Representative FACS plots showing the splenocytes stained for p53 from mice treated with Ctrl or BTZ for 1.5 h, gated on matured lymphoid and myeloid cells. (B′) Quantification of p53+ subsets of the indicated splenocytes from mice treated with Ctrl (in grey) or BTZ (in green). (C) Quantification of frequencies of various splenocytes of CD45+ cells from mice treated with Ctrl. 87% of the total CD45+ population was analyzed. (D) Quantification of frequencies of p53+ in splenocytes of CD45+ cells from mice treated with Ctrl and BTZ. ΔCtrl and ΔBTZ were calculated to exclude nonspecific staining (Δ = p53+ frequency − isotype+ frequencies). (E) Representative FACS plots showing staining for p53 in mLN cells from mice treated with Ctrl or BTZ for 1.5 h, gated on matured lymphoid and myeloid cells. (E′) Quantification of p53+ subsets of the indicated mLN cells from mice treated with Ctrl (in grey) or BTZ (in green). (F) Quantification of the frequencies of various CD45+ mLN cells from mice treated with Ctrl. A total of 87% CD45+ cells were analyzed. (G) Quantification of frequencies of p53+ in mLN cells of CD45+ cells from mice treated with Ctrl and BTZ. ΔCtrl and ΔBTZ were calculated to exclude nonspecific staining (Δ = p53+ frequency − isotype+ frequencies). For AG, n = 3 to 4. For B′ and E′, the indicated P values were calculated by multiple unpaired t tests using Prism. **P < 0.001; ***P < 0.0001; ****P < 0.0001; ns, no significance. The error bars represent the mean (SEM) for each group.

References

    1. Orkin S. H., Zon L. I., Hematopoiesis: An evolving paradigm for stem cell biology. Cell 132, 631–644 (2008). - PMC - PubMed
    1. Jacobsen S. E. W., Nerlov C., Haematopoiesis in the era of advanced single-cell technologies. Nat. Cell Biol. 21, 2–8 (2019). - PubMed
    1. Laurenti E., Gottgens B., From haematopoietic stem cells to complex differentiation landscapes. Nature 553, 418–426 (2018). - PMC - PubMed
    1. Chavakis T., Mitroulis I., Hajishengallis G., Hematopoietic progenitor cells as integrative hubs for adaptation to and fine-tuning of inflammation. Nat. Immunol. 20, 802–811 (2019). - PMC - PubMed
    1. Pant V., Quintas-Cardama A., Lozano G., The p53 pathway in hematopoiesis: Lessons from mouse models, implications for humans. Blood 120, 5118–5127 (2012). - PMC - PubMed

Publication types

MeSH terms

LinkOut - more resources