. 2023 Jul 21;51(13):6509-6527.
doi: 10.1093/nar/gkad150.

Induction of the alternative lengthening of telomeres pathway by trapping of proteins on DNA

Affiliations

Induction of the alternative lengthening of telomeres pathway by trapping of proteins on DNA

Anna M Rose et al. Nucleic Acids Res. .

Abstract

Telomere maintenance is a hallmark of malignant cells and allows cancers to divide indefinitely. In some cancers, this is achieved through the alternative lengthening of telomeres (ALT) pathway. Whilst loss of ATRX is a near universal feature of ALT-cancers, it is insufficient in isolation. As such, other cellular events must be necessary - but the exact nature of the secondary events has remained elusive. Here, we report that trapping of proteins (such as TOP1, TOP2A and PARP1) on DNA leads to ALT induction in cells lacking ATRX. We demonstrate that protein-trapping chemotherapeutic agents, such as etoposide, camptothecin and talazoparib, induce ALT markers specifically in ATRX-null cells. Further, we show that treatment with G4-stabilising drugs cause an increase in trapped TOP2A levels which leads to ALT induction in ATRX-null cells. This process is MUS81-endonuclease and break-induced replication dependent, suggesting that protein trapping leads to replication fork stalling, with these forks being aberrantly processed in the absence of ATRX. Finally, we show ALT-positive cells harbour a higher load of genome-wide trapped proteins, such as TOP1, and knockdown of TOP1 reduced ALT activity. Taken together, these findings suggest that protein trapping is a fundamental driving force behind ALT-biology in ATRX-deficient malignancies.

Plain language summary

A key feature of all cancer cells is their ability to divide indefinitely, and this is dependent on circumvention of telomere shortening through induction of a telomere maintenance mechanism, such as the telomerase-independent, Alternative Lengthening of Telomeres (ALT) pathway. The ALT pathway is characterised by loss of the ATRX chromatin remodeler. The current study provides evidence that, in the absence of ATRX, increased trapping of proteins on DNA leads to replication fork stalling and collapse. At telomeres, this leads to ALT pathway activity. These results help to better understand ALT tumours and might, eventually, be instrumental in developing new therapeutic strategies.


Figures

Graphical Abstract
Graphical Abstract
In the context of ATRX/DAXX loss, chemotherapeutic agents which trap proteins on DNA lead to replication fork collapse, MUS81 cleavage and induction of the ALT pathway (Created with Biorender.com).
Figure 1.
Figure 1.
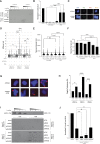
Treatment with PDS in combination with ATRX loss triggers ALT markers. (A) Representative C-circle blot showing C-circle accumulation specifically in ATRX knockout clones following 48h treatment with 5 μM PDS. The left three columns are reactions in the presence of phi polymerase while the right three columns are a no phi polymerase negative control. Ratios indicate the samples were loaded in two-fold serial dilutions. U2OS is loaded as a positive control. (B) Quantification of (A), three biological replicates run in triplicate. **** P< 0.0001, one-way ANOVA with Welch correction. (C) Representative images of APB induction in HeLa LT ATRX knockout clones upon 48h treatment with 5 μM PDS. (D) Quantification of (C), with and without siTOP2A knockdown, >200 nuclei analysed across 3 biological replicates. * P< 0.05, ** P< 0.01, *** P< 0.001, **** P< 0.0001, Kruskall–Wallis test. (E) Telomere intensity in HeLa LT ATRX knockout clones upon 48h treatment with 5 μM PDS. >200 nuclei analysed across three biological replicates. Foci considered intense are shown above dotted line 1500 A.U. **** P< 0.0001, one-way ANOVA with Welch correction. (F) Telomere foci per nuclei in HeLa LT ATRX knockout clones upon 48 h treatment with 5 μM PDS, >200 nuclei analysed across three biological replicates. **** P< 0.0001, one-way ANOVA with Welch correction. (G) Representative images of metaphase spreads stained with a telomere FISH probe in untreated and 5 μM PDS treated cells for 24 h. (H) Quantification of (G). Fragile telomeres were scored when multiple signals were seen that were spatially separated from chromatid ends. >100 metaphases analysed across two biological replicates. *** P< 0.001, **** P< 0.0001, chi-squared test from 2 × 2 contingency. (I) Representative C-circle blot showing that knockdown of BIR machinery prevents induction of C-circles in ATRX knockout cells treated with 5 μM PDS. (J) Quantification of (I), two biological replicates run in triplicate. ** P< 0.01, one-way ANOVA with Welch correction.
Figure 2.
Figure 2.
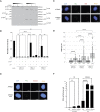
PDS and ETO lead to ALT induction in combination with ATRX loss through TOP2A trapping. (A) Representative image of C-circle blot of cells treated with 5 μM PDS for 48 h with and without siTOP2A knockdown. (B) Quantification of (A), two biological replicates run in triplicate. * P < 0.05, ** P < 0.01, *** P < 0.001, **** P < 0.0001, one-way ANOVA with Welch correction. (C) Representative image of C-circle blot of cells treated with 0.5 μM ETO for 48 h with and without siTOP2A knockdown. (D) Quantification of (C), two biological replicates run in triplicate. *** P < 0.0001, **** P < 0.0001, one-way ANOVA with Welch correction. (E) Representative immunofluorescence images of APB induction in HeLa LT ATRX knockout clones upon 48h treatment with 0.5 μM ETO. (F) Quantification of (E), >200 nuclei analysed across three biological replicates, *** P < 0.001, **** P < 0.0001, Kruskall–Wallis test. (G) Representative RPA ssTel immunoFISH images in HeLa LT ATRX knockout cells treated with 0.5 μM ETO for 48 h. (H) Quantification of RPA ssTel foci, >150 nuclei analysed across three biological replicates. * P < 0.05, ** P < 0.01, **** P < 0.0001, one-way ANOVA with Welch correction.
Figure 3.
Figure 3.
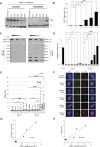
CPT leads to ALT induction in combination with ATRX loss through TOP1 trapping. (A) Representative image of C-circle blot of cells treated with 50 nM CPT for 48 h with and without siTOP1 knockdown. (B) Quantification of (A), three biological replicates run in triplicate. ** P < 0.01, *** P < 0.001, **** P < 0.0001, one-way ANOVA with Welch correction. (C) Representative immunofluorescence images of APB induction in HeLa LT ATRX knockout clones upon 48h treatment with 50 nM CPT. (D) Quantification of (C), >200 nuclei analysed across three biological replicates. *** P< 0.001, **** P< 0.0001, Kruskall–Wallis test. (E) Representative RPA ssTel immunoFISH images in HeLa LT ATRX knockout cells treated with 50 nM CPT for 48 h. (F) Quantification of (E), >150 nuclei analysed across 3 biological replicates. **** P < 0.0001, one-way ANOVA with Welch correction.
Figure 4.
Figure 4.
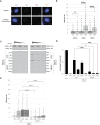
Trapping PARPi leads to ALT induction in combination with ATRX loss. (A) Representative immunoblot showing nuclear and chromatin bound fractions of HeLa LT ATRXΔ1 cells treated with 5 μM of the indicated PARPi for 48 h. (B) Quantification of (A), two biological replicates. * P< 0.05, ** P < 0.01, *** P < 0.001, **** P < 0.0001, one-way ANOVA with Welch correction. (C) Representative image of C-circle blot in HeLa LT ATRX WT and ATRXΔ1 cells treated with a range of trapping and non-trapping PARPi. (D) Quantification of (C), three biological replicates run in triplicate. * P < 0.05, **** P < 0.0001, one-way ANOVA with Welch correction. (E) Representative immunoFISH images of APB induction in HeLa LT ATRX knockout clones upon 48h treatment with various PARPi. (F) Quantification of (E), >200 nuclei analysed across three biological replicates, * P < 0.05, *** P < 0.001, **** P < 0.0001, Kruskall–Wallis test. (G) Linear regression analysis between PARP1 trapping level and C-circle level with the various PARPi drugs, R2 = 0.971, P = 0.0003. (H) Linear regression analysis between PARP1 trapping level and APBs per cell with the various PARPi drugs, R2 = 0.880, P = 0.0005
Figure 5.
Figure 5.
Formaldehyde crosslinking leads to ALT induction in combination with ATRX loss and induction of ALT is dependent on MUS81. (A) Representative immunofluorescence images of APB induction in HeLa LT ATRX knockout clones upon 1 h treatment with 500 μM formaldehyde and 48 h recovery time. (B) Quantification of (A), >200 nuclei analysed across three biological replicates, **** P < 0.0001. (C) Representative C-circle blot showing induction of C-circles upon ATRX loss and CPT/ETO/Niraparib treatment is dependent on MUS81. (D) Quantification of (C), three biological replicates run in triplicate. * P < 0.05, **** P < 0.0001. (E) Quantification of APB induction in HeLa LT ATRX knockout clones upon 48 h treatment with CPT/ETO/Niraparib in combination with siCtrl and siMUS81, >200 nuclei analysed across three biological replicates.
Figure 6.
Figure 6.
ALT cells have more trapped TOP1. (A) Quantification of immunofluorescence analysis showing increased number of Top1cc foci in HeLa cells upon CPT treatment, analysed across three biological replicates. **** P < 0.0001. (B) Quantification of immunofluorescence analysis showing increased co-localisation of TOP1cc and TRF2 in HeLa cells upon CPT treatment, analysed across 3 biological replicates. **** P < 0.0001. (C) Representative immunofluorescence images of (B) showing TOP1cc and TRF2 co-localisation. (D) Quantification of immunofluorescence analysis showing increased levels of TOP1cc foci in the ALT+ cell line SW26 versus the ALT– cell line, >200 nuclei analysed across three biological replicates. **** P< 0.0001. (E) Representative immunofluorescence images of (D) showing TOP1cc foci. (F) Quantification of immunofluorescence analysis showing generally increased levels of TOP1cc foci in ALT+ cell lines versus ALT–, analysed across two biological replicates. (G) Representative C-circle assay and quantification of U2OS cells treated with siCtrl and siTOP1, three biological replicates run in triplicate, * P < 0.05, unpaired t-test. (H) Quantification of APBs in U2OS cells treated with siCtrl, siTOP1 and shTOP1, >200 cell analysed across three biological replicates. *** P< 0.001, **** P< 0.0001, Kruskall–Wallis test. (I) Proposed model of ALT induction. Proteins, such as TOP1, TOP2A and PARP1 become trapped at telomeres, potentially by non-canonical secondary structures such as G4s and R-loops, leading to fork stalling. In the presence of ATRX, forks are protected and can be repaired and restarted (top panel). In the absence of ATRX (bottom panel), forks are no longer protected, leading to excessive nucleolytic degradation, cleavage by the MUS81 structure-specific endonuclease and fork collapse and subsequent BIR.

References

    1. de Lange T. Shelterin-mediated telomere protection. Annu. Rev. Genet. 2018; 52:223–247. - PubMed
    1. Heaphy C.M., Subhawong A.P., Hong S.M., Goggins M.G., Montgomery E.A., Gabrielson E., Netto G.J., Epstein J.I., Lotan T.L., Westra W.H.et al. .. Prevalence of the alternative lengthening of telomeres telomere maintenance mechanism in human cancer subtypes. Am. J. Pathol. 2011; 179:1608–1615. - PMC - PubMed
    1. Dilley R.L., Verma P., Cho N.W., Winters H.D., Wondisford A.R., Greenberg R.A.. Break-induced telomere synthesis underlies alternative telomere maintenance. Nature. 2016; 539:54–58. - PMC - PubMed
    1. Min J., Wright W.E., Shay J.W.. Alternative lengthening of telomeres mediated by mitotic DNA synthesis engages break-induced replication processes. Mol. Cell. Biol. 2017; 37:e00226-17. - PMC - PubMed
    1. Roumelioti F.M., Sotiriou S.K., Katsini V., Chiourea M., Halazonetis T.D., Gagos S.. Alternative lengthening of human telomeres is a conservative DNA replication process with features of break-induced replication. EMBO Rep. 2016; 17:1731–1737. - PMC - PubMed

Publication types