. 2023 Mar 21;14(1):1551.
doi: 10.1038/s41467-023-37015-9.

Single-cell transcriptomics uncovers a non-autonomous Tbx1-dependent genetic program controlling cardiac neural crest cell development

Affiliations

Single-cell transcriptomics uncovers a non-autonomous Tbx1-dependent genetic program controlling cardiac neural crest cell development

Christopher De Bono et al. Nat Commun. .

Abstract

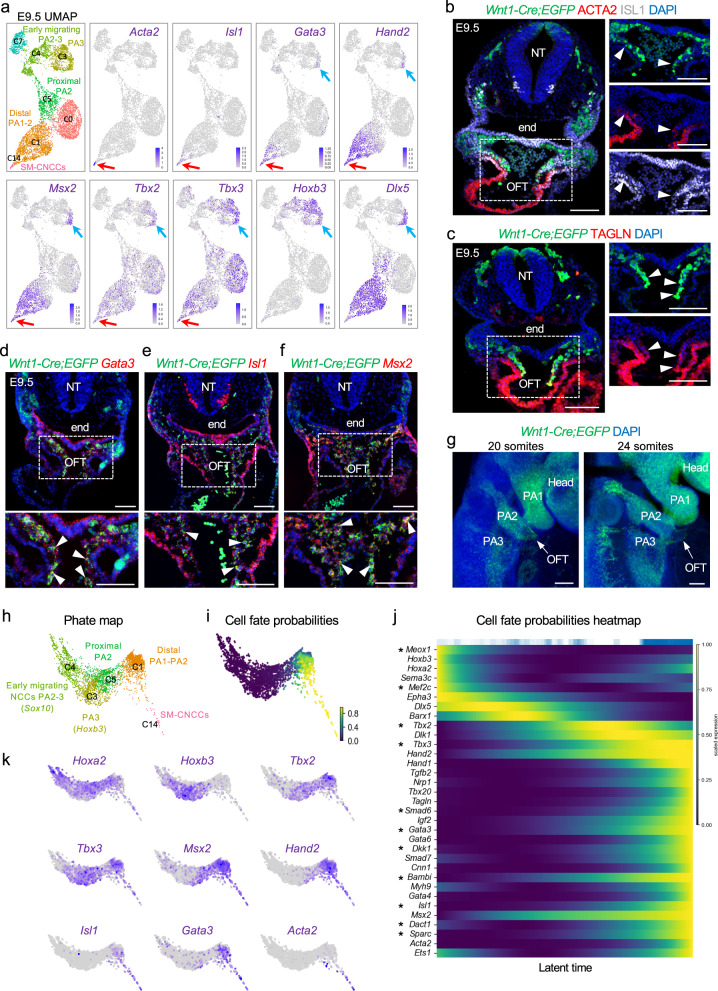
Disruption of cardiac neural crest cells (CNCCs) results in congenital heart disease, yet we do not understand the cell fate dynamics as these cells differentiate to vascular smooth muscle cells. Here we performed single-cell RNA-sequencing of NCCs from the pharyngeal apparatus with the heart in control mouse embryos and when Tbx1, the gene for 22q11.2 deletion syndrome, is inactivated. We uncover three dynamic transitions of pharyngeal NCCs expressing Tbx2 and Tbx3 through differentiated CNCCs expressing cardiac transcription factors with smooth muscle genes. These transitions are altered non-autonomously by loss of Tbx1. Further, inactivation of Tbx2 and Tbx3 in early CNCCs results in aortic arch branching defects due to failed smooth muscle differentiation. Loss of Tbx1 interrupts mesoderm to CNCC cell-cell communication with upregulation and premature activation of BMP signaling and reduced MAPK signaling, as well as alteration of other signaling, and failed dynamic transitions of CNCCs leading to disruption of aortic arch artery formation and cardiac outflow tract septation.


Conflict of interest statement

The authors declare no competing interests.

Figures

Fig. 1
Fig. 1. Single-cell RNA-seq of NCCs from mouse embryos at E8.5-E10.5 reveals transcriptional heterogeneity within the pharyngeal region.
ac Wnt1-Cre;ROSA-EGFP genetic lineage tracing shows the distribution of NCCs within the pharyngeal region and outflow tract of E8.5 (a), E9.5 (b), and E10.5 (c) embryos. The region rostral to the white dotted line of the embryo at E8.5 (a) and the pharyngeal region between the dotted lines in embryos at E9.5 and E10.5, including the heart were microdissected and EGFP-positive NCCs were used for scRNA-seq. df Seurat UMAP (Uniform Manifold Approximation and Projection) plots with cluster annotations of scRNA-seq data of NCCs at E8.5 (d), E9.5 (e), and E10.5 (f). gi Expression of genes at E8.5 (g), E9.5 (h), and E10.5 (i) with highest expression in blue and lowest expression in gray. jl Wholemount RNAscope in situ hybridization of Wnt1-Cre;ROSA-EGFP embryos (n = 3) at E8.5 (j), E9.5 (k), and E10.5 (l) with probes for Sox10, Hoxb3, and Egfp, together and separated (colors are indicated above embryos). Twist1 expression was analyzed at E8.5, E9.5, and E10.5 and Hoxa2 was examined at E9.5 as indicated. PA pharyngeal arch, OFT outflow tract, OV otic vesicle, SM-CNCCs smooth muscle CNCCs. Scale bar: 100 μm in j, 200 μm in k, and 300 μm in l.
Fig. 2
Fig. 2. Transcriptional dynamics of cardiac NCCs at E9.5.
a UMAP plots of scRNA-seq data with genes that mark CNCCs identified by expression of Acta2, Isl1, Gata3, Hand2, Msx2, Tbx2, and Tbx3 with respect to Hoxb3 (PA3) and Dlx5 (distal PA1, 2, 3) expression (red arrows). Blue arrows show the expression of Gata3, Hand2, Msx2, Tbx2, and Tbx3 in the distal part of PA3. b, c Immunostaining on traverse sections through Wnt1-Cre;ROSA-EGFP embryos showing Cre-activated EGFP (green), ACTA2, TAGLN, and ISL1 protein expression. Nuclei (blue) are labeled with DAPI. White arrowheads indicate CNCCs expressing ACTA2 and ISL1 (n = 3) (b) and CNCCs expressing TAGLN (n = 3) (c) in the OFT. df RNAscope analysis of Wnt1-Cre;ROSA-EGFP embryos for Egfp, Gata3 (d) (n = 3), Isl1 (e) (n = 3), and Msx2 (f) (n = 4) expression. Nuclei (blue) are labeled with DAPI. Arrowheads indicate the expression of Gata3, Isl1, and Msx2 in CNCCs within the OFT. g Wholemount RNAscope analysis of Wnt1-Cre;ROSA-EGFP embryos at 20 and 24 somites where the position of the OFT is indicated (white arrowhead). h PHATE (potential of heat-diffusion for affinity-based transition embedding) map of NCCs in clusters C1, C3, C4, C5, and C14 using Louvain clustering. i PHATE map colored by cell fate probabilities, showing how each cell is likely to transition to SM-CNCCs as defined by CellRank software (yellow represents high cell fate probabilities). j Heatmap from CellRank showing the expression of marker genes whose expression correlates with cardiac fate probabilities as latent time, with cells order by fate probabilities as latent time (see Supplementary Data 4 for a full list of genes), Asterisk (*) indicates newly identified genes connected to CNCCs. k PHATE maps with an expression of marker genes of CNCCs at different states of differentiation towards smooth muscle Acta2 expressing cells. NT neural tube, end endoderm, OFT outflow tract, PA pharyngeal. Scale bars: 100 μm.
Fig. 3
Fig. 3. Transcriptional dynamics of cardiac NCCs at E10.5.
a Seurat UMAP plots of scRNA-seq data from NCC populations with the expression of marker genes. b Immunostaining on traverse sections of Wnt1-Cre;ROSA-EGFP embryos (n = 3) showing GFP, ISL1, and ACTA2 expression. Nuclei stained with DAPI are in blue. ISL1 is expressed in smooth muscle cells of the OFT cushions (arrowheads). ce RNAscope in situ hybridization sections of Wnt1-Cre;ROSA-EGFP embryos for Egfp, Isl1 and Gata3 (c) (n = 5), Egfp, Cnn1 (d) (n = 3), Egfp and Rgs5 (e) (n = 3) expression. Nuclei stained with DAPI are in blue. Isl1 and Gata3 are expressed in NCCs within the OFT (white arrowheads in c) and at the level of the dorsal aortic sac wall and aortic sac protrusion (blue arrowheads in c). Gata3 but not Isl1 is expressed in the more proximal part of OFT (red arrowheads in c). Cnn1 and Rgs5 are expressed in smooth muscle cells of the OFT (white arrowheads in d and e). f Immunostaining on sections of Wnt1-Cre;ROSA-EGFP embryos (n = 3) showing GFP, TBX2, and TAGLN expression. Expression of TAGLN is in smooth muscle cells of the OFT (blue arrowheads) and PAAs expressing TBX2 (white arrowheads). gi RNAscope in situ hybridization on traverse sections of Wnt1-Cre;ROSA-EGFP embryos for Egfp, Tbx2 (n = 5) and Gata3 (n = 4) (g), Egfp and Tbx2 (h) (n = 5), and Egfp and Tbx3 (i) (n = 5) expression. Nuclei stained with DAPI are in blue. Tbx2 and Gata3 expression overlaps in the dorsal wall of the OFT (white arrowheads in g). Tbx2 and Tbx3 are expressed in the mesenchyme dorsal to the aorta surrounding the PAAs at the level of the PA3-6 (white arrowheads in h and i). j Schematic representation of a transverse section at the level of the OFT summarizing Tbx2, Tbx3, Isl1, Gata3, Acta2, and Tagln expression in CNCCs at E10.5. NT neural tube, end endoderm, PAA pharyngeal arch artery. Scale bars: 100 μm.
Fig. 4
Fig. 4. Identification of transition genes and their function at E10.5.
a CellRank UMAP plot directed by RNA velocity and cell-cell similarity for clusters C2, C3, C4, and C10 from the feature plot in Fig. 3a. b UMAP plot for cell fate probabilities of CNCCs differentiating towards smooth muscle cells. c Directed PAGA plot of NCCs. Pie charts show summarized fate probabilities of individual clusters, with blue representing the proportion of cells in each cluster with high probability to become smooth muscle CNCCs of a cluster, C10. d Heatmap from CellRank showing the expression of selected genes whose expression correlates with transitions of CNCCs fate probabilities, with cells ordered by smooth muscle fate probabilities as latent time (see Supplementary Data 5 for a full list of genes), Asterisk (*) marks newly identified genes connected to CNCCs. e UMAP plots showing expression of marker genes in CNCCs. f GO enrichment analysis of four groups of genes between Bmp4 and Gata6 (defined by their pseudotime; Supplementary Data 6). Example of genes for each selected GO: biological processes are provided. The size of the dots indicates the adjusted p value by Bonferroni and Hochberg correction (Hypergeometric test); adjusted p value are indicated in Supplementary Data 6.
Fig. 5
Fig. 5. Tbx2 and Tbx3 are required together for aortic arch artery and arterial branching from the aortic arch.
ac Intracardiac ink injection of control (a) (n = 3) and Wnt1-Cre;Tbx2f/f;Tbx3f/f conditional null mutant embryos at E15.5 (b, c) (n = 3). Panel b shows a double Tbx2/Tbx3 cKO embryo with an aberrant retro-esophageal right subclavian artery (ARSA). dl Hematotoxin and Eosin staining on traverse sections of control (d, f) (n = 18) and Tbx2/Tbx3 cKO mutant embryos (gl) (n = 9) at E15.5. Scale bars: 300 μm. Panels g and h show a Tbx2/3 cKO embryo with ARSA and panels j and k show a Tbx2/3 cKO embryo with a normal right subclavian artery. Panel i shows a Tbx2/3 cKO embryo with aortic arch hypoplasia and panel l shows a Tbx2/3 cKO embryo with a normal aortic arch as compared with control embryos (f). m Table of the cardiovascular defects in Tbx2/Tbx3 conditional mutants. ARSA was identified in 5/13 Tbx2/3 cKO embryos: one after intracardiac ink injection, three after H&E histology, and one by anatomic analysis after micro-dissection. Aortic arch hypoplasia was found in 2/8 Tbx2/3 cKO embryos after H&E histology. nq Immunofluorescence on coronal sections of controls at E11.5 (n) (n = 8) and Tbx2/3 cKO embryos (oq) (n = 8), at the level of the pharyngeal arch arteries for GFP and ACTA2 expression. Nuclei are stained with DAPI. Scale bars: 100 μm. The bottom panels are a high magnification of the dashed regions in nq. Note the strong reduction of ACTA2 expression, ranging from almost total absence to low-level expression, in the right and left fourth PAAs in Tbx2/3 conditional mutant embryos compared to control embryos (white arrowheads). RSA right subclavian artery, RCC right common carotid, LCC left common carotid, BA brachiocephalic artery, Ao aorta, AoA aortic arch, LSA left subclavian artery, PT pulmonary trunk, E esophagus, PAA pharyngeal arch artery.
Fig. 6
Fig. 6. Upregulation of the BMP pathway and downregulation of the MAPK pathway by inactivation of Tbx1 at E9.5.
a Wnt1-Cre;ROSA-EGFP lineage tracing (green) shows mis-localization and a reduced number of NCCs within the pharyngeal region of Tbx1 null embryos (red arrow) (n = 10). DAPI is in blue. NCCs from the region between the two dashed lines were used for scRNA-seq. b RISC UMAP plot of integrated scRNA-seq data from NCCs of control and Tbx1 null embryos. c UMAP plots colored by clusters from control (left) and Tbx1 null embryos (right). d Stack bar graph shows proportions of NCCs in indicated clusters divided by the total number of cells in control or Tbx1 null embryos. A two-sided proportion z-test was used to evaluate cell proportion differences between control and Tbx1 null embryos (cluster C3: p value = 1.14e-56; C4: p value = 9.24e-15; C5: p value = 1.46e-8; C8: p value = 1.23e-5; C9: p value = 4.32e-3; C12: p value: 0.66) (*p value <0.05; ns not significantly different). Additional information on statistical analysis is provided in the Source Data files. e, f Scatter plots show differential gene expression in cluster C8 (e) and in cluster C4 (f) from control and Tbx1 null embryos. Note the upregulation of genes involved in the BMP pathway (red) and the downregulation of genes in the MAPK pathway (purple). g Violin plots showing differential expression in control (purple) versus Tbx1 null (red) for Msx2, Bambi, Spry1, and Myc in clusters C4 and C8. PA pharyngeal arch, OV otic vesicle, OFT outflow tract. Scale bars: 100 μm.
Fig. 7
Fig. 7. BMP pathway is downregulated and the MAPK pathway is upregulated in pharyngeal NCCs of Tbx1 null embryos at E9.5.
a UMAP plots show the expression level (purple) of Msx2 and Spry1 in NCCs split by control and Tbx1 null embryos. b Wholemount immunostaining through Wnt1-Cre;ROSA-EGFP control (n = 7) and Tbx1 null embryos (n = 5) for GFP (green) and phospho-ERK (pERK) (red). Digitally generated sections are shown in b. DAPI is in blue. Arrowheads show reduced expression of pERK in NCCs in the pharyngeal region of Tbx1 null embryo. c Msx2, Bambi, and Egfp wholemount RNAscope in situ hybridization with DAPI of control and Tbx1 null embryos. (Msx2 in control: n = 7, Msx2 in Tbx1 null embryos: n = 3, Bambi in control and Tbx1 null embryo: n = 3) The arrowheads indicate ectopic expression of Msx2 and Bambi in Tbx1 null embryos. d Egfp, Msx2, and Bambi RNAscope assay on transverse sections of control and Tbx1 null embryos (n = 3) showing ectopic and dorsal expression of Msx2 and Bambi in migrating NCCs (red arrowheads). Msx2 and Bambi expression is absent in the proximal part of the PA2 and PA3 of control embryos (white arrowheads). e Fluorescent immunostaining for GFP and P-SMAD1/5/9 on transverse sections of control (n = 5) and Tbx1 null (n = 4) embryos shows increase in P-SMAD1/5/9 in NCCs of PA2-3 (arrowheads). f Schematic representation of control (left) and Tbx1 null (right) sections at E9.5 showing reduced CNCCs contributing to the shortened OFT and ectopic posterior BMP signaling. PA pharyngeal arch, OFT outflow tract, NT neural tube, end endoderm, LV left ventricle. Scale bars: 100 μm.
Fig. 8
Fig. 8. Cell-cell communication from the mesoderm to NCCs is altered in the absence of Tbx1 at E9.5.
a Schematic representation of a transverse section showing signaling (arrows) from pharyngeal mesoderm cells (blue) to NCCs (yellow) in the caudal pharyngeal apparatus. b Bubble plot shows representative cell-cell signaling from Mesp1Cre derived mesodermal cells to NCCs that were significantly altered (Wilcox rank two-sided test without multiple test correction, p value indicated by the size of dot and color; right) in Tbx1 mutant embryos. Each dot represents a ligand–receptor pair interaction (Y-axis) between a specific cluster in the mesoderm cells and NCCs (X-axis). Clusters include anterior and posterior second heart fields (aSHF, pSHF) and the multilineage progenitors (MLP). c UMAP from integration of two replicates of Mesp1Cre;ROSA-EGFP (CTRL) and Mesp1Cre;Tbx1f/f;EGFP (Tbx1 cKO) datasets. d UMAP plots showing Isl1 expression in control and Tbx1 cKO cells. em UMAP plots showing the expression of ligand genes including Wnt5a (e), Wnt2 (f), Sema3c (g), Pdgfa (h), Nrg1 (i), Fgf10 (j), Edn3 (k), Bmp4 (l), and Bmp7 (m) in control and Tbx1 cKO embryos. Arrows indicate cell clusters with gene expression changes in Tbx1 cKO embryos. n Wholemount RNAscope in situ hybridization of Wnt1-Cre;ROSA-EGFP control (lefts panels) and Tbx1 null (right panels) embryos at E9.5 with probes for Egfp and Bmp4. Representative digital sections are shown on the right of 3D reconstruction pictures. Arrowheads show expression of Bmp4 in cells adjacent to the pharyngeal NCCs in Tbx1 null embryos. PA pharyngeal arch. Scale bars: 200 μm.
Fig. 9
Fig. 9. Failure of CNCC cell fate progression by loss of Tbx1 at E10.5.
a The NCCs between the dotted lines and heart in control and Tbx1 null embryos were used for scRNA-seq. b RISC UMAP plot of integrated scRNA-seq data from NCCs of two replicates of control and Tbx1 null embryos. c UMAP plots of pharyngeal and heart clusters from control (left) and Tbx1 null (right) embryos. d Stack bar graph shows proportions of NCCs in selected clusters divided by the total cell number in control or Tbx1 null replicates. A two-sided proportion z-test was used to evaluate cell proportion differences between control and Tbx1 null embryos for the two replicates separately if the two Tbx1 null show consistent increase or decrease compared to control. (*p value <0.05; ns not significantly different, see Source Data file for p value details). e UMAP plot colored by cell fate probabilities. f UMAP plots showing expression level of Tbx2, Tbx3, Isl1, Gata3, Msx2, and Dkk1 in NCCs from control or Tbx1 null embryos in pharyngeal NCC clusters. Msx2, Gata3, and Dkk1 show increased expression in cluster C4. g Violin plots showing differential expression level of Msx2, Bambi, Gata3, and Tbx2 in cluster C4 in control (purple) and Tbx1 null (red) embryos. hj GO analysis for upregulated genes in C4 (h), downregulated genes in C4 (i), and upregulated genes in C10 (j). Hypergeometric test was used, adjusted p value by Bonferroni–Hochberg correction. k Fluorescent immunostaining for GFP (green) and ISL1 (red) with DAPI (blue) on transverse sections of control (n = 4) and Tbx1 null (n = 3) embryos. There is reduced ISL1-positive NCCs (arrowheads). l Fluorescent immunostaining for GFP (green), TBX2 (red), and ACTA2 (gray) on transverse sections of control (n = 4) and Tbx1 null (n = 3) embryos, DAPI is in blue. Expression of TBX2 in NCCs is lateral to the pharyngeal endoderm (end; white arrowheads). There are fewer CNCCs expressing ACTA2 within the OFT of Tbx1 null embryos (red arrowhead). NT neural tube, end endoderm, OFT outflow tract. Scale bars: 100 μm.
Fig. 10
Fig. 10. Model of a multistep specification to form CNCCs and the signaling pathways disrupted by inactivation of Tbx1.
a Colors indicate cell fate progression of pharyngeal NCCs (light yellow) towards vascular smooth muscle cells (red). Step 1 shows the transition between pharyngeal NCCs expressing Tbx2/3 to cells expressing markers of CNCCs (CP-CNCCs). Step 2 shows the transition in which some cells directly differentiate to smooth muscle of PAA-CNCCs, while the majority migrate and enter the OFT as OFT-CNCCs and express Gata3/Isl1 and Step 3 shows the transition to SM-CNCCs expressing Acta2. The graph shows the relative change of biological gene ontology terms during the three transitions of CNCCs to smooth muscle cells. b Model of non-autonomous signaling between the mesoderm (bottom, blue) and NCCs (top, gray) highlighting FGF, WNT, and additional signaling from the mesoderm to NCCs in normal embryos (left) and how signaling is disrupted in the absence of Tbx1 (light blue arrows/inhibitory arrows; right). Alteration of signaling in the mesoderm in the absence of Tbx1 results in abnormal premature activation of the BMP pathway during NCC deployment and migration (light blue inhibitory arrow; red, up arrow), a decrease of MAPK signaling in NCCs (light blue arrow; red down arrow), and alteration of other signaling pathways including upregulation of WNT signaling in developing NCCs. This leads to failure of cardiac fate progression with a reduced number of CP-CNCCs, reduced number of CNCCs, and reduced number of SM-CNCCs (gray arrows) with aortic arch/branching defects and failed OFT septation (persistent truncus arteriosus).

References

    1. Szabo A, Mayor R. Mechanisms of neural crest migration. Annu. Rev. Genet. 2018;52:43–63. doi: 10.1146/annurev-genet-120417-031559. - DOI - PubMed
    1. Plein A, Fantin A, Ruhrberg C. Neural crest cells in cardiovascular development. Curr. Top Dev. Biol. 2015;111:183–200. doi: 10.1016/bs.ctdb.2014.11.006. - DOI - PubMed
    1. Waldo KL, et al. Cardiac neural crest is necessary for normal addition of the myocardium to the arterial pole from the secondary heart field. Dev Biol. 2005;281:66–77. doi: 10.1016/j.ydbio.2005.02.011. - DOI - PubMed
    1. Waldo K, Miyagawa-Tomita S, Kumiski D, Kirby ML. Cardiac neural crest cells provide new insight into septation of the cardiac outflow tract: aortic sac to ventricular septal closure. Dev. Biol. 1998;196:129–144. doi: 10.1006/dbio.1998.8860. - DOI - PubMed
    1. Phillips HM, et al. Neural crest cells are required for correct positioning of the developing outflow cushions and pattern the arterial valve leaflets. Cardiovasc. Res. 2013;99:452–460. doi: 10.1093/cvr/cvt132. - DOI - PMC - PubMed

Publication types