. 2023 Mar 20;14(1):1545.
doi: 10.1038/s41467-023-37035-5.

An in-solution snapshot of SARS-COV-2 main protease maturation process and inhibition

Affiliations

An in-solution snapshot of SARS-COV-2 main protease maturation process and inhibition

Gabriela Dias Noske et al. Nat Commun. .

Abstract

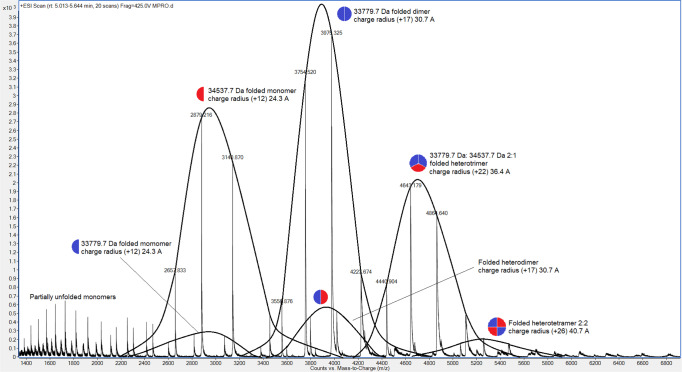
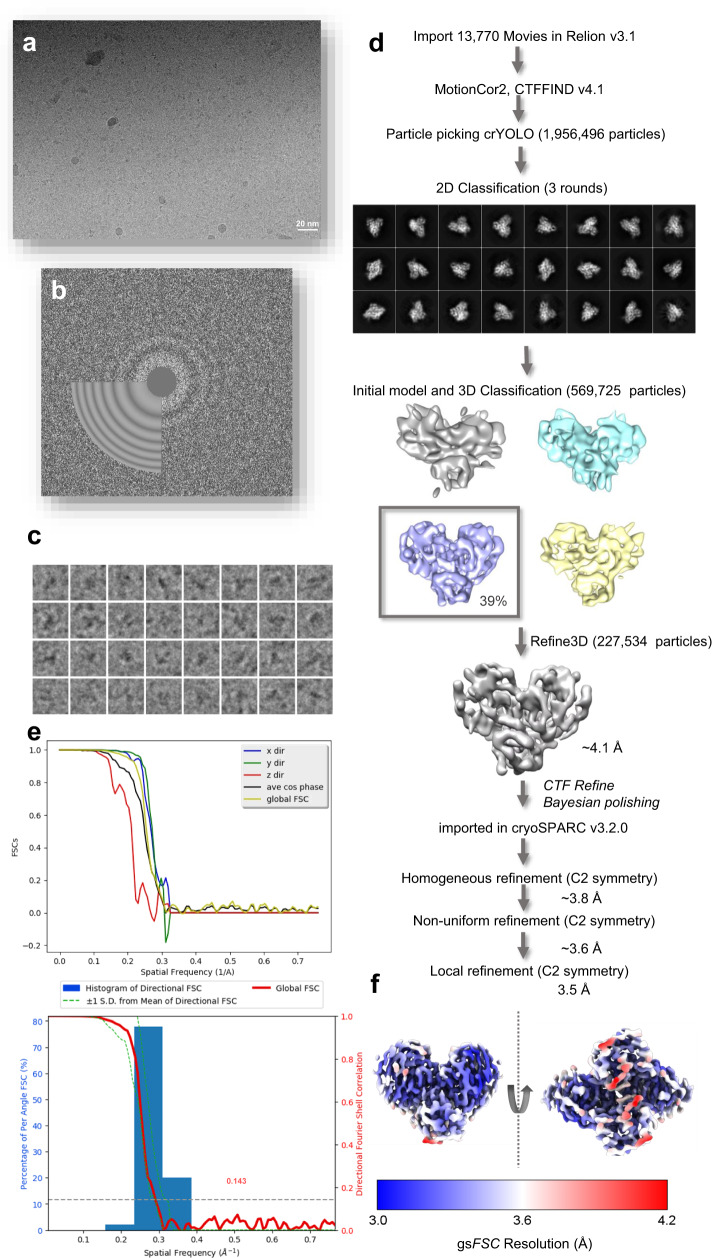
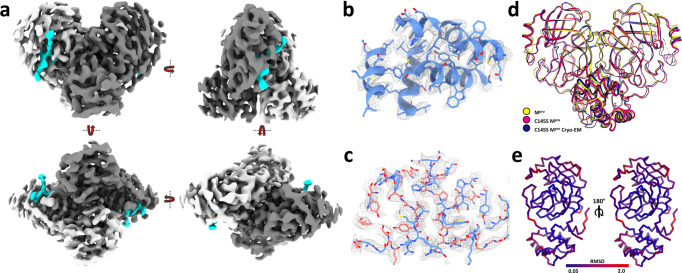
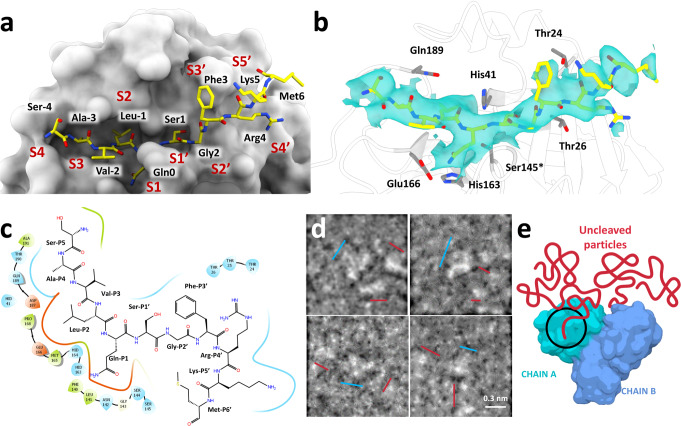
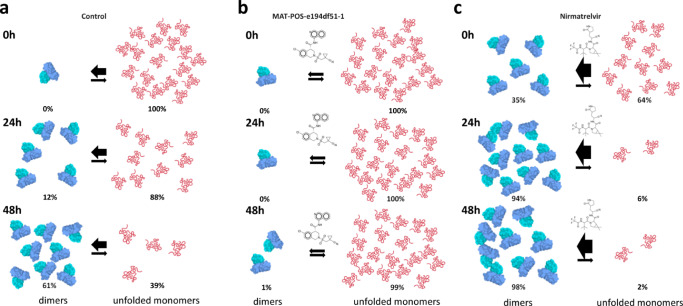
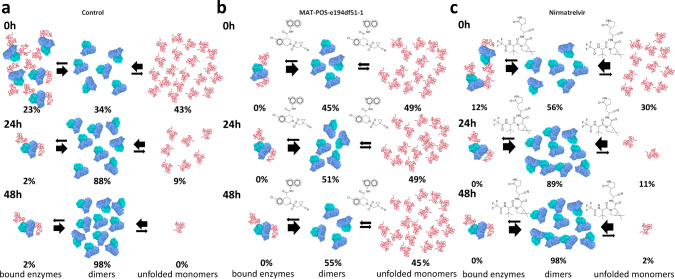
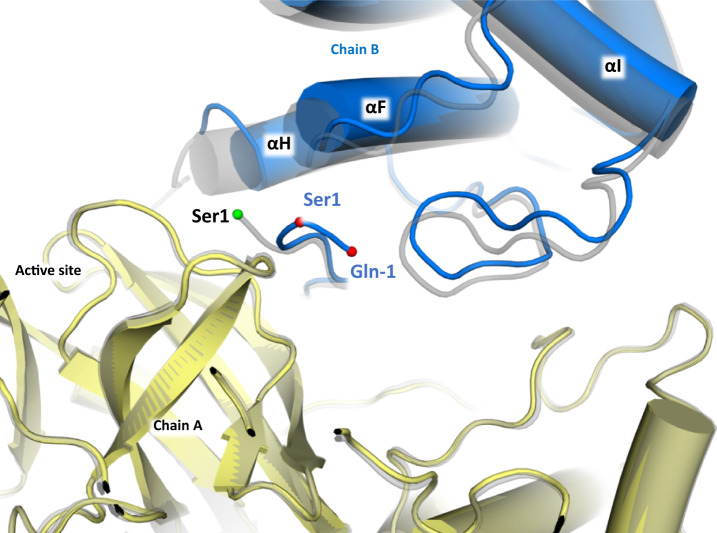
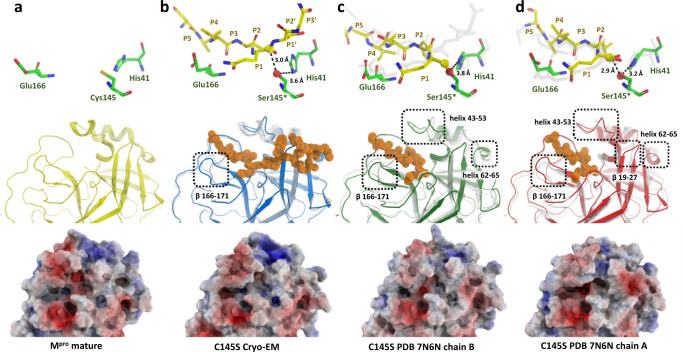
The main protease from SARS-CoV-2 (Mpro) is responsible for cleavage of the viral polyprotein. Mpro self-processing is called maturation, and it is crucial for enzyme dimerization and activity. Here we use C145S Mpro to study the structure and dynamics of N-terminal cleavage in solution. Native mass spectroscopy analysis shows that mixed oligomeric states are composed of cleaved and uncleaved particles, indicating that N-terminal processing is not critical for dimerization. A 3.5 Å cryo-EM structure provides details of Mpro N-terminal cleavage outside the constrains of crystal environment. We show that different classes of inhibitors shift the balance between oligomeric states. While non-covalent inhibitor MAT-POS-e194df51-1 prevents dimerization, the covalent inhibitor nirmatrelvir induces the conversion of monomers into dimers, even with intact N-termini. Our data indicates that the Mpro dimerization is triggered by induced fit due to covalent linkage during substrate processing rather than the N-terminal processing.


Conflict of interest statement

The authors declare no competing interests.

Figures

Fig. 1
Fig. 1. Native mass spectrometry of C145S SARS-CoV-2 Mpro.
From left to right, peaks show monomers cleaved (blue semicircle) an uncleaved (red semicircle), dimers formed by cleaved (blue circles) or half-cleaved (blue-red circle) particles, trimers formed by two cleaved and one uncleaved particles (two thirds blue, one-third red circles) and tetramers formed by two cleaved and two uncleaved particles (two-quarters blue, two-quarters red). Minor peaks of other forms are described in supplementary materials. Graphs were plotted from individual native mass spectrometry experiments.
Fig. 2
Fig. 2. Cryo-EM data processing schematic for C145S SARS-CoV-2 Mpro.
a Aligned micrographs, with scale bar at the bottom. b CTF-function calculated from obtained micrographs. c Extracted particles examples. d Detailed schematic of steps taken for final reconstruction, highlighting obtained 2D and 3D classes, and first high-resolution reconstruction. e Fourier shell correlation (FSC) between half maps of the final reconstructions. At the top, graph shows FSCs versus spatial frequency calculated in directions x (blue), y (green) and z (red). Average cos phase is in black, and global FSC is plotted in yellow. At the bottom, percentage of per angle FSC (blue) overlaid with gold standard FSC plot (red). f Local resolution projected on the final map from two orientations.
Fig. 3
Fig. 3. A. Overview of SARS-CoV-2 C145S Mpro cryo-EM model.
a Four-sides rotation view of final map displayed as surface, with chains A and B coloured in white and grey, respectively, and active site peptide map coloured in cyan. b Chain A (blue) domain III model fitted into final map (grey). c Chain A (blue) and B (salmon) interface region fitted into final cryo-EM map (grey). d Superposition of X-ray Mpro model (yellow, PDB 7KPH), X-ray SARS-CoV-2 C145S Mpro (pink, PDB 7N5Z) and SARS-CoV-2 C145S Mpro cryo-EM model (dark blue). e SARS-CoV-2 C145S Mpro cryo-EM model chain A (left) and (right) coloured according its RMSD versus X-ray model of Mpro (PDB 7KPH).
Fig. 4
Fig. 4. Detailed view on Mpro C145S peptide interaction.
a Active site view of Mpro C145S chain A surface (in grey) bound to nsp4-nsp5 peptide (yellow sticks). Subsites are denotated from S4 to S5’. b Detailed view of Mpro C145S chain A active site residues (in grey) bound to nsp4-nsp5 peptide (yellow sticks), with cryo-EM map showed as surface (contour level of 4.55). c Interaction scheme between nsp4-nsp5 peptide and Mpro C145S chain A. d Selected low-pass filtered particles, highlighting dimer particles (marked with a blue line) bound to monomeric uncleaved particles (marked with a red line). Scale bar is show at the bottom left. e Schematic representation of Mpro C145S dimer (blue) bound to uncleaved particles (red).
Fig. 5
Fig. 5. Schematic representation of in solution dynamics of SARS-CoV-2 C145S Mpro monomeric form (sample 1) analyzed with SEC-MALS.
a Control reaction containing monomers at 0 h (top), after 24 h incubation (middle) and after 48 h (bottom). b Monomers conversion reaction in presence of non-covalent inhibitor MAT-POS-e194df51-1 at 0 h (top), after 24 h incubation (middle) and after 48 h (bottom). c Monomers conversion reaction in presence of covalent inhibitor Nirmatrelvir at 0 h (top), after 24 h incubation (middle) and after 48 h (bottom).
Fig. 6
Fig. 6. Schematic representation of in solution dynamics of SARS-CoV-2 C145S Mpro tetrameric form (sample 2) analyzed with SEC-MALS.
a Control reaction containing tetramers at 0 h (top), after 24 h incubation (middle) and after 48 h (bottom). b Tetramers conversion reaction in presence of non-covalent inhibitor MAT-POS-e194df51-1 at 0 h (top), after 24 h incubation (middle) and after 48 h (bottom). c Tetramers conversion reaction in presence of covalent inhibitor Nirmatrelvir at 0 h (top), after 24 h incubation (middle) and after 48 h (bottom).
Fig. 7
Fig. 7. Cartoon model of X-ray structure of Mpro C145S bound to Nirmatrelvir, with chain A showed in yellow, and chain B showed in blue.
Ser1 and Gln-1 alpha carbons are highlighted as red spheres. Native Mpro is shown as grey transparent cartoon, with Ser1 alpha-carbon highlighted as a green sphere.
Fig. 8
Fig. 8. Active site comparison between apo and intermediary states of Mpro.
a Key active site residues (green sticks) of Mpro in apo form (top), cartoon view of active site in apo state in yellow (middle) and calculated electrostatic potential projected into surface of Mpro active site (bottom). b Key active site residues (green sticks) of Mpro C145S bound to intact peptide (top), cartoon view of active site from the respective form (middle) and calculated electrostatic potential projected of respective form (bottom). c Key active site residues (green sticks) of Mpro C145S covalently bound to cleaved peptide forming the enzyme-substrate intermediary complex (top), cartoon view of active site from the respective form (middle) and calculated electrostatic potential projected of respective form (bottom). d Key active site residues (green sticks) of Mpro C145S in complex with post-cleaved peptide (top), cartoon view of active site from the respective form (middle) and calculated electrostatic potential projected of respective form (bottom). The transparent sticks and cartoons (grey) in the top and middle figures represent the structural position from the relative elements of the previous step.

References

    1. Wu F, et al. A new coronavirus associated with human respiratory disease in China. Nature. 2020;579:265–269. doi: 10.1038/s41586-020-2008-3. - DOI - PMC - PubMed
    1. Zhu N, et al. A novel coronavirus from patients with pneumonia in China, 2019. N. Engl. J. Med. 2020;382:727–733. doi: 10.1056/NEJMoa2001017. - DOI - PMC - PubMed
    1. Bhatt PR, et al. Structural basis of ribosomal frameshifting during translation of the SARS-CoV-2 RNA genome. Science. 2021;372:1306–1313. doi: 10.1126/science.abf3546. - DOI - PMC - PubMed
    1. Osipiuk J, et al. Structure of papain-like protease from SARS-CoV-2 and its complexes with non-covalent inhibitors. Nat. Commun. 2021;12:1–9. doi: 10.1038/s41467-021-21060-3. - DOI - PMC - PubMed
    1. Zhang L, et al. Crystal structure of SARS-CoV-2 main protease provides a basis for design of improved a-ketoamide inhibitors. Science. 2020;368:409–412. doi: 10.1126/science.abb3405. - DOI - PMC - PubMed

Publication types

MeSH terms