. 2023 Mar 20;9(1):21.
doi: 10.1038/s41526-023-00247-6.

Meta-analysis of the space flight and microgravity response of the Arabidopsis plant transcriptome

Affiliations

Meta-analysis of the space flight and microgravity response of the Arabidopsis plant transcriptome

Richard Barker et al. NPJ Microgravity. .

Abstract

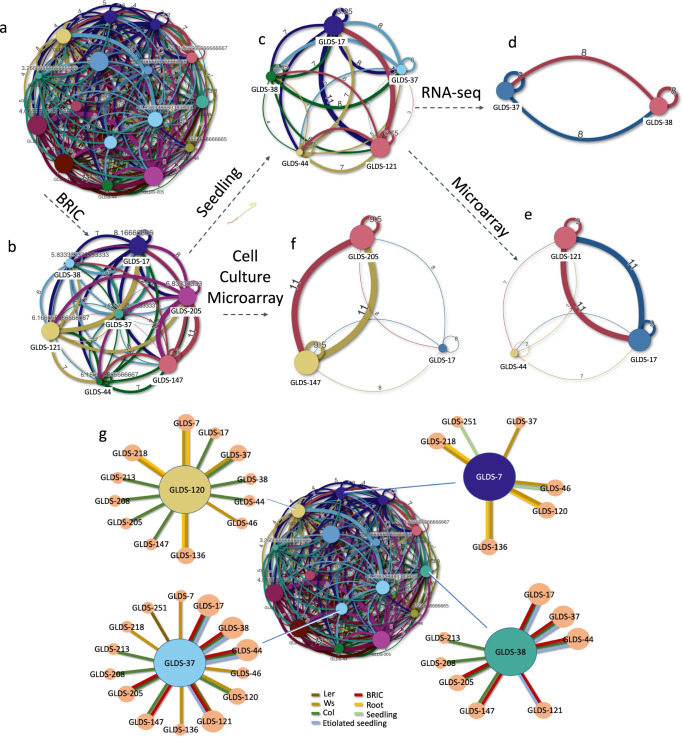
Spaceflight presents a multifaceted environment for plants, combining the effects on growth of many stressors and factors including altered gravity, the influence of experiment hardware, and increased radiation exposure. To help understand the plant response to this complex suite of factors this study compared transcriptomic analysis of 15 Arabidopsis thaliana spaceflight experiments deposited in the National Aeronautics and Space Administration's GeneLab data repository. These data were reanalyzed for genes showing significant differential expression in spaceflight versus ground controls using a single common computational pipeline for either the microarray or the RNA-seq datasets. Such a standardized approach to analysis should greatly increase the robustness of comparisons made between datasets. This analysis was coupled with extensive cross-referencing to a curated matrix of metadata associated with these experiments. Our study reveals that factors such as analysis type (i.e., microarray versus RNA-seq) or environmental and hardware conditions have important confounding effects on comparisons seeking to define plant reactions to spaceflight. The metadata matrix allows selection of studies with high similarity scores, i.e., that share multiple elements of experimental design, such as plant age or flight hardware. Comparisons between these studies then helps reduce the complexity in drawing conclusions arising from comparisons made between experiments with very different designs.


Conflict of interest statement

The authors declare no competing interests.

Figures

Fig. 1
Fig. 1. Uniform analysis pipeline applied to Arabidopsis GLDS datasets used in this study.
Normalized expression arrays are imported from NASA’s GeneLab repository (https://genelab-data.ndc.nasa.gov/genelab/projects) and then parsed by the TOAST X-Species Transcriptional Explorer (https://astrobiology.botany.wisc.edu/x-species-astrobiology-genelab) for analysis of common features between experiments (cross experiment intersect analysis). The iDEP.92 R-shiny app is then used to generate expression heatmaps for clustering, and to perform Principal Component Analysis (PCA), Multidimensional Scaling analysis (MDS), t-distributed Stochastic Neighbor Embedding (T-SNE), Weighted Gene Correlation Network Analysis (WGCNA) and K-means statistical analyses. Functional analyses are then performed using the online tools at Ensembl GO, KEGG (Kyoto Encyclopedia of Gene and Genomes), AraCyc and Reactome. These data are then visualized as tables and dendrograms of the enriched functional groups that are altered by spaceflight and/or related stimuli.
Fig. 2
Fig. 2. Principal component analysis (PCA) of the 15 plant datasets in the Matrix reveals clustering based on analystical approach (microarray versus RNA-seq) and by lighting conditions.
Principal components sperate datasets by a microarray versus RNA-seq-based analyses and b by growth in the light versus the dark environment of the growth hardware. PC1 principal component 1, PC2 principal component 2, PC3 principal component 3. Percentage reflects the degree of variance accounted for by each principal component. c Euclidian hierarchical clustering confirms grouping by assay type (microarray versus RNA-seq) as major factor within the data. Ecotypes: Col Columbia, Cvi Cape Verde Island, Ws Wassilewskija, Col-0 + Ws, mixed sample 80% Ws, and 20% Col ecotypes. Genotypes: WT wild-type, act2 actin 2, arg1 altered response to gravity 1, atm1 ataxia-telangiectasia mutated 1, hsfa2 heat shock transcription factor A2, phyD phytochrome D.
Fig. 3
Fig. 3. Pairwise factor correlation analysis creates a weighted network linking studies based on metadata similarity score.
a Whole connectivity network. Numbers and thickness of connection (network edge) reflect degree of connectivity through shared metadata factors. bf 5 sub-networks based on common BRIC hardware experiment design: b sub-network of experiments performed using the BRIC hardware (mean connectivity score: 6.3), c BRIC experiments involving seedlings (mean connectivity score: 6.0). Seedling experiments analyzed using d RNA-seq (mean connectivity score: 8) or e microarray (mean connectivity score: 7.6) and f BRIC experiments that have used cell cultures, all analyzed by microarray (mean connectivity score: 7.4). For ag size of circle for each study reflects the number of connected factors available for pairwise comparison. g Examples of connectivity of GLDS-7, GLDS-37, GLDS-38, and GLDS-120 by tissues sampled and ecotypes analyzed. Colored lines reflect factor connecting studies. Ecotypes: Col, Columbia; Ws, Wassilewskija; Ler, Landsberg. See Supplementary Data 2 for full connectivity matrix.
Fig. 4
Fig. 4. Graphical representation of metadata related to tissues, assay type and flight vehicle.
The specific assay and tissue types for each dataset are indicated with network clustering based on hardware. See Supplementary Data 1 and 2 for the Matrix driving this visualization. Note the hardware used to analyze plant response to spaceflight often defines the types of tissue that are available and so these two variables are often linked. Purple color circles represent RNAseq analysis of wild-type Col-0 plants, shades of blue represent other WT ecotypes, the pink circle represents RNA-seq analysis performed on mutants. The size of circles is a qualitative representation of the amount of differentially expressed loci relative to other genetic varieties used during that study. Ecotypes: Col Columbia, Cvi Cape Verde Island, Ws Wassilewskija, Ler Landsberg, Col-0 + Ws mixed sample 80% Ws and 20% Col ecotypes. Genotypes: WT wild-type, arg1 altered response to gravity 1, hsfa2 heat shock transcription factor A2, atm1 ataxia-telangiectasia mutated 1, phyD phytochrome D, Hardware: BRIC Biological Research in Canister, EMCS European Modular Cultivation System, VEGGIE Vegetable production system, SIMBOX SIMBOX incubator system, ABRS Advanced Biological Research System. An interactive version of this visualization is available at: https://gilroy-qlik.botany.wisc.edu/a/sense/app/20aa802b-6915-4b1a-87bd-c029a1812e2b/sheet/6241e71a-a3c5-4c63-9210-e05c743699d7/state/analysis.
Fig. 5
Fig. 5. Unguided Weighted Gene Correlation Network Analysis (WGCNA) clustering of the Arabidopsis datasets used in this study.
This analysis was performed on the DEGs identified in the RNA-seq (a) and microarray (c) datasets from the spaceflight experiments imported into the Matrix (see Table 2 for specific datasets used). This analysis identified 4 clusters of DEGs within the RNA-seq (a) and 3 clusters within the microarray analyses (c). b Overlap in the DEGs within each cluster between the WGCNA RNA-seq and microarray analyses. Purple curves link identical genes and light blue curves link genes that, although not identical, belong to the same enriched Gene Ontology term found in each clade. The inner circle represents gene lists, where hits are arranged along the arc. Genes that hit multiple clusters are colored in dark orange, and genes unique to a single cluster are shown in light orange. d List of top 20 significantly enriched Gene Ontologies drawn from the clusters of DEGs depicted in ac that are shared by 2 or more clusters. The full list of enriched Gene Ontology terms is reproduced in Supplementary Data Fig. 1. Multiple colors under the PATTERN column indicate a pathway or process that is shared across multiple microarray or RNA-seq clades as denoted by their color coding in a and c. Count number of loci included in enrichment analysis, % proportion of all query genes that are found in the given Gene Ontology term, P p-value, q p-value adjusted for multiple testing. Analysis made using Metascape.
Fig. 6
Fig. 6. Analysis of shared DEGs between the in-house and GeneLab pipeline analyses of plant experiments performed in spaceflight using the BRIC hardware.
Overlap between gene lists for microarray studies (a) or RNA-seq (b) where purple curves link identical genes and light blue includes the shared Gene Ontology term level. Curves link genes that belong to the same enriched Gene Ontology term. The inner circle represents gene lists, where hits are arranged along the arc. Genes that hit multiple lists are colored in dark orange, and genes unique to a list are shown in light orange. Sectors denoted by GeneLab ## show the analysis using GeneLab common pipeline; sectors denoted by a citation show the original authors’ in-house analysis. c, d Significantly enriched GO terms from analysis of common genes found in the microarray (c) and RNA-seq (d) analyses identified in both the in-house and GeneLab pipelines. Analysis in c and d performed using Metascape.
Fig. 7
Fig. 7. Protein:protein interaction network inferred from the common DEGs identified using the GeneLab analysis pipeline of GLDS-37 and GLDS-38.
Analysis using Metascape with annotation of densely connected network elements identified with the MCode algorithm. Colors represent clusters grouped by shared ontology term. Size of circle shows the number of protein:protein interactions that each node/locus is annotated as being involved with as identified by the MCode analysis.
Fig. 8
Fig. 8. Network analysis of the 6 common spaceflight responsive genes identified from analysis of Arabidopsis seedlings flown in the BRIC hardware.
Query genes are highlighted in yellow. AT1G74310 (HOT1/HSP101; HEAT SHOCK PROTEIN 101), AT1G58340 (ABS4, a plant MATE multidrug and toxic compound extrusion transporter), AT5G52310 (COR78; COLD REGULATED 78), AT4G11290 (PRX39, PEROXIDASE 39, a cell wall peroxidase), AT5G09220 (AAP2, AMINO ACID PERMEASE 2), and AT1G73480 (MAGL4, an α-β hydrolase family protein). Analysis performed using KnetMiner. Purple connector, link to biochemical function; cyan connector, link to physical location in cell; green connector, link to associated phenotype; black connector, direct physical or genetic linkage. Note links to plastid (green oval) for MAGl4, HSP101 and COR78. An interactive version of this analysis is available at: https://knetminer.com/beta/knetspace/network/970c571c-15da-4b93-87ad-ef1418ef9d29.

References

    1. Hoson T, Soga K. New aspects of gravity responses in plant cells. Int. Rev. Cytol. 2003;229:209–244. doi: 10.1016/S0074-7696(03)29005-7. - DOI - PubMed
    1. Morita MT. Directional gravity sensing in gravitropism. Annu. Rev. Plant Biol. 2010;61:705–720. doi: 10.1146/annurev.arplant.043008.092042. - DOI - PubMed
    1. Su S-H, Gibbs NM, Jancewicz AL, Masson PH. Molecular mechanisms of root gravitropism. Curr. Biol. 2017;27:R964–R972. doi: 10.1016/j.cub.2017.07.015. - DOI - PubMed
    1. Nakamura M, Nishimura T, Morita MT. Bridging the gap between amyloplasts and directional auxin transport in plant gravitropism. Curr. Opin. Plant Biol. 2019;52:54–60. doi: 10.1016/j.pbi.2019.07.005. - DOI - PubMed
    1. Kitaya Y, et al. The effect of gravity on surface temperature and net photosynthetic rate of plant leaves. Adv. Sp. Res. 2001;28:659–664. doi: 10.1016/S0273-1177(01)00375-1. - DOI - PubMed