. 2023 Apr;30(4):489-501.
doi: 10.1038/s41594-023-00943-7. Epub 2023 Mar 20.

Loss of H3K9 trimethylation alters chromosome compaction and transcription factor retention during mitosis

Affiliations

Loss of H3K9 trimethylation alters chromosome compaction and transcription factor retention during mitosis

Dounia Djeghloul et al. Nat Struct Mol Biol. 2023 Apr.

Abstract

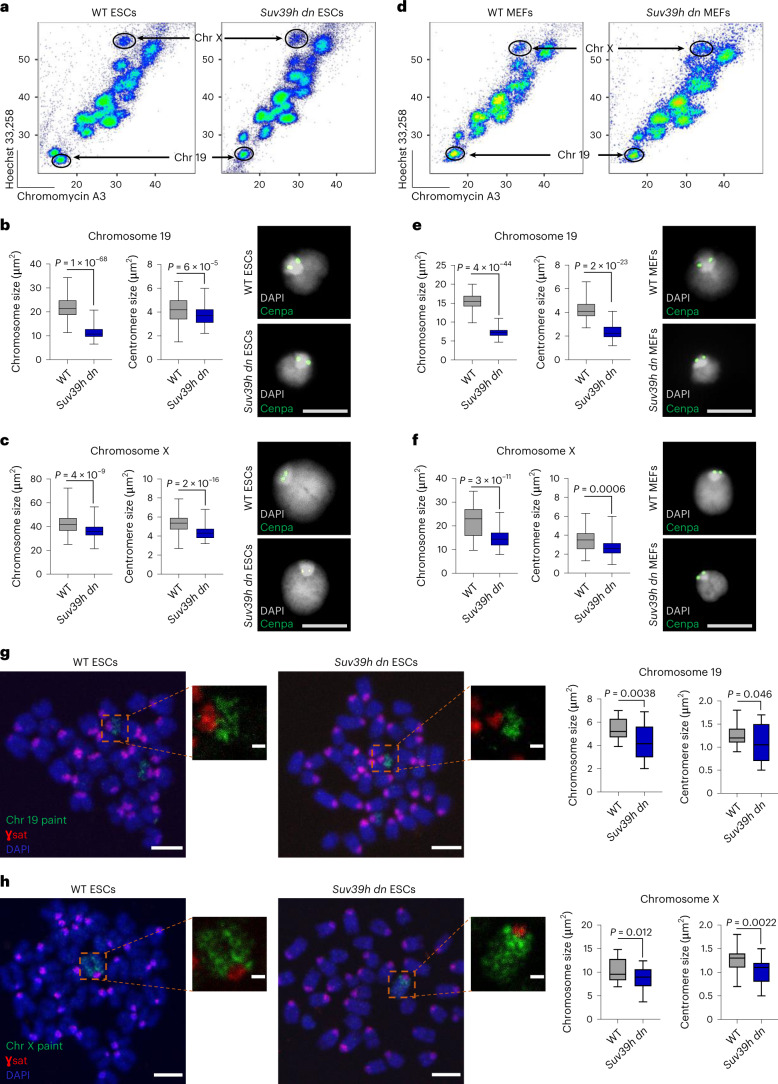
Recent studies have shown that repressive chromatin machinery, including DNA methyltransferases and polycomb repressor complexes, binds to chromosomes throughout mitosis and their depletion results in increased chromosome size. In the present study, we show that enzymes that catalyze H3K9 methylation, such as Suv39h1, Suv39h2, G9a and Glp, are also retained on mitotic chromosomes. Surprisingly, however, mutants lacking histone 3 lysine 9 trimethylation (H3K9me3) have unusually small and compact mitotic chromosomes associated with increased histone H3 phospho Ser10 (H3S10ph) and H3K27me3 levels. Chromosome size and centromere compaction in these mutants were rescued by providing exogenous first protein lysine methyltransferase Suv39h1 or inhibiting Ezh2 activity. Quantitative proteomic comparisons of native mitotic chromosomes isolated from wild-type versus Suv39h1/Suv39h2 double-null mouse embryonic stem cells revealed that H3K9me3 was essential for the efficient retention of bookmarking factors such as Esrrb. These results highlight an unexpected role for repressive heterochromatin domains in preserving transcription factor binding through mitosis and underscore the importance of H3K9me3 for sustaining chromosome architecture and epigenetic memory during cell division.


Conflict of interest statement

The authors declare no competing interests.

Figures

Fig. 1
Fig. 1. Suv39h1/Suv39h2 deficiency generates small and compact mitotic chromosomes.
af, Flow sorting and size measurements of chromosomes (Chr) 19 and X from WT or Suv39h dn mouse ESCs and MEFs. Flow karyotype of mitotic chromosomes is isolated from WT or Suv39h dn ESCs (a) and MEFs (d); gates used to isolate chromosomes 19 and X are indicated. Representative images (right) of mitotic chromosomes 19 (b and e) and X (c and f) from WT or Suv39h dn ESCs (b and c) and MEFs (e and f) are shown, where DAPI stain (gray) and Cenpa label (green) indicate the chromosome body and centromere, respectively. Scale bar, 5 μm. Boxplots (left of images) show area measurements of individual chromosomes and centromeres for WT and Suv39h dn cells. Minimum, lower quartile, median, upper quartile and maximum values are indicated (n = minimum 100 chromosomes analyzed for each cell line over 3 independent experiments). P values of statistically significant changes, measured by unpaired, two-tailed Student’s t-tests, are indicated. g,h, Representative images of WT or Suv39h dn ESC metaphase spreads stained with either chromosome 19 painting probe (green) (g) or chromosome X painting probe (green) (h), in addition to γSat probe (red) and DAPI (blue). Scale bars, 4 μm and 1 μm for the metaphase spread and zoom-in images, respectively. Chromosome and centromere sizes of chromosomes 19 and X were calculated on metaphase spreads of WT and Suv39h dn ESCs. Boxplots show chromosome and centromere area measurements for WT and Suv39h dn spreads. Minimum, lower quartile, median, upper quartile and maximum values are indicated (n = minimum 25 chromosomes analyzed on metaphase spreads for each line over 3 independent experiments). b,c,eh, P values of statistically significant changes, measured by unpaired, two-tailed Student’s t-tests, are indicated. Source data, including the precise numbers of chromosomes analyzed, are provided. Source data
Fig. 2
Fig. 2. Suv39h dn mitotic chromosomes show elevated levels of H3K27me3 and H3S10ph and can be resized by inhibiting PRC2 activity.
a,b, Representative images (right) of immunofluorescence labeling of histone H3K9me3 (a) (green) or histone H3K27me3 (b) (pink) on chromosome 19 isolated from WT or Suv39h dn ESCs, where DAPI counterstain is shown in light gray. Scale bar, 5 μm. Plots (left of the images) show H3K9me3 (a) or H3K27me3 (b) mean intensities, measured at centromeric regions. c, Representative images of immunofluorescence labeling of histone H3S10ph (yellow) on WT and Suv39h dn metaphase-arrested ESCs, where DAPI counterstain is shown in blue. Scale bar, 4 μm. H3S10ph mean intensities were measured on mitotic chromosomes for each condition (n = minimum 40 chromosomes analyzed for each cell line over 3 independent experiments (ac)). P values of statistically significant changes, measured by unpaired, two-tailed Student’s t-tests, are indicated. d, Experimental strategy used to measure mitotic chromosome size of Suv39h dn ESCs after treatment with DNA methylation or PRC2 inhibitors (5-Aza or GSK343, respectively). e,f, Representative images of immunofluorescence labeling of histone H3K27me3 (red) on mouse chromosome 19 (e) and chromosome X (f) isolated from Suv39h dn ESCs pretreated with DMSO, 5-Aza or GSK343. DAPI counterstain is shown in light gray. Scale bar, 5 μm. H3K27me3 mean intensities were measured at centromeric regions and whole chromosomes; the mean ± s.d. is shown (n = minimum 50 chromosomes analyzed over 3 independent experiments). P values of statistically significant decreases compared with DMSO treatment, measured by unpaired, two-tailed Student’s t-tests, are indicated. Boxplots show area measurements of individual chromosomes and centromeres for each condition. Minimum, lower quartile, median, upper quartile and maximum values are indicated (n = minimum 100 chromosomes analyzed for each condition over 3 independent experiments). P values of statistically significant increases compared with DMSO treatment, measured by unpaired, two-tailed Student’s t-tests, are indicated. g, Chromatin accessibility profile across chromosome 19 for WT and Suv39h dn asynchronous (Asynch.) and mitotic ESCs and flow-sorted mitotic chromosomes, shown as log2(enrichment of ATAC-seq signal). ac,e,f, Source data, including the precise numbers of chromosomes analyzed, are provided. Source data
Fig. 3
Fig. 3. Proteomic analysis reveals a cadre of chromosome-binding factors that require H3K9me3 to remain efficiently bound during mitosis.
a, Volcano plots of proteins significantly enriched (red), depleted (blue) or not significantly changed (gray) on sorted chromosomes relative to mitotic lysate pellets for WT (left) and Suv39h dn (right) MEFs (unpaired, two-tailed Student’s t-test, permutation-based FDR < 0.05, s0 = 0.1 (n = 3 independent experiments each measured in technical duplicate; see Methods for details). Proteins were plotted as log2(fold-change LFQ intensity of sorted chromosome pellets/LFQ intensity of mitotic lysate pellet versus significance) (−log10(P)) using Perseus software). The number of proteins in each category is indicated on the volcano plot. b, Venn diagram showing the overlap of protein IDs enriched on mitotic chromosomes between WT and Suv39h dn MEF samples. c, GO term (biological process) analysis of proteins that lose enrichment on Suv39h dn mitotic MEF chromosomes compared with WT. Analysis was performed at http://geneontology.org using Fisher’s exact test with FDR correction. d, Volcano plots (as in a) of proteins significantly enriched (red), depleted (blue) or not significantly changed (gray) on sorted chromosomes relative to mitotic lysate pellets for WT (left) and Suv39h dn (right) mouse ESCs. e, Venn diagram showing the overlap of protein IDs enriched on mitotic chromosomes between WT and Suv39h dn mouse ESC samples. f, GO term (biological process) analysis (as in c) of proteins that lose enrichment on Suv39h dn mitotic mouse ESC chromosomes compared with WT.
Fig. 4
Fig. 4. ESCs lacking Suv39h1/Suv39h2 show an altered retention of pluripotency-associated factors on mitotic chromosomes.
a, Volcano plots as in Fig. 3d, highlighting pluripotency-associated factors that are enriched (red) or not significantly changed (black) on WT (left plot) or Suv39h dn (right plot) ESC mitotic chromosomes. b, Esrrb immunolabeling (red) of WT and Suv39h dn flow-sorted chromosomes 19 (left panel) and X (right panel), where DAPI counterstain is shown in light gray. Scale bar, 5 μm. Esrrb mean intensities were measured across individual chromosomes; the mean ± s.d. is shown (n = minimum 50 chromosomes analyzed over 3 independent experiments). P values of statistically significant changes, measured by unpaired, two-tailed Student’s t-tests, are indicated. c, Esrrb ChIP–qPCR analysis in WT versus Suv39h dn mitotic and asynchronous ESCs. Enrichment (immunoprecipitated as a percentage of input (% IP)) was measured at Esrrb bookmarked sites (Capn2, Esrrb, Jam2-s1, Jam2-s2, Tbx3 and Tet2), Esrrb lost sites (bound only in interphase; Mgat3 and Twistnb) or control sites that do not bind Esrrb (Esrrb-3′ and Actb). The mean + s.d. results are shown. For interphase cells n = 3 biological replicates, for mitotic cells n = 4 biological replicates (except Capn2, Esrrb, Rex1 and Jam2-s1, where n = 5). d, Live-cell imaging of Esrrb–tdTomato mouse ESCs pretreated with DMSO (upper panel) or 100 nM of chaetocin (lower panel) cultured with SiR-DNA (red). Arrows show Esrrb localization to mitotic chromatin. Scale bar, 5 μm. Esrrb–tdTomato mean intensities on mitotic DNA (gated based on SiR-DNA signal) and in interphase nuclei were quantified for each condition; the mean ± s.d. is shown. For mitotic chromosomes: n = 25 (DMSO) or n = 35 (chaetocin) cells analyzed; for interphase nuclei: n = 46 cells analyzed for both DMSO and chaetocin treatments, representing 3 independent experiments. bd, P values of statistically significant changes, measured by unpaired, two-tailed Student’s t-tests, are indicated. Source data and precise n numbers are provided. Source data
Fig. 5
Fig. 5. Optimal retention of mitotic bookmarking factors such as Esrrb requires H3K9me3.
a, Representative images of coimmunolabeling of histone H3K9me3 (blue) and H3K27me3 (red) on chromosomes 19 (upper panel) and X (lower panel) isolated from Suv39h dn ESCs or Suv39h dn ESCs overexpressing Suv39h1-EGFP. The DAPI counterstain is shown in light gray. Scale bar, 5 μm. H3K9me3 and H3K27me3 mean intensities were measured at centromeric regions of chromosomes 19 and X (mean ± s.d. is shown; n = minimum 50 chromosomes analyzed over 3 independent experiments). P values of statistically significant changes, measured by unpaired, two-tailed Student’s t-tests, are indicated. b, Size measurements of chromosomes 19 (upper panel) and X (lower panel) isolated from Suv39h dn ESCs or Suv39h dn ESCs overexpressing Suv39h1-EGFP. Boxplots show area measurements of individual chromosomes and centromeres for each cell line. Minimum, lower quartile, median, upper quartile and maximum values are indicated (n = minimum 100 chromosome measurements for each cell line). P values of statistically significant changes, measured by unpaired, two-tailed Student’s t-tests, are indicated. a,b, Source data and precise n numbers are provided. c,d, Volcano plots highlighting pluripotency-associated factors that are enriched (red) or not significantly changed (black) on mitotic chromosomes versus mitotic lysate pellets for Suv39h dn ESCs and Suv39h dn ESCs expressing Suv39h1-EGFP (c) and Suv39h dn ESCs treated with GSK343 or Suv39h dn ESCs treated with Hesperadin (d). Proteins were plotted as log2(fold-change LFQ intensity of sorted chromosome pellets/LFQ intensity of mitotic lysate pellet and significance) (−log10(P)) using Perseus software (unpaired, two-tailed Student’s t-test, permutation-based FDR < 0.05, s0 = 0.1; n = 3 independent experiments each measured in technical duplicate; see Methods for details). Source data
Fig. 6
Fig. 6. Esrrb association with euchromatin and heterochromatin regions during mitosis.
a, Representative images of Esrrb–tdTomato ESC metaphase spreads stained with DAPI (blue). Scale bar, 10 μm. b, Esrrb immunolabeling (red) of flow-sorted chromosomes 19 (top panel) and X (lower panel), where DAPI counterstain is shown in light gray. Scale bar, 5 μm. Linescan analysis (profile plots) is shown of Esrrb (red) and DAPI (gray) intensities across chromosomes 19 and X (right panels). Ab, antibody. c, Representative fluorescence images of Esrrb–tdTomato ESCs at metaphase (left) and telophase (right) stages with and without chaetocin treatment. DAPI stain is in blue. d, Cot-1 (pink) and γSat repeat (yellow) RNA–FISH in WT and Suv39h dn ESCs, with DAPI stain in blue. Scale bar, 5 μm. All the images represent three independent experiments.

References

    1. Politz JCR, Scalzo D, Groudine M. The redundancy of the mammalian heterochromatic compartment. Curr. Opin. Genet. Dev. 2016;37:1–8. doi: 10.1016/j.gde.2015.10.007. - DOI - PMC - PubMed
    1. Bizhanova A, Kaufman PD. Close to the edge: heterochromatin at the nucleolar and nuclear peripheries. Biochim. Biophys. Acta Gene Regul. Mech. 2021;1864:194666. doi: 10.1016/j.bbagrm.2020.194666. - DOI - PMC - PubMed
    1. Arunkumar G, Melters DP. Centromeric transcription: a conserved Swiss-army knife. Genes. 2020;11:911. doi: 10.3390/genes11080911. - DOI - PMC - PubMed
    1. Saksouk N, Simboeck E, Dejardin J. Constitutive heterochromatin formation and transcription in mammals. Epigenet. Chromatin. 2015;8:3. doi: 10.1186/1756-8935-8-3. - DOI - PMC - PubMed
    1. Jones KW. Chromosomal and nuclear location of mouse satellite DNA in individual cells. Nature. 1970;225:912–915. doi: 10.1038/225912a0. - DOI - PubMed

Publication types