. 2023 Jan-Dec;15(1):2190304.
doi: 10.1080/19490976.2023.2190304.

Lactobacillus rhamnosus GG ameliorates osteoporosis in ovariectomized rats by regulating the Th17/Treg balance and gut microbiota structure

Affiliations

Lactobacillus rhamnosus GG ameliorates osteoporosis in ovariectomized rats by regulating the Th17/Treg balance and gut microbiota structure

Mengyu Guo et al. Gut Microbes. 2023 Jan-Dec.

Abstract

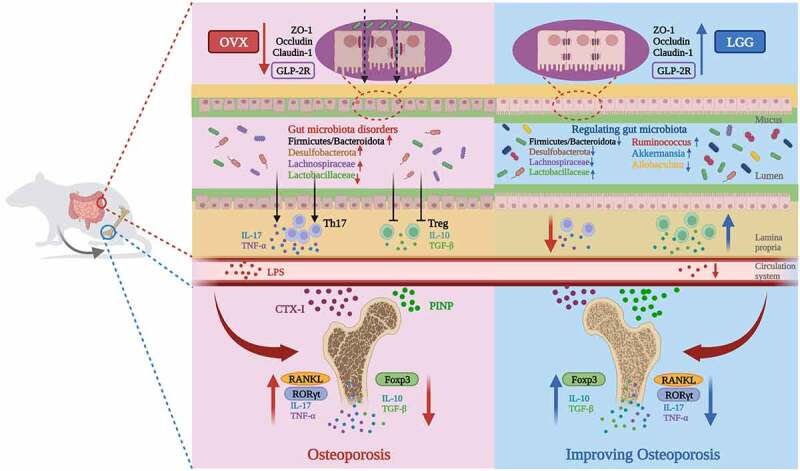
Background: With increasing knowledge about the gut - bone axis, more studies for treatments based on the regulation of postmenopausal osteoporosis by gut microbes are being conducted. Based on our previous work, this study was conducted to further investigate the therapeutic effects of Lactobacillus rhamnosus GG (LGG) on ovariectomized (OVX) model rats and the immunological and microecological mechanisms involved.

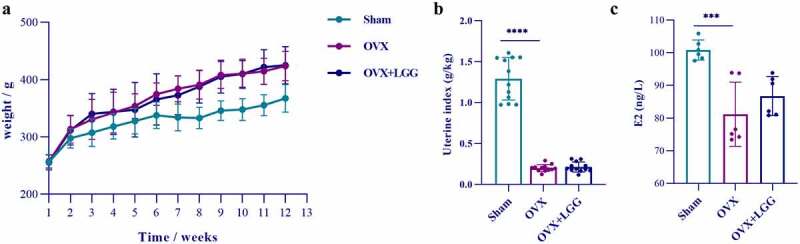
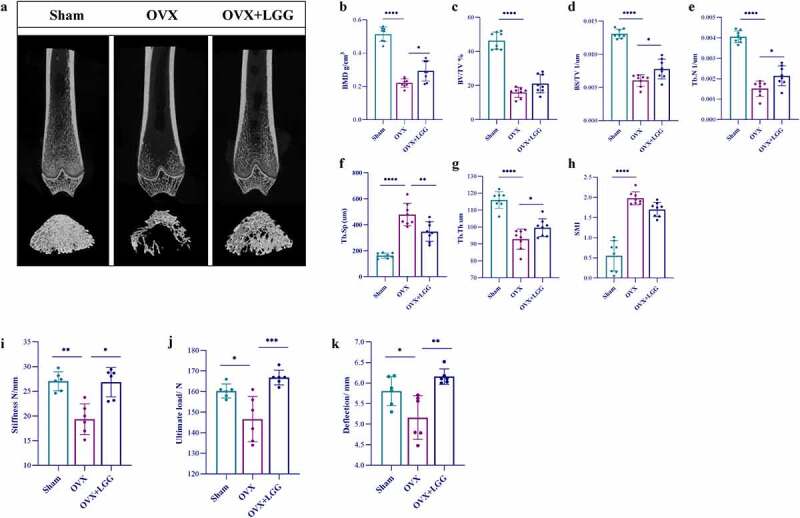
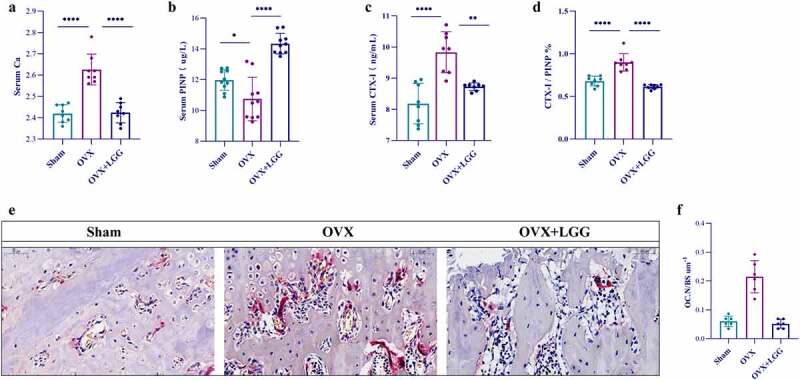
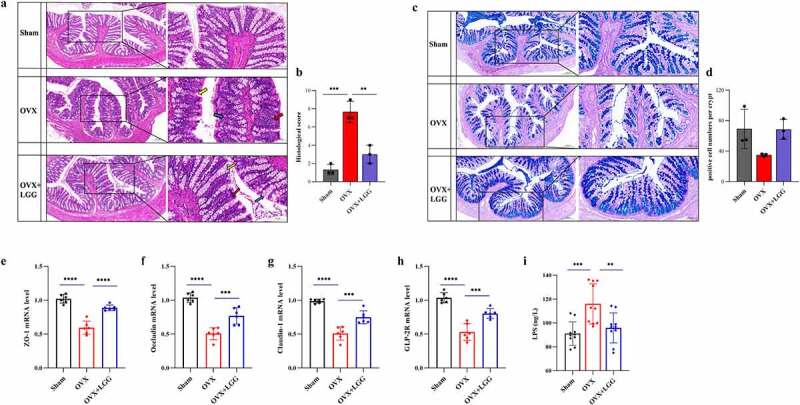
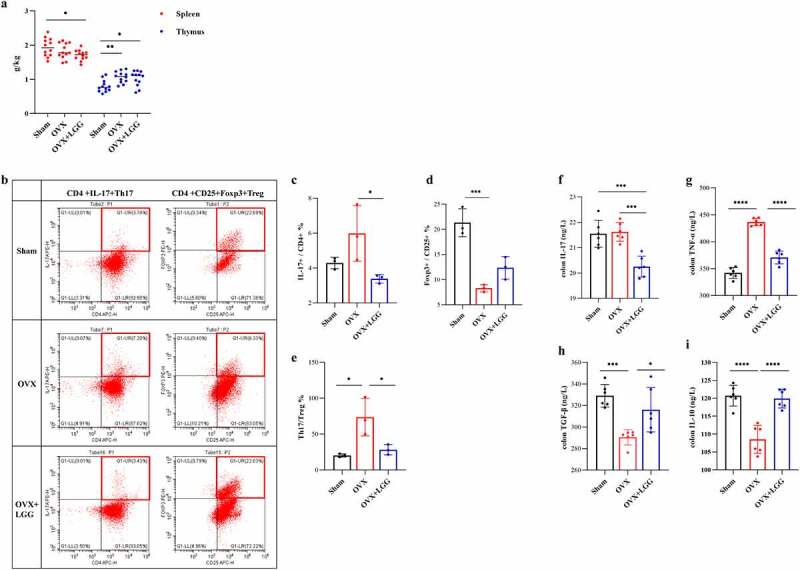
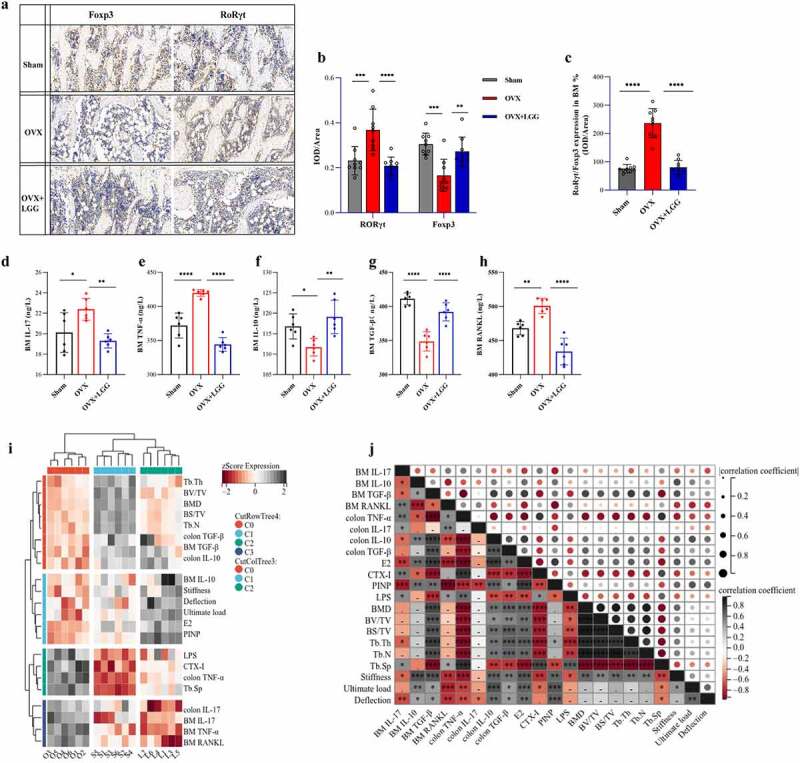
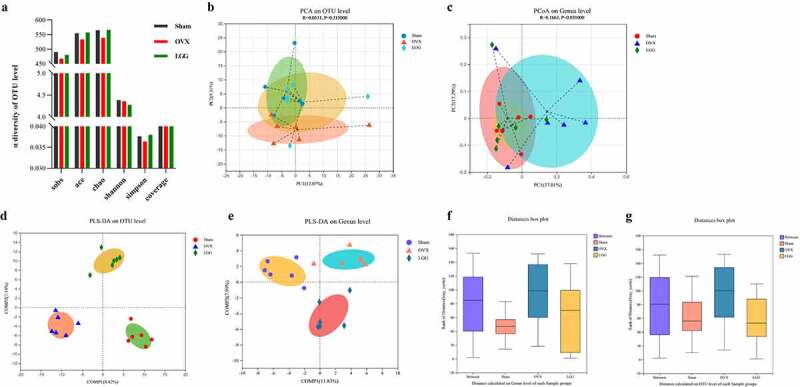
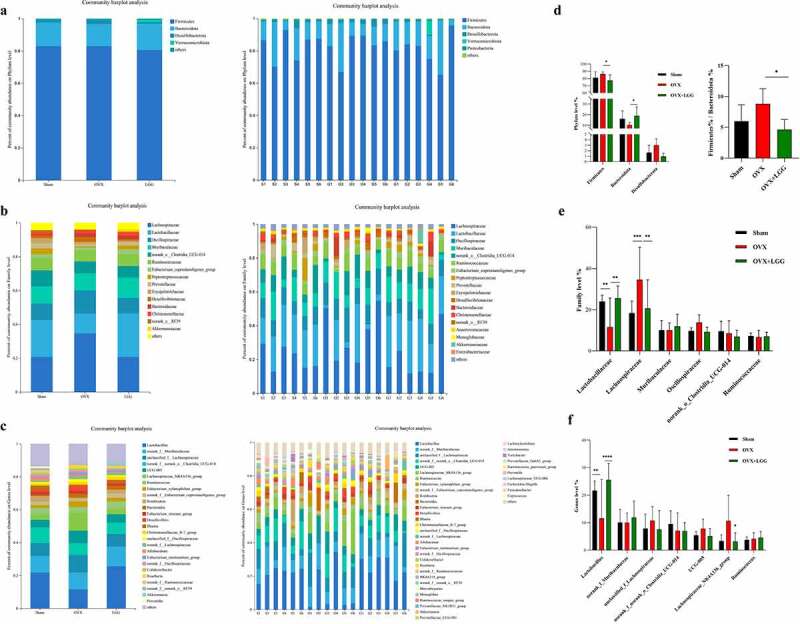
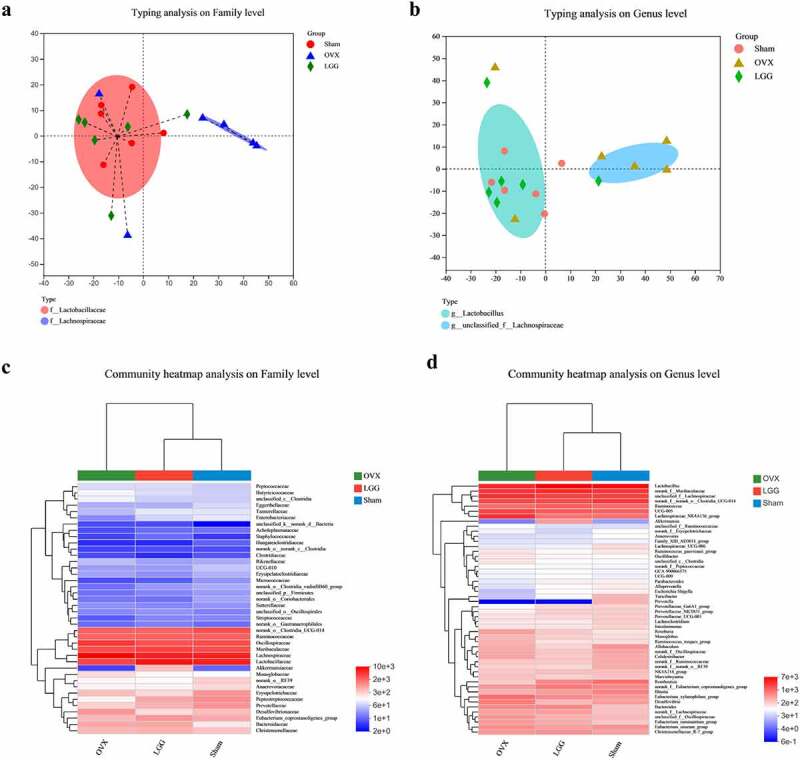
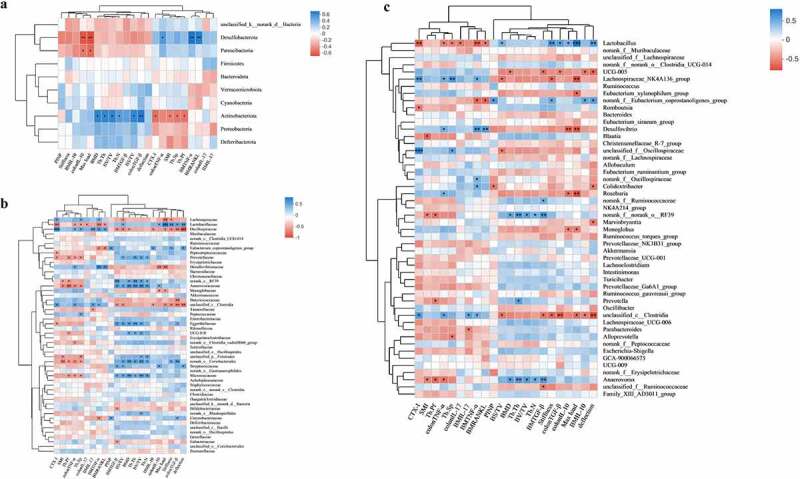
Results: We found a protective effect of LGG treatment in OVX rats through changes in bone microarchitecture, bone biomechanics, and CTX-I, PINP, Ca, and RANKL expression levels. LGG was more advantageous in promoting osteogenesis, which may be responsible for the alleviation of osteoporosis. Th17 cells were imbalanced with Treg cells in mediastinal lymph nodes and bone marrow, with RORγt and FOXP3 expression following a similar trend. TNF-α and IL-17 expression in colon and bone marrow increased, while TGF-β and IL-10 expression decreased; however, LGG treatment modulated these changes and improved the Th17/Treg balance significantly. Regarding the intestinal barrier, we found that LGG treatment ameliorated estrogen deficiency-induced inflammation and mucosal damage and increased the expression of GLP-2 R and tight junction proteins. Importantly, 16S rRNA sequencing showed a significant increase in the Firmicutes/Bacteroidetes ratio during estrogen deficiency. Dominant intestinal flora showed significant differences in composition; LGG treatment regulated the various genera that were imbalanced in OVX, along with modifying those that did not change significantly in other groups with respect to the intestinal barrier, inflammation development, and bile acid metabolism.

Conclusions: Overall, LGG ameliorated estrogen deficiency-induced osteoporosis by regulating the gut microbiome and intestinal barrier and stimulating Th17/Treg balance in gut and bone.

Keywords: Lactobacillus rhamnosus; OVX; Osteoporosis; Th17/Treg; gut barrier; gut microbiota.


Conflict of interest statement

No potential conflict of interest was reported by the authors.

Figures

None
Graphical summary. LGG alleviates osteoporosis in ovariectomized rats by modulating the gut microbiome and intestinal barrier and improving Th17/Treg balance in gut- bone.
Figure 1.
Figure 1.
Lactobacillus rhamnosus GG (LGG) (ATCC7469) characteristics. (a) LGG growth curve. (b) Survival rate of LGG in medium with different pH. (c) Survival rate of LGG in different concentrations of bile salts medium.
Figure 2.
Figure 2.
(a) Changes in body weight of experimental animals over the course of the experimental period. (b) Differences in uterine index (uterine weight/body weight) among groups. (c) Serum E2 level.
Figure 3.
Figure 3.
LGG ameliorates osteoporosis in ovariectomized rats. (a) the femur distal metaphyseal region of rats was analyzed using micro-computed tomography (CT). (b-h) Comparison of BMD, BV/TV, BS/TV, Tb.Sp, Tb.N, Tb.Th, SMI between groups. (i-k) Biomechanics of the femur of ovariectomized rats; a three-point bending test was used to detect the stiffness, ultimate load, and deflection. Data are expressed as mean ± standard deviation. (n = 6–12). *P < 0.05, **P < 0.01, ***P < 0.001, ****P < 0.0001 (Dunnett multiple comparisons test). BMD, bone mineral density; BV/TV, bone volume/total volume; BS/BV, bone surface area/bone volume; Tb.Sp, trabecular separation; Tb.N, trabecular number; Tb.Th, trabecular thickness; SMI, structure model index; LGG, Lactobacillus rhamnosus.
Figure 4.
Figure 4.
Administration of LGG improves expression of bone turnover markers. (a-d) the changes of serum Ca level, CTX-I, and PINP, and CTX-I/PINP were observed among the groups. (n = 8–10). (e) Representative pictures in TRAP stained (scale bar, 100 µm; arrows, red-wine stained osteoclasts with multiple nuclei) (n = 3). (f) OC.N/BS of osteoclasts from slices of distal femur was evaluated in each group in two different fields of view. (n = 3). Data are expressed as mean ± standard deviation. (n = 6–12). *P < 0.05, **P < 0.01, ***P < 0.0001 (Dunnett multiple comparisons test). CTX-I, C-telopeptide of type I collagen; PINP, N-terminal propeptide of type I procollagen; OC.N, the number of osteoclast; OC.N/BS, the number of osteoclast/the bone surface area.
Figure 5.
Figure 5.
Administration of LGG induces gut barrier reinforcement. (a) Representative pictures of HE-stained (scale bar, 200 µm, enlarged figure, 100 µm (n = 3). Red arrows, inflammatory infiltrates; blue arrows, goblet cells; yellow arrows, intestinal crypt). (b) Intestinal morphology studies measure cumulative scores including inflammation infiltration and crypt damage and goblet cells damage.The scoring criteria are shown in Supplementary Table 2. (c) Representative pictures of Ab-PAS stained (scale bar, 200 µm, enlarged figure 100 µm) (n = 3). (d) Morphological research measures include the number of goblet cells in the gland. (e-h) the mRNA expression of the ZO-1, occludin, claudin-1, and GLP-2 gene in colon tissue. (n = 6). (i) Serum LPS level. (n = 10). Data are expressed as mean ± standard deviation. *P < 0.01, **P < 0.001, ***P < 0.0001 (Dunnett multiple comparisons test). HE staining, hematoxylin-eosin staining; Ab-PAS stained, Alcian blue – periodic acid Schiff stain; ZO-1, Zonula Occludens-1; GLP-2, Glucagon-like Peptide-2; LPS, lipopolysaccharide; LGG, Lactobacillus rhamnosus.
Figure 6.
Figure 6.
Administration of LGG improves the Th17/Treg balance in gut. (a) Thymus and spleen index (organ weight/body weight). (n=(12). Frequencies of Th 17 cells and T reg in MLN. (c-d) Th17(CD4+IL-17A+), Treg(CD4+CD25+FOXP3+). (n = 3). (e) the IL-17+/FOXP3+ % value represents the difference of Th17/Treg ratio between groups. (n = 3). (f-i) Colonic pro-inflammatory cytokines concentration. IL-17, TNF-α; colonic anti-inflammatory cytokine concentration. IL-10, TGF-β. (n = 6). Data are expressed as mean ± standard deviation. *P < 0.05, **P < 0.01, ***P < 0.001, ****P < 0.0001 (Dunnett multiple comparisons test). Th 17, T helper cell 17; T reg, Regulatory T cell; MLN, mesenteric lymph nodes; LGG, Lactobacillus rhamnosus.
Figure 7.
Figure 7.
Administration of LGG improves the Th 17/T reg balance in BM. (a) Representative pictures of immunohistochemistry staining of RORγt and FOXP3 in femur tissue of the three groups (scale bar, 100 µm). (b) Measurements included IOD/area analysis, with each sample analyzed in three different fields of view. (n = 3). (c) RORγt/FOXP3 was used to measure Th17/Treg in BM. (d-g) Pro-inflammatory cytokines, IL-17 and TNF-α, and anti-inflammatory cytokines concentration, IL-10 and TGF-β, in BM. (n = 6). (h) Expression of osteoclast cytokine RANKL in BM. (n = 6). (i-j) Analysis of the correlation between the bone and Th17/Treg. Heat map analysis of bone indexes and Th17/Treg, and cluster analysis among samples in groups. Matrix analysis for correlation analysis of all samples. Data are expressed as mean ± standard deviation. *P < 0.05, **P < 0.01, ***P < 0.001, ****P < 0.0001 (Dunnett multiple comparisons test). Th 17, T helper cell 17; T reg, Regulatory T cell; IOD, integral optical density.
Figure 8.
Figure 8.
Cluster and diversity analysis of gut microbiota in mice in different groups. (a) Reflecting the alpha diversity of the gut microbes in feces, Sobs, ace, Chao, Shannon, Simpson, and coverage index changes in each group. (b) PCA plot of the gut microbiota at the OTU level. (c) PCoA plot on genus level. (d,e) PLS-DA plots on OTU and genus levels. (f,g) Beta diversity analysis of ANOSIM analysis plot of the gut microbiota in feces on OTU and genus levels. PCA, principal component analysis; OTU, operational taxonomic unit; PCoA, principal coordinate analysis; PLS-DA, partial least-squares discriminant analysis; ANOSIM, analysis of similarities.
Figure 9.
Figure 9.
Relative abundance analysis of gut microbiota at the multispecies level in different groups. (a-c) Relative abundances of the gut microbiota at the phylum, family, and genus levels. Each column represents a sample, and each column represents a group. (d-f) the three most abundant phylum, as well as the six most abundant families, and the seven most abundant genera were analyzed separately.
Figure 10.
Figure 10.
LGG adjusts the structure of the gut microbes of OVX rats. (a,b) Microbiota typing analysis using clustering to study the dominant microbiota structure of different samples at the family and genus levels. (c,d) the heatmaps reflect the similarities and differences in gut microbe community composition of different groups at the family and genus levels.
Figure 11.
Figure 11.
Analysis of the correlation between gut microbiota, bone turnover indicators, and inflammation indicators. (a-c) Heat map of the correlations between 22 OGF and OCF, and gut microbiota at the phylum level, family level, genus level. *P < 0.5, **P < 0.01, ***P < 0.001; non-significant comparisons are indicated by no asterisk. Blue indicates a positive correlation; red indicates a negative correlation. OGF, osteogenic-related factors; OCF, osteoclastic-related factors.
Figure 12.
Figure 12.
Pathways that are predicted to show different abundances among groups according to the Kyoto Encyclopedia of Genes and Genomes (KEGG) pathway analysis.

References

    1. Eastell R, O’neill TW, Hofbauer LC, Langdahl B, Reid IR, Gold DT, Cummings SR.. Postmenopausal osteoporosis. Nat Rev Dis Primers. 2016;2:16069. doi: 10.1038/nrdp.2016.69. - DOI - PubMed
    1. Khosla S, Shane E. A crisis in the treatment of osteoporosis. J Bone Miner Res. 2016;31(8):1485–23. doi: 10.1002/jbmr.2888. - DOI - PubMed
    1. Wang J, Wang Y, Gao W, Wang B, Zhao H, Zeng Y, Ji Y, Hao D. Diversity analysis of gut microbiota in osteoporosis and osteopenia patients. Peer J. 2017;5:e3450–e3450. doi: 10.7717/peerj.3450. - DOI - PMC - PubMed
    1. Cheng S, Qi X, Ma M, Zhang L, Cheng B, Liang C, Liu L, Li P, Kafle OP, Wen Y, et al. Assessing the relationship between gut microbiota and bone mineral density. Front Genet. 2020;11(6). doi: 10.3389/fgene.2020.00006 - DOI - PMC - PubMed
    1. Zhou T, Wang M, Ma H, Li X, Heianza Y, Qi L. Dietary fiber, genetic variations of gut microbiota-derived short-chain fatty acids, and bone health in UK Biobank. J Clin Endocrinol Metab. 2021;106(1):201–210. doi: 10.1210/clinem/dgaa740. - DOI - PMC - PubMed

Publication types

LinkOut - more resources