

Development and validation of a physical frailty phenotype index-based model to estimate the frailty index
- PMID: 36941719
- PMCID: PMC10029224
- DOI: 10.1186/s41512-023-00143-3
Development and validation of a physical frailty phenotype index-based model to estimate the frailty index
Abstract
Background: The conventional count-based physical frailty phenotype (PFP) dichotomizes its criterion predictors-an approach that creates information loss and depends on the availability of population-derived cut-points. This study proposes an alternative approach to computing the PFP by developing and validating a model that uses PFP components to predict the frailty index (FI) in community-dwelling older adults, without the need for predictor dichotomization.
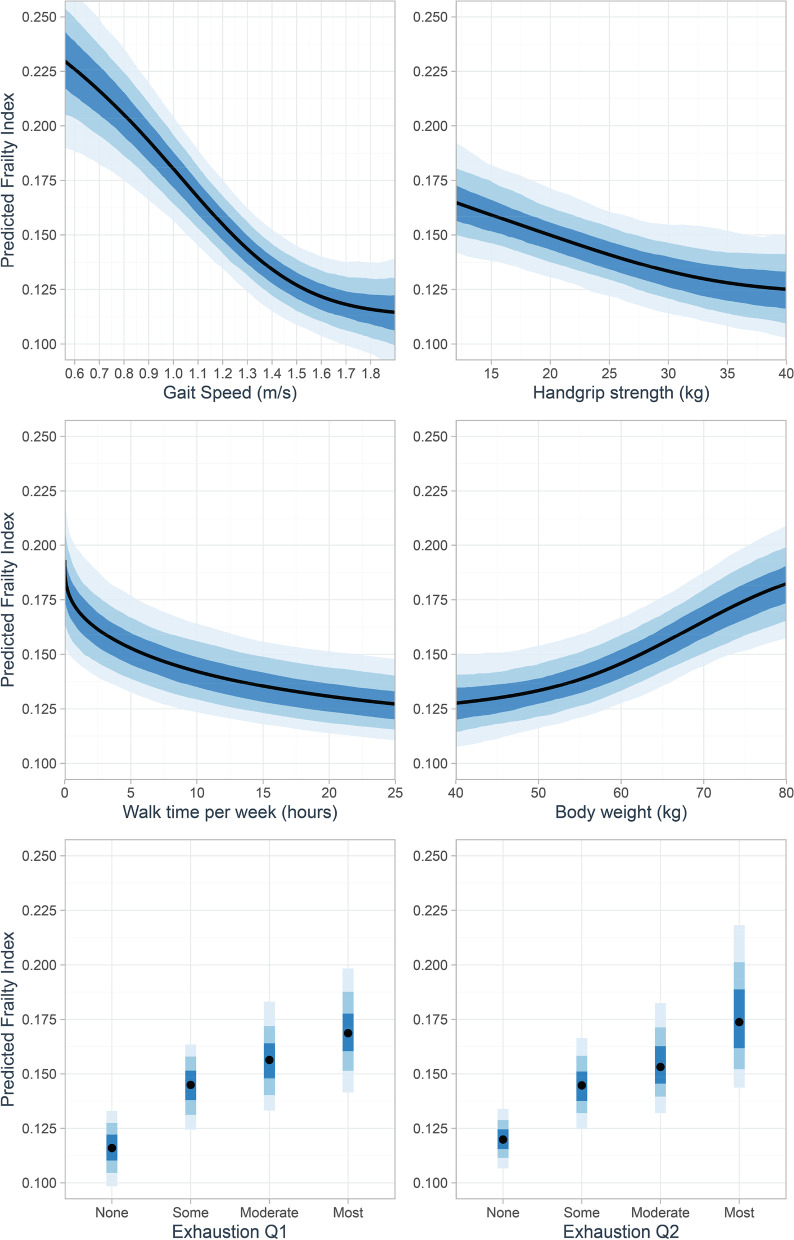
Methods: A sample of 998 community-dwelling older adults (mean [SD], 68 [7] years) participated in this prospective cohort study. Participants completed a multi-domain geriatric screen and a physical fitness assessment from which the count-based PFP and the 36-item FI were computed. One-year prospective falls and hospitalization rates were also measured. Bayesian beta regression analysis, allowing for nonlinear effects of the non-dichotomized PFP criterion predictors, was used to develop a model for FI ("model-based PFP"). Approximate leave-one-out (LOO) cross-validation was used to examine model overfitting.
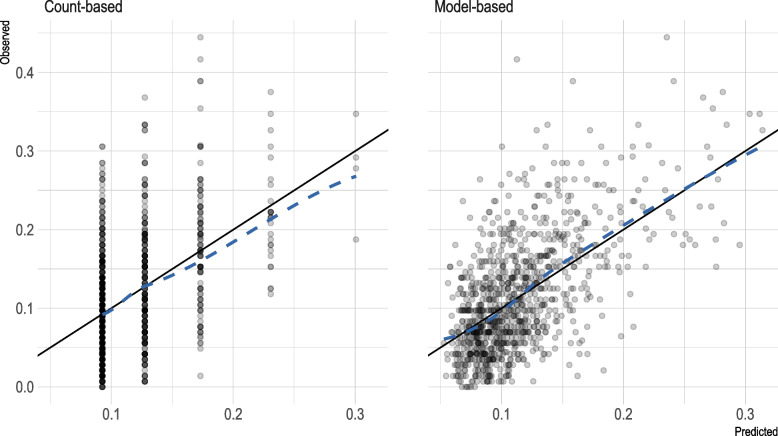
Results: The model-based PFP showed good calibration with the FI, and it had better out-of-sample predictive performance than the count-based PFP (LOO-R2, 0.35 vs 0.22). In clinical terms, the improvement in prediction (i) translated to improved classification agreement with the FI (Cohen's kw, 0.47 vs 0.36) and (ii) resulted primarily in a 23% (95%CI, 18-28%) net increase in FI-defined "prefrail/frail" participants correctly classified. The model-based PFP showed stronger prognostic performance for predicting falls and hospitalization than did the count-based PFP.
Conclusion: The developed model-based PFP predicted FI and clinical outcomes more strongly than did the count-based PFP in community-dwelling older adults. By not requiring predictor cut-points, the model-based PFP potentially facilitates usage and feasibility. Future validation studies should aim to obtain clear evidence on the benefits of this approach.
Keywords: Frailty index; Frailty phenotype; Frailty scales; Geriatrics; Prediction.
© 2023. The Author(s).
Conflict of interest statement
The authors declare that they have no competing interests.
Figures
Similar articles
-
Discrepancy in Frailty Identification: Move Beyond Predictive Validity.J Gerontol A Biol Sci Med Sci. 2020 Jan 20;75(2):387-393. doi: 10.1093/gerona/glz052. J Gerontol A Biol Sci Med Sci. 2020. PMID: 30789645 Free PMC article.
-
Agreement between standard and self-reported assessments of physical frailty syndrome and its components in a registry of community-dwelling older adults.BMC Geriatr. 2022 Aug 25;22(1):705. doi: 10.1186/s12877-022-03376-x. BMC Geriatr. 2022. PMID: 36008767 Free PMC article.
-
Screening accuracy of percentage predicted gait speed for prefrailty/frailty in community-dwelling older adults.Geriatr Gerontol Int. 2022 Aug;22(8):575-580. doi: 10.1111/ggi.14418. Epub 2022 Jun 18. Geriatr Gerontol Int. 2022. PMID: 35716008
-
Physical Frailty Phenotype Criteria and Their Synergistic Association on Cognitive Functioning.J Gerontol A Biol Sci Med Sci. 2021 Aug 13;76(9):1633-1642. doi: 10.1093/gerona/glaa267. J Gerontol A Biol Sci Med Sci. 2021. PMID: 33057609 Free PMC article.
-
The FRAIL-NH Scale: Systematic Review of the Use, Validity and Adaptations for Frailty Screening in Nursing Homes.J Nutr Health Aging. 2021;25(10):1205-1216. doi: 10.1007/s12603-021-1694-3. J Nutr Health Aging. 2021. PMID: 34866147 Free PMC article.
References
Grants and funding
LinkOut - more resources
Full Text Sources