

Cardiac q-space trajectory imaging by motion-compensated tensor-valued diffusion encoding in human heart in vivo
- PMID: 36941736
- PMCID: PMC10952623
- DOI: 10.1002/mrm.29637
Cardiac q-space trajectory imaging by motion-compensated tensor-valued diffusion encoding in human heart in vivo
Abstract
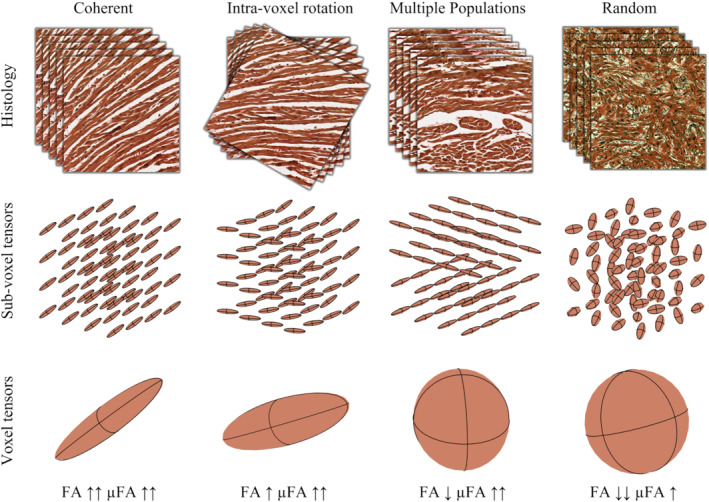
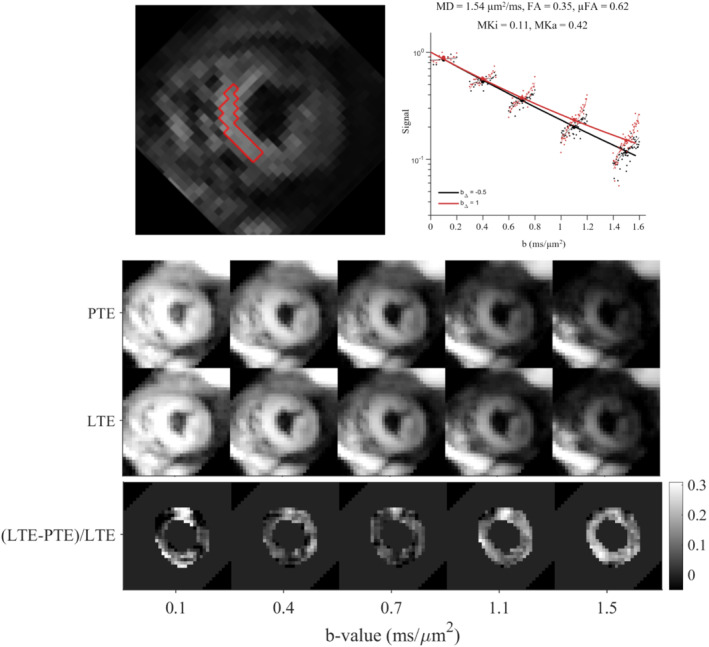
Purpose: Tensor-valued diffusion encoding can probe more specific features of tissue microstructure than what is available by conventional diffusion weighting. In this work, we investigate the technical feasibility of tensor-valued diffusion encoding at high b-values with q-space trajectory imaging (QTI) analysis, in the human heart in vivo.
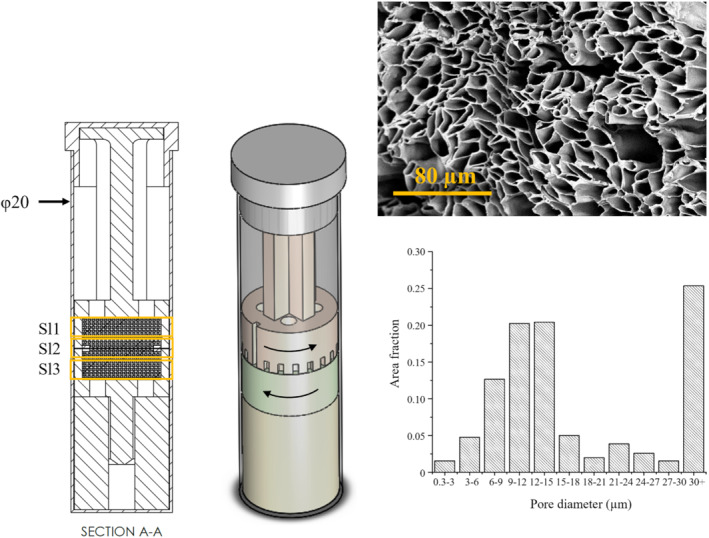
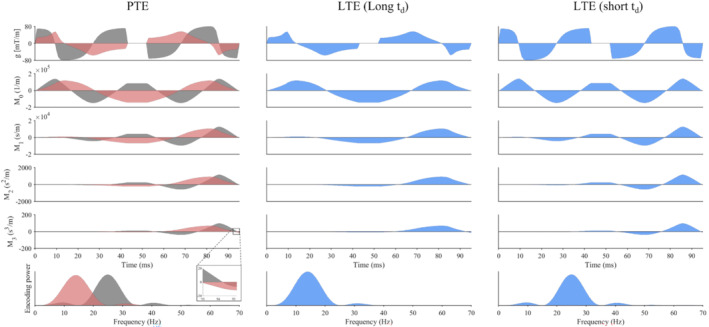
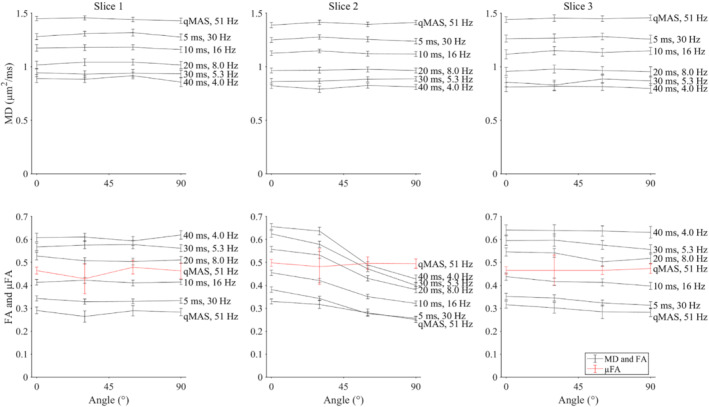
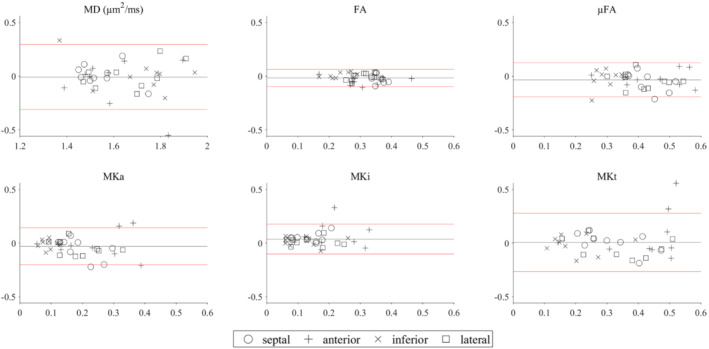
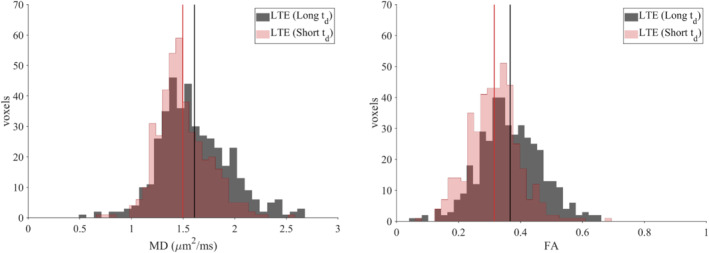
Methods: Ten healthy volunteers were scanned on a 3T scanner. We designed time-optimal gradient waveforms for tensor-valued diffusion encoding (linear and planar) with second-order motion compensation. Data were analyzed with QTI. Normal values and repeatability were investigated for the mean diffusivity (MD), fractional anisotropy (FA), microscopic FA (μFA), isotropic, anisotropic and total mean kurtosis (MKi, MKa, and MKt), and orientation coherence (Cc ). A phantom, consisting of two fiber blocks at adjustable angles, was used to evaluate sensitivity of parameters to orientation dispersion and diffusion time.
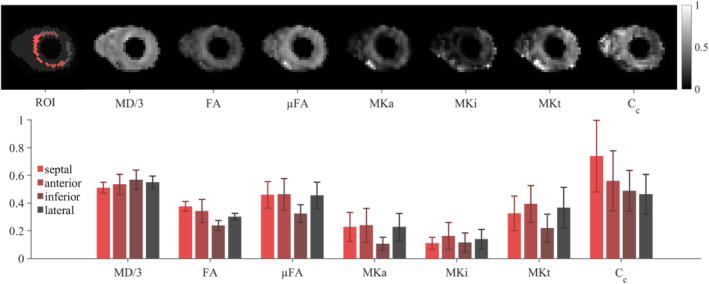
Results: QTI data in the left ventricular myocardium were MD = 1.62 ± 0.07 μm2 /ms, FA = 0.31 ± 0.03, μFA = 0.43 ± 0.07, MKa = 0.20 ± 0.07, MKi = 0.13 ± 0.03, MKt = 0.33 ± 0.09, and Cc = 0.56 ± 0.22 (mean ± SD across subjects). Phantom experiments showed that FA depends on orientation dispersion, whereas μFA was insensitive to this effect.
Conclusion: We demonstrated the first tensor-valued diffusion encoding and QTI analysis in the heart in vivo, along with first measurements of myocardial μFA, MKi, MKa, and Cc . The methodology is technically feasible and provides promising novel biomarkers for myocardial tissue characterization.
Keywords: cardiac microstructure; diffusion tensor imaging; motion-compensated diffusion encoding; q-space trajectory imaging; tensor-valued diffusion encoding; tissue characterization.
© 2023 The Authors. Magnetic Resonance in Medicine published by Wiley Periodicals LLC on behalf of International Society for Magnetic Resonance in Medicine.
Conflict of interest statement
FS and IT are inventors on patents related to this study. FS declares ownership interests in Random Walk Imaging, which holds patents related to the methodology. GJMP is a director and shareholder in Bioxydyn Limited, in Quantitative Imaging Limited, and in Queen Square Analytics, companies with interests in quantitative imaging. The remaining authors declare no conflicts of interest.
Figures
Similar articles
-
Q-space trajectory imaging for multidimensional diffusion MRI of the human brain.Neuroimage. 2016 Jul 15;135:345-62. doi: 10.1016/j.neuroimage.2016.02.039. Epub 2016 Feb 23. Neuroimage. 2016. PMID: 26923372 Free PMC article.
-
Tensor-valued diffusion MRI of human acute stroke.Magn Reson Med. 2024 May;91(5):2126-2141. doi: 10.1002/mrm.29975. Epub 2023 Dec 29. Magn Reson Med. 2024. PMID: 38156813
-
Glioma grading, molecular feature classification, and microstructural characterization using MR diffusional variance decomposition (DIVIDE) imaging.Eur Radiol. 2021 Nov;31(11):8197-8207. doi: 10.1007/s00330-021-07959-x. Epub 2021 Apr 29. Eur Radiol. 2021. PMID: 33914116
-
Gradient waveform design for tensor-valued encoding in diffusion MRI.J Neurosci Methods. 2021 Jan 15;348:109007. doi: 10.1016/j.jneumeth.2020.109007. Epub 2020 Nov 23. J Neurosci Methods. 2021. PMID: 33242529 Free PMC article. Review.
-
The role of diffusion tensor imaging and fractional anisotropy in the evaluation of patients with idiopathic normal pressure hydrocephalus: a literature review.Neurosurg Focus. 2016 Sep;41(3):E12. doi: 10.3171/2016.6.FOCUS16192. Neurosurg Focus. 2016. PMID: 27581308 Review.
Cited by
-
Imaging evaluation focused on microstructural tissue changes using tensor-valued diffusion encoding in breast cancers after neoadjuvant chemotherapy: is it a promising way forward?Gland Surg. 2024 Aug 31;13(8):1387-1399. doi: 10.21037/gs-24-124. Epub 2024 Aug 22. Gland Surg. 2024. PMID: 39282030 Free PMC article.
-
Impact of velocity- and acceleration-compensated encodings on signal dropout and black-blood state in diffusion-weighted magnetic resonance liver imaging at clinical TEs.PLoS One. 2023 Oct 5;18(10):e0291273. doi: 10.1371/journal.pone.0291273. eCollection 2023. PLoS One. 2023. PMID: 37796773 Free PMC article.
-
Spectral principal axis system (SPAS) and tuning of tensor-valued encoding for microscopic anisotropy and time-dependent diffusion in the rat brain.Imaging Neurosci (Camb). 2025 Jun 11;3:IMAG.a.35. doi: 10.1162/IMAG.a.35. eCollection 2025. Imaging Neurosci (Camb). 2025. PMID: 40800797 Free PMC article.
-
Cardiac diffusion-weighted and tensor imaging: A consensus statement from the special interest group of the Society for Cardiovascular Magnetic Resonance.J Cardiovasc Magn Reson. 2025 Summer;27(1):101109. doi: 10.1016/j.jocmr.2024.101109. Epub 2024 Oct 22. J Cardiovasc Magn Reson. 2025. PMID: 39442672 Free PMC article.
-
In vivo diffusion MRI of the human heart using a 300 mT/m gradient system.Magn Reson Med. 2024 Sep;92(3):1022-1034. doi: 10.1002/mrm.30118. Epub 2024 Apr 22. Magn Reson Med. 2024. PMID: 38650395 Free PMC article.
References
-
- Das A, Chowdhary A, Kelly C, et al. Insight into myocardial microstructure of athletes and hypertrophic cardiomyopathy patients using diffusion tensor imaging. J Magn Reson Imaging. 2021;53:73‐82. - PubMed
-
- Das A, Kelly C, Teh I, et al. Acute microstructural changes after ST‐segment elevation myocardial infarction assessed with diffusion tensor imaging. Radiology. 2021;299:86‐96. - PubMed
