Comment
. 2023 Feb 9;5(2):fcad027.
doi: 10.1093/braincomms/fcad027. eCollection 2023.

The architecture of abnormal reward behaviour in dementia: multimodal hedonic phenotypes and brain substrate

Affiliations
Comment

The architecture of abnormal reward behaviour in dementia: multimodal hedonic phenotypes and brain substrate

Anthipa Chokesuwattanaskul et al. Brain Commun. .

Abstract

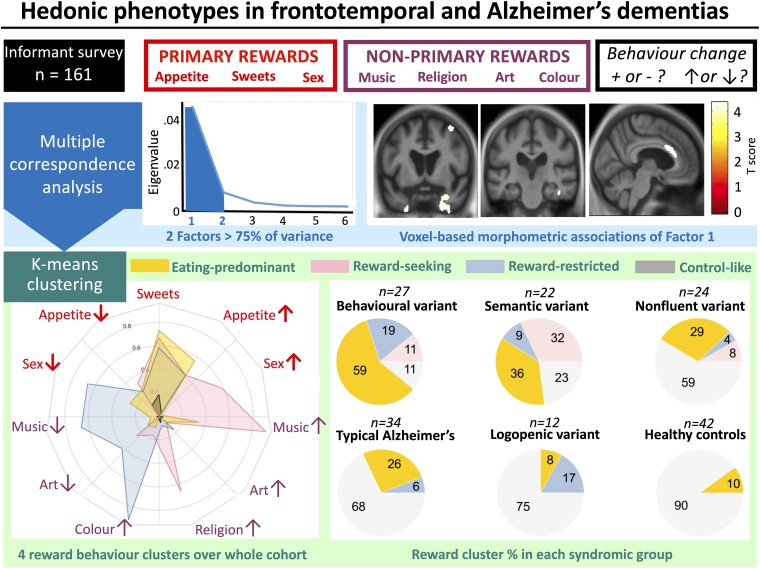
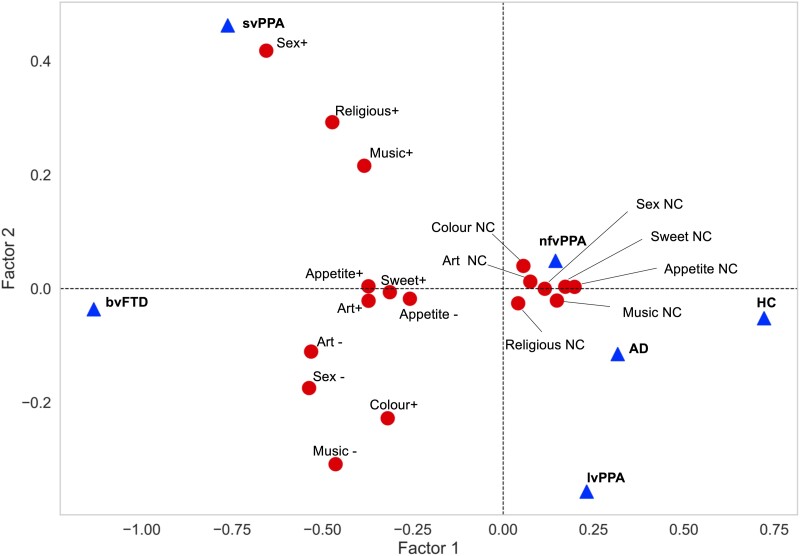
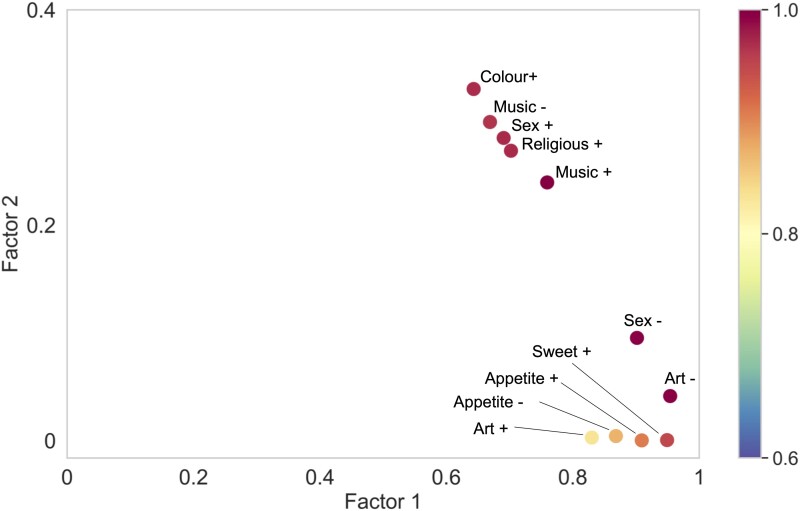
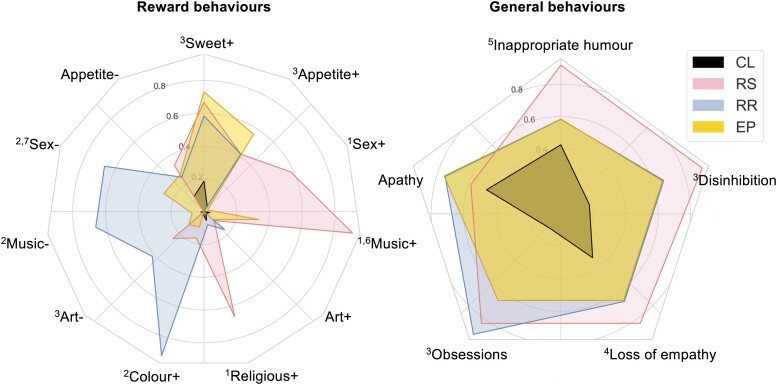
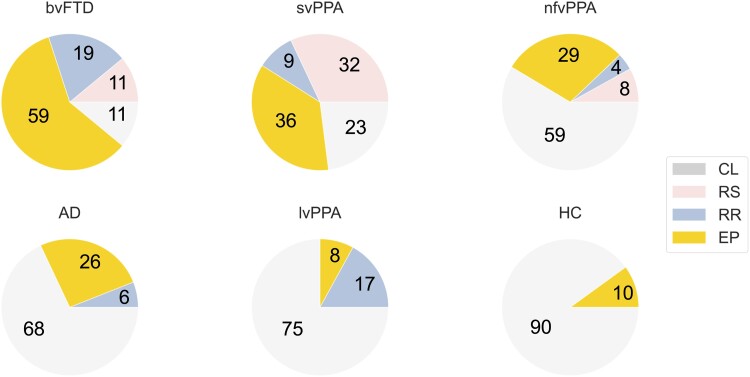
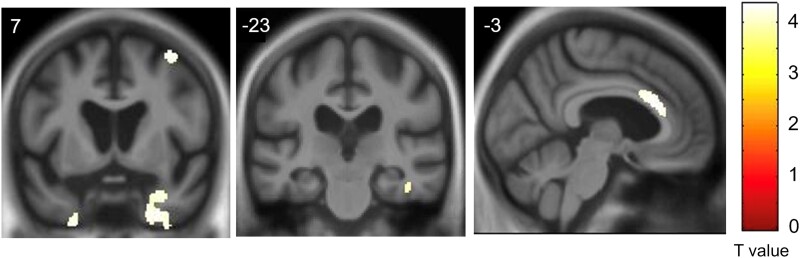
Abnormal reward processing is a hallmark of neurodegenerative diseases, most strikingly in frontotemporal dementia. However, the phenotypic repertoire and neuroanatomical substrates of abnormal reward behaviour in these diseases remain incompletely characterized and poorly understood. Here we addressed these issues in a large, intensively phenotyped patient cohort representing all major syndromes of sporadic frontotemporal dementia and Alzheimer's disease. We studied 27 patients with behavioural variant frontotemporal dementia, 58 with primary progressive aphasia (22 semantic variant, 24 non-fluent/agrammatic variant and 12 logopenic) and 34 with typical amnestic Alzheimer's disease, in relation to 42 healthy older individuals. Changes in behavioural responsiveness were assessed for canonical primary rewards (appetite, sweet tooth, sexual activity) and non-primary rewards (music, religion, art, colours), using a semi-structured survey completed by patients' primary caregivers. Changes in more general socio-emotional behaviours were also recorded. We applied multiple correspondence analysis and k-means clustering to map relationships between hedonic domains and extract core factors defining aberrant hedonic phenotypes. Neuroanatomical associations were assessed using voxel-based morphometry of brain MRI images across the combined patient cohort. Altered (increased and/or decreased) reward responsiveness was exhibited by most patients in the behavioural and semantic variants of frontotemporal dementia and around two-thirds of patients in other dementia groups, significantly (P < 0.05) more frequently than in healthy controls. While food-directed changes were most prevalent across the patient cohort, behavioural changes directed toward non-primary rewards occurred significantly more frequently (P < 0.05) in the behavioural and semantic variants of frontotemporal dementia than in other patient groups. Hedonic behavioural changes across the patient cohort were underpinned by two principal factors: a 'gating' factor determining the emergence of altered reward behaviour and a 'modulatory' factor determining how that behaviour is directed. These factors were expressed jointly in a set of four core, trans-diagnostic and multimodal hedonic phenotypes: 'reward-seeking', 'reward-restricted', 'eating-predominant' and 'control-like'-variably represented across the cohort and associated with more pervasive socio-emotional behavioural abnormalities. The principal gating factor was associated (P < 0.05 after correction for multiple voxel-wise comparisons over the whole brain) with a common profile of grey matter atrophy in anterior cingulate, bilateral temporal poles, right middle frontal and fusiform gyri: the cortical circuitry that mediates behavioural salience and semantic and affective appraisal of sensory stimuli. Our findings define a multi-domain phenotypic architecture for aberrant reward behaviours in major dementias, with novel implications for the neurobiological understanding and clinical management of these diseases.

Keywords: Alzheimer’s disease; frontotemporal dementia; primary progressive aphasia; reward; semantic dementia.


Conflict of interest statement

The authors report no conflict of interest.

Figures

Graphical abstract
Graphical abstract
Figure 1
Figure 1
Principal factors governing reward behavioural changes in the study cohort. The plot aligns reward behavioural response categories or ‘features’ aligned to principal factors for all 161 participants, based on an MCA of the reward symptom survey. Factor 1 is presented on the x-axis and factor 2 on the y-axis. The (x, y) coordinates of each reward survey response category or feature (dots) represent the factor score (in arbitrary units) of that feature for factor 1 and factor 2, respectively (see also Supplementary Table 4). The factor score quantifies the contribution of that feature to the factor. Increasing discrimination between features corresponds to increasing distance along each axis; the greater separation of features along the x-axis (note change of scale) indicates that factor 1 accounts for most of the variance in reward behavioural features in the participant cohort, discriminating presence from absence of altered reward behaviours. Altered responsiveness to sex, music, religion and colour are relatively well discriminated by factor 2 (y-axis). Reward features that aggregate tend to co-occur in the same participants or group of participants. Features that are more distant from the origin are less frequently reported and signify deviation from average cohort behaviour. Diagnostic group features are visualized in this plot as supplementary variables (triangles); their coordinates were derived by projecting them onto principal factors 1 and 2. The positioning of the bvFTD and HC diagnostic groups at opposite ends of the x-axis relates to their strong association with factor 1 (i.e. discriminating presence from absence of altered reward behaviours); the positioning of the svPPA and lvPPA groups at opposite ends of the y-axis relates to their strong association with factor 2 (i.e. discriminating the direction of altered reward behaviours). AD, patient group with typical Alzheimer’s disease; Appetite ±, appetite increased/decreased; Art ±, art responsiveness increased/decreased; bvFTD, patient group with behavioural variant frontotemporal dementia; Colour +, increased responsiveness to colours; HC: healthy control group; lvPPA, patient group with logopenic variant primary progressive aphasia; Music ±, music responsiveness increased/decreased; NC, no change; nfvPPA, patient group with non-fluent/agrammatic variant primary progressive aphasia; Religious +, increased religiosity; Sex ±, libido increased/decreased; svPPA, semantic variant primary progressive aphasia; Sweet +, increased sweet tooth.
Figure 2
Figure 2
Correlation of principal reward factors with reward behavioural changes. The plot shows the squared cosine values of each reward feature with the two principal reward factors, extracted from the MCA (n = 161 participants). The (x, y) coordinates here represent the squared cosines of each reward feature on factor 1 and factor 2, respectively; note change of scale between axes (see also Supplementary Table 4). The bar on the right codes the sum of squared cosines of factor 1 and 2 for each feature. The squared cosine value quantifies how strongly a feature is associated with a particular factor; it is related to distance along the factor axis from the origin in Fig. 1. Features with higher correlation values are better segregated from the ‘average’ feature profile of the study cohort by that factor. Appetite ±, appetite increased/decreased; Art ±, art responsiveness increased/decreased; Colour +, increased responsiveness to colours; Music ±, music responsiveness increased/decreased; Religious +, increased religiosity; Sex ±, libido increased/decreased; Sweet +, increased sweet tooth.
Figure 3
Figure 3
Characteristics of reward behavioural phenotypic clusters. Radar plots depict the four reward behavioural phenotypic clusters in the combined patient cohort (n = 119 participants), the ‘reward-seeking’ (RS) cluster, the ‘reward-restricted’ (RR) cluster, the ‘eating-predominant’ (EP) cluster and the ‘control-like’ cluster (CL). Behavioural changes of interest are plotted around the circumference; concentric circles represent the proportion of participants exhibiting that change in each cluster (plotted along the radius). The left panel shows the proportion of participants in each cluster with particular reward features; the right panel shows the proportion of participants in each cluster with more general socio-emotional behavioural changes. Pair-wise comparisons between clusters using the chi-square test with post hoc correction (PFDR < 0.05) are coded as follows: 1RS > RR, EP, CL; 2RR > RS, EP CL;3RS, RR, EP > CL; 4RS, EP > CL; 5RS > CL; 6EP > RR, CL; 7EP > CL (see also Supplementary Tables 6 and 7). Appetite ±, appetite increased/decreased; Art ±, art responsiveness increased/decreased; Colour +, increased responsiveness to colours; Music ±, music responsiveness increased/decreased; CL, ‘control-like’ cluster; Religious +, increased religiosity; RR, ‘reward-restricted’ cluster; RS, ‘reward-seeking’ cluster; SC, ‘subtle change’ cluster; Sex ±, libido increased/decreased; Sweet +, increased sweet tooth.
Figure 4
Figure 4
Distribution of reward phenotypic clusters in dementia syndromes. Pie charts show the percentage of cases exhibiting each reward behavioural phenotypic cluster (see Fig. 3) in each diagnostic group. The number of participants in each diagnostic group was as follows: 27 bvFTD, 34 AD, 12 lvPPA, 22 svPPA, 24 nfvPPA and 42 HC. AD, patient group with typical Alzheimer’s disease; bvFTD, patient group with behavioural variant frontotemporal dementia; CL, ‘control-like’ cluster; EP, ‘eating-predominant’ cluster; HC, healthy control group; lvPPA, patient group with logopenic variant primary progressive aphasia; nfvPPA, patient group with non-fluent/agrammatic variant primary progressive aphasia; RR, ‘reward-restricted’ cluster; RS, ‘reward-seeking’ cluster; svPPA, semantic variant primary progressive aphasia.
Figure 5
Figure 5
Neuroanatomical substrate of abnormal reward behaviour. Grey matter associations of the leading reward factor (factor 1) in the combined patient cohort were derived from a VBM analysis of patients’ brain MRI images (n = 96 scans; see text and Table 2 for details). Grey matter clusters were significantly associated with the factor at P < 0.05 after family-wise error correction over the whole brain. Statistical parametric maps have been rendered on coronal (left and middle) and sagittal (right) sections of the group mean template T1-weighted MRI brain image. Coordinates in Montreal Neurological Institute space are given for each section. A bar on the right shows the corresponding voxel-wise T-values. The right hemisphere is displayed on the right in the coronal sections.

Comment on

References

    1. Schultz W. Neuronal reward and decision signals: From theories to data. Physiol Rev. 2015;95(3):853–951. - PMC - PubMed
    1. Perry DC, Kramer JH. Reward processing in neurodegenerative disease. Neurocase. 2015;21(1):120–133. - PMC - PubMed
    1. Sivasathiaseelan H, Marshall CR, Agustus JL, et al. . Frontotemporal dementia: A clinical review. Semin Neurol. 2019;39(2):251–263. - PubMed
    1. Chiong W, Wood KA, Beagle AJ, et al. . Neuroeconomic dissociation of semantic dementia and behavioural variant frontotemporal dementia. Brain. 2016;139(Pt 2):578–587. - PMC - PubMed
    1. Perry DC, Datta S, Sturm VE, et al. . Reward deficits in behavioural variant frontotemporal dementia include insensitivity to negative stimuli. Brain. 2017;140(12):3346–3356. - PMC - PubMed

LinkOut - more resources