. 2023 Jul;29(7):1750-1761.
doi: 10.1111/cns.14145. Epub 2023 Mar 21.

Effects of memantine on mania-like phenotypes exhibited by Drosophila Shaker mutants

Affiliations

Effects of memantine on mania-like phenotypes exhibited by Drosophila Shaker mutants

Ignazia Mocci et al. CNS Neurosci Ther. 2023 Jul.

Abstract

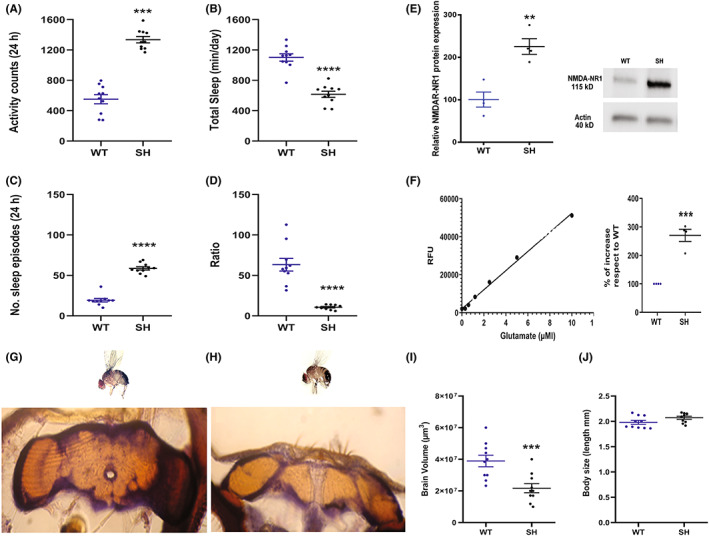
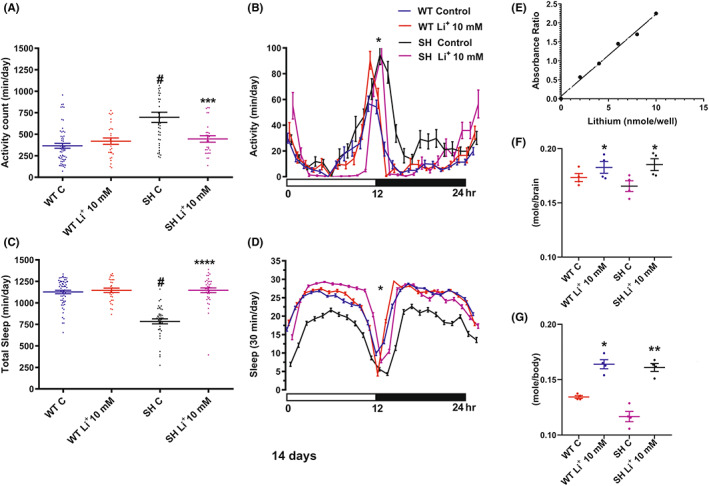
Introduction: Increased glutamate levels and electrolytic fluctuations have been observed in acutely manic patients. Despite some efficacy of the non-competitive NMDA receptor antagonist memantine (Mem), such as antidepressant-like and mood-stabilizer drugs in clinical studies, its specific mechanisms of action are still uncertain. The present study aims to better characterize the Drosophila melanogaster fly Shaker mutants (SH), as a translational model of manic episodes within bipolar disorder in humans, and to investigate the potential anti-manic properties of Mem.

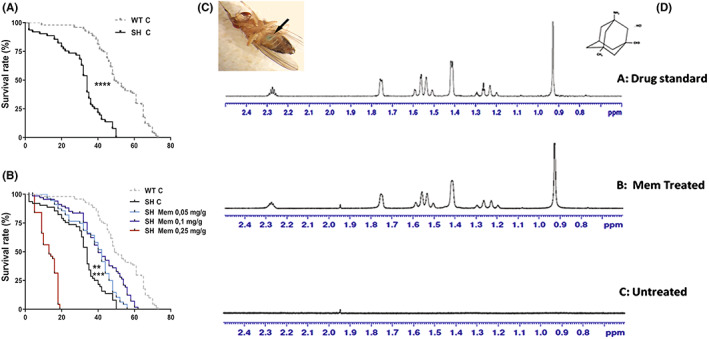
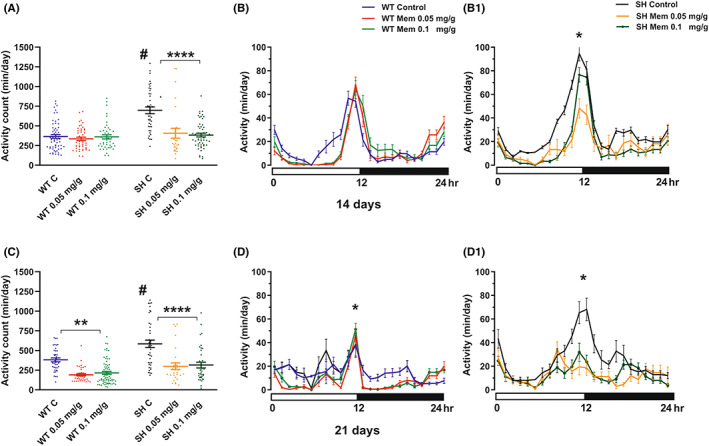
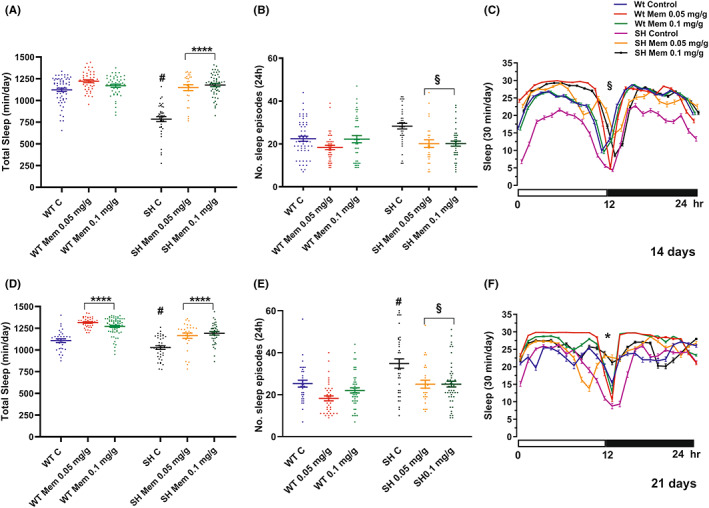
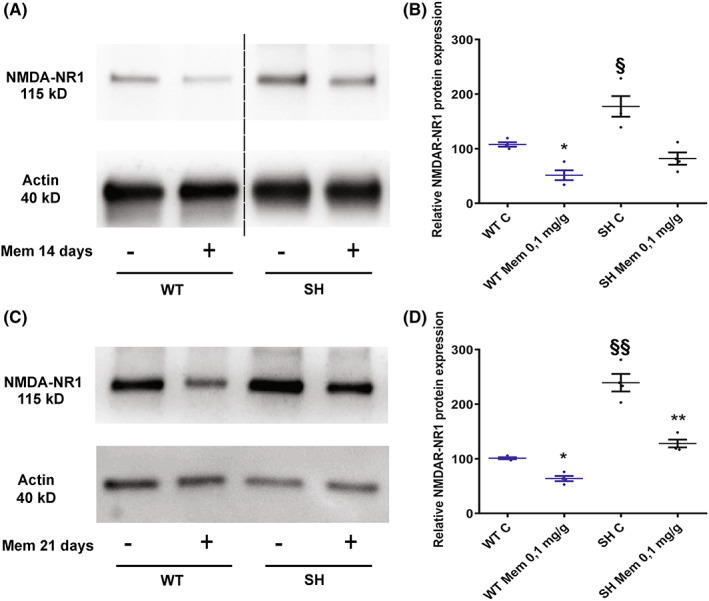
Methods and results: Our findings showed typical behavioral abnormalities in SH, which mirrored with the overexpression of NMDAR-NR1 protein subunit, matched well to glutamate up-regulation. Such molecular features were associated to a significant reduction of SH brain volume in comparison to Wild Type strain flies (WT). Here we report on the ability of Mem treatment to ameliorate behavioral aberrations of SH (similar to that of Lithium), and its ability to reduce NMDAR-NR1 over-expression.

Conclusions: Our results show the involvement of the glutamatergic system in the SH, given the interaction between the Shaker channel and the NMDA receptor, suggesting this model as a promising tool for studying the neurobiology of bipolar disorders. Moreover, our results show Mem as a potential disease-modifying therapy, providing insight on new mechanisms of action.

Keywords: Drosophila; Shaker channel; NMDA receptor; bipolar disorder; glutamate; memantine.


Conflict of interest statement

There are no conflicts among the authors.

Figures

FIGURE 1
FIGURE 1
Graphs illustrate the activity (A), total sleep (B), sleep episodes (C) and ratio (D) at time zero in naïve SH and WT flies and represent the mean ± SEM (24 h recording). Ratio was calculated as total time spent asleep and number of sleep episodes. ****p < 0.0001 and ***p < 0.001 in SH versus WT (Student's t test). (E) NMDA‐NR1 expression in SH and WT naïve flies by Western blot analysis, semiquantitative protein expression was calculated as a ratio to β‐actin. The values are the mean ± SEM of four experiments. **p < 0.01 (Mann–Whitney test). (F) Detection of glutamate in SH and WT brains by RFU standard curve and percentage of increase with respect to WT. ***p < 0.001 (unpaired t‐test). Morphometric analysis of brain and body flies. (G, H) micrographs (20×) showing WT and SH brain sections stained with Nissl. Volume and body size of SH and WT brains (I, J). ***p < 0.001 (Student's t‐test).
FIGURE 2
FIGURE 2
Lifespan in untreated WT and SH flies (A) and upon Mem administration at three different concentrations (B). Survival curves data are expressed as mean ± SEM. ****p < 0.0001 between SH and WT flies and between SH treated with Mem 0.1 mg/g‐diet and SH controls, ***p < 0.01 between SH treated with Mem 0.1 mg/g‐diet and SH controls **p < 0.01 between SH treated with Mem 0.05 mg/g‐diet and SH controls (Kaplan–Meier survival curves; Gehan‐Breslow‐Wilcoxon test). Blue abdomen (arrow) of Dm reared on Mem medium/blue food dye (C). (D) Overlay of 1‐H‐NMR spectra of Mem hydrochloride (0.1 mg/g‐diet) from drug standard (A) Mem‐treated (B) and untreated SH brains (C).
FIGURE 3
FIGURE 3
Effect of Mem treatment on activity. Graphs represent values expressed as mean ± SEM in 24 h activity recording after 14 days (A) and 21 days (C) of treatment. Graphs B‐B1 and D‐D1 illustrate the 24 h time–course activity in WT and SH flies after 14 and 21 days of Mem treatment, respectively. # p < 0.001 in SH control versus WT control group and ****p < 0.0001 between SH treated versus SH control group; **p < 0.01 in WT Mem treated versus WT control and *p < 0.05 in SH treated versus SH control (Tukey's multiple comparisons).
FIGURE 4
FIGURE 4
Effect of Mem treatment on total sleep and No. of sleep episodes. Graph values for total sleep (A–D) and No. of sleep episodes (B–E) are expressed as mean ± SEM in 24 h recording at 14 and 21 days of Mem‐treatment. Graphs C (14 days) and F (21 days) illustrate the daily time course (intervals of 30‐min) of the amount of sleep in treated and untreated WT and SH. # p < 0.001 in SH control versus WT control group; ****p < 0.0001 between SH and WT treated versus respective controls; § p < 0.05 SH treated versus control, *p < 0.05 SH and WT treated versus respective controls (Tukey's multiple comparisons test).
FIGURE 5
FIGURE 5
Graphs (A) and (C) illustrate the activity recording and the total sleep expressed as mean ± SEM (24 h) after 14 days of Li+‐treatment; (B) and (D) the daily time course in the amount of activity and sleep (30‐min interval) in 14 days Li+‐treated and untreated WT and SH. ****p < 0.0001 versus SH control; ***p < 0.001 versus SH control, # p < 0.001 versus WT group; *p < 0.05 between SH treated and respective control (Tukey's multiple comparisons test). Graph (E) represents the standard curve (ratio of the optical measurement), (F, G) depict Li+ concentration in brain and body respectively after Li+ (10 mMol) 14 days treatment. **p < 0.01 and *p < 0.05 WT and SH treated versus respective control (Tukey's multiple comparisons test).
FIGURE 6
FIGURE 6
Western blotting of NMDA‐NR1 in Mem‐treated and untreated SH and WT brain flies. Representative Western blots from WT and SH flies after 14 (A) and 21 (C) days of 0.1 mg/g‐diet Mem treatment and controls. The dashed line in (A) indicates that unrelated lanes have been removed between samples. The graphs represent the expression of NMDA‐NR1 at 14 (B) and 21 (D) days of treatment and control group. The values are expressed as mean ± SEM of four experiments. *p < 0.05, **p < 0.01 mem‐treated versus controls flies. § p < 0.05, §§ p < 0.01 SH versus WT both untreated (Mann–Whitney‐test).

References

    1. Fan X, Jin WY, Wang YT. The NMDA receptor complex: a multifunctional machine at the glutamatergic synapse. Front Cell Neurosci. 2014;8:160. - PMC - PubMed
    1. Lau CG, Zukin RS. NMDA receptor trafficking in synaptic plasticity and neuropsychiatric disorders. Nat Rev Neurosci. 2007;8:413‐426. - PubMed
    1. de Bartolomeis A, Buonaguro EF, Iasevoli F, Tomasetti C. The emerging role of dopamine–glutamate interaction and of the postsynaptic density in bipolar disorder pathophysiology: implications for treatment. J Psychopharmacol. 2014;28:505‐526. - PubMed
    1. APA Work Group on Psychiatric Evaluation . The American Psychiatric Association practice guidelines for the psychiatric evaluation of adults / APA. 3rd ed. Work Group on Psychiatric Evaluation, Joel J. Silverman, chair [and eleven others]. American Psychiatric Association; 2016.
    1. Sepede G, Chiacchiaretta P, Gambia F, et al. Bipolar disorder with and without a history of psychotic features: fMRI correlates of sustained attention. Prog Neuropsychopharmacol Biol Psychiatry. 2020;98:109817. - PubMed

Publication types

LinkOut - more resources