

Microbial Drivers of Plant Performance during Drought Depend upon Community Composition and the Greater Soil Environment
- PMID: 36943043
- PMCID: PMC10101012
- DOI: 10.1128/spectrum.01476-22
Microbial Drivers of Plant Performance during Drought Depend upon Community Composition and the Greater Soil Environment
Abstract
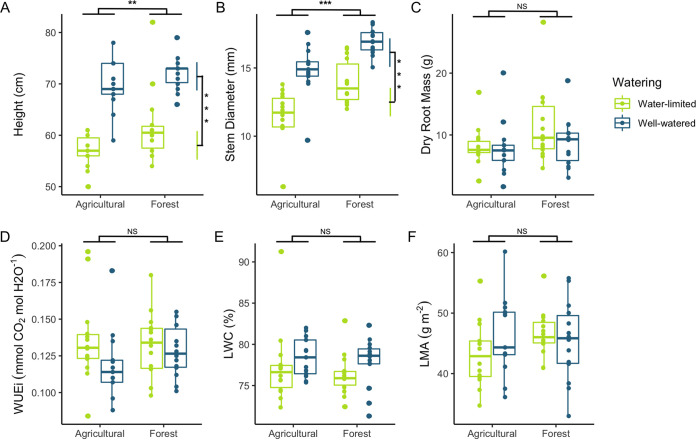
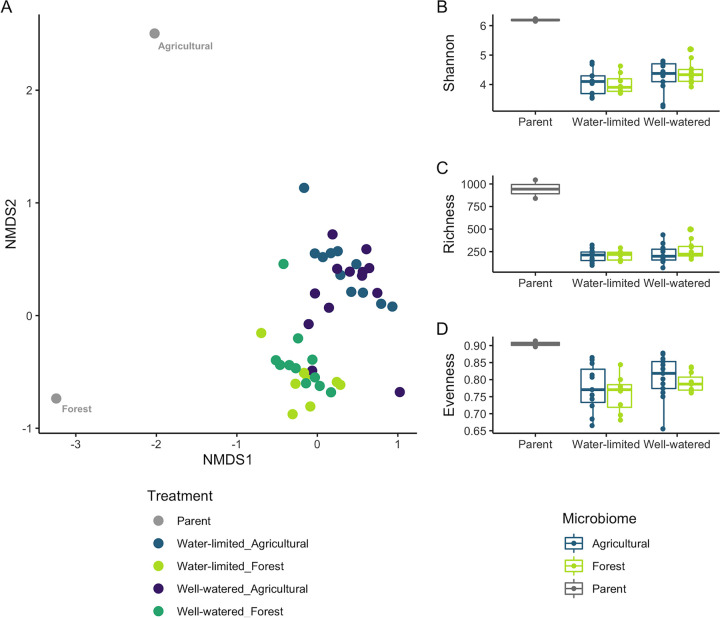
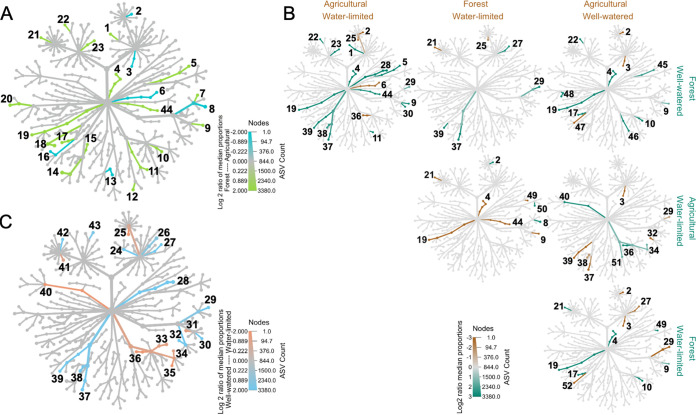
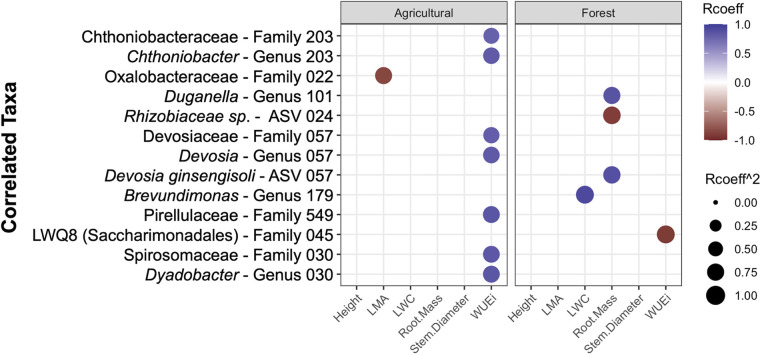
The increasing occurrence of drought is a global challenge that threatens food security through direct impacts to both plants and their interacting soil microorganisms. Plant growth promoting microbes are increasingly being harnessed to improve plant performance under stress. However, the magnitude of microbiome impacts on both structural and physiological plant traits under water limited and water replete conditions are not well-characterized. Using two microbiomes sourced from a ponderosa pine forest and an agricultural field, we performed a greenhouse experiment that used a crossed design to test the individual and combined effects of the water availability and the soil microbiome composition on plant performance. Specifically, we studied the structural and leaf functional traits of maize that are relevant to drought tolerance. We further examined how microbial relationships with plant phenotypes varied under different combinations of microbial composition and water availability. We found that water availability and microbial composition affected plant structural traits. Surprisingly, they did not alter leaf function. Maize grown in the forest-soil microbiome produced larger plants under well-watered and water-limited conditions, compared to an agricultural soil community. Although leaf functional traits were not significantly different between the watering and microbiome treatments, the bacterial composition and abundance explained significant variability in both plant structure and leaf function within individual treatments, especially water-limited plants. Our results suggest that bacteria-plant interactions that promote plant performance under stress depend upon the greater community composition and the abiotic environment. IMPORTANCE Globally, drought is an increasingly common and severe stress that causes significant damage to agricultural and wild plants, thereby threatening food security. Despite growing evidence of the potential benefits of soil microorganisms on plant performance under stress, decoupling the effects of the microbiome composition versus the water availability on plant growth and performance remains a challenge. We used a highly controlled and replicated greenhouse experiment to understand the impacts of microbial community composition and water limitation on corn growth and drought-relevant functions. We found that both factors affected corn growth, and, interestingly, that individual microbial relationships with corn growth and leaf function were unique to specific watering/microbiome treatment combinations. This finding may help explain the inconsistent success of previously identified microbial inocula in improving plant performance in the face of drought, outside controlled environments.
Keywords: Plant microbiome; drought; microbial composition; plant growth; plant-microbe interactions; soil ecology.
Conflict of interest statement
The authors declare no conflict of interest.
Figures
Similar articles
-
Phyllosphere Community Assembly and Response to Drought Stress on Common Tropical and Temperate Forage Grasses.Appl Environ Microbiol. 2021 Aug 11;87(17):e0089521. doi: 10.1128/AEM.00895-21. Epub 2021 Aug 11. Appl Environ Microbiol. 2021. PMID: 34161142 Free PMC article.
-
Soil microbes alter plant fitness under competition and drought.J Evol Biol. 2019 May;32(5):438-450. doi: 10.1111/jeb.13426. Epub 2019 Feb 27. J Evol Biol. 2019. PMID: 30739360
-
Cultivar-specific dynamics: unravelling rhizosphere microbiome responses to water deficit stress in potato cultivars.BMC Microbiol. 2023 Dec 1;23(1):377. doi: 10.1186/s12866-023-03120-4. BMC Microbiol. 2023. PMID: 38036970 Free PMC article.
-
Interactions between plants and soil shaping the root microbiome under abiotic stress.Biochem J. 2019 Oct 15;476(19):2705-2724. doi: 10.1042/BCJ20180615. Biochem J. 2019. PMID: 31654057 Free PMC article. Review.
-
Crop microbiome: their role and advances in molecular and omic techniques for the sustenance of agriculture.Planta. 2022 Dec 30;257(2):27. doi: 10.1007/s00425-022-04052-5. Planta. 2022. PMID: 36583789 Review.
Cited by
-
The rhizosphere of a drought-tolerant plant species in Morocco: A refuge of high microbial diversity with no taxon preference.Environ Microbiol Rep. 2024 Jun;16(3):e13254. doi: 10.1111/1758-2229.13254. Environ Microbiol Rep. 2024. PMID: 38725134 Free PMC article.
References
-
- Schimel JP. 2018. Life in dry soils: effects of drought on soil microbial communities and processes. Annu Rev of Ecology, Evolution, and Systematics 49:409–432. doi:10.1146/annurev-ecolsys-110617-062614. - DOI
-
- Ciríaco da Silva E, Nogueira RJMC, Almeida da Silva M, Bandeira de Albuquerque M. 2011. Drought stress and plant nutrition. Plant Stress 5:32–41.
-
- Corwin DL. 2020. Climate change impacts on soil salinity in agricultural areas. European J Soil Science 72:842–862. doi:10.1111/ejss.13010. - DOI
LinkOut - more resources
Full Text Sources
