. 2023 Jun 5;220(6):e20221020.
doi: 10.1084/jem.20221020. Epub 2023 Mar 21.

Human PIK3R1 mutations disrupt lymphocyte differentiation to cause activated PI3Kδ syndrome 2

Affiliations

Human PIK3R1 mutations disrupt lymphocyte differentiation to cause activated PI3Kδ syndrome 2

Tina Nguyen et al. J Exp Med. .

Abstract

Heterozygous loss-of-function (LOF) mutations in PIK3R1 (encoding phosphatidylinositol 3-kinase [PI3K] regulatory subunits) cause activated PI3Kδ syndrome 2 (APDS2), which has a similar clinical profile to APDS1, caused by heterozygous gain-of-function (GOF) mutations in PIK3CD (encoding the PI3K p110δ catalytic subunit). While several studies have established how PIK3CD GOF leads to immune dysregulation, less is known about how PIK3R1 LOF mutations alter cellular function. By studying a novel CRISPR/Cas9 mouse model and patients' immune cells, we determined how PIK3R1 LOF alters cellular function. We observed some overlap in cellular defects in APDS1 and APDS2, including decreased intrinsic B cell class switching and defective Tfh cell function. However, we also identified unique APDS2 phenotypes including defective expansion and affinity maturation of Pik3r1 LOF B cells following immunization, and decreased survival of Pik3r1 LOF pups. Further, we observed clear differences in the way Pik3r1 LOF and Pik3cd GOF altered signaling. Together these results demonstrate crucial differences between these two genetic etiologies.


Conflict of interest statement

Disclosures: A. Lau reported being an employee of AstraZeneca since January 2023. J. Bier reported being an employee of Takeda Pharmaceutical since September 2022. R.S. Abraham reported personal fees from Enzyvant Therapeutics, Horizon Pharma, Beckman Coulter, and ClinGen outside the submitted work. C. Burkhart reported being an employee and shareholder of Novartis Pharma AG. Leniolisib is a p110δ-specific inhibitor and was discovered and developed by Novartis Pharma AG. Leniolisib was provided in 2016 to S.G. Tangye for studies described in the manuscript. Leniolisib was outlicensed to Pharming Group N.V. in 2019. S.G. Tangye reported being on the Pharming Group NV Global Advisory Board for the use of leniolisib to treat individuals with inborn errors of immunity due to mutations in PIK3CD or PIK3R1. Pharming has licensed leniolisib from Novartis as a therapy for these conditions. E.K. Deenick reported “other” from CSL outside the submitted work. No other disclosures were reported.

Figures
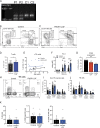
Figure S1.
Figure S1.
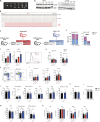
Extended phenotyping of PIK3R1 LOF patients. (A) PCR for exon 11 flanking region of PIK3R1 was performed on cDNA from healthy donors (C1, 2) and PIK3R1 LOF PBMCs (P1, 2). (B and C) Mononuclear cells isolated from BM aspirates of healthy donors (n = 9), PIK3R1 LOF (n = 2), PIK3CD GOF (n = 3), and X-linked agammaglobulinemia (n = 1) patients were stained to identify distinct B cell subpopulations. Contour plots show CD34 versus CD10 staining used to identify pro-B cells in (B) a representative healthy donor and (C) a PIK3R1 LOF patient. B cells were further analyzed by CD10 and CD20 to identify pro-B, pre-BI, pre-BII, immature, and recirculating mature B cells. (D–J) PBMCs from healthy controls (n = 11–42) and PIK3R1 LOF patients (n = 4–10) were stained to determine (D) proportion of T cells (CD3+) within the lymphocyte population, (E) percentage of cTfh cells at different ages, (F) expression of PD-1 on naïve, non-Tfh memory, and Tfh cells. The CD4+ T cell compartment was also analyzed for percentage of (G) CD25+ cells within the CD4+FoxP3+ Treg population. (H) CXCR3 vs. CCR6 gating on Tfh cells from a representative healthy control and PIK3R1 LOF patient. (I and J) Graphs show proportions of cells with a Th1 (CXCR3+CCR6), CXCR3CCR6, Th17 (CXCR3CCR6+), Th1/Th17 (CXCR3+CCR6+) phenotype within the (I) non-Tfh memory and (J) Tfh populations in controls and PIK3R1 LOF patients. (K) The proportion of total natural killer (NK) cells and CD56 bright and CD56 dim NK cells. Each point represents a different individual, bars give mean ± SEM. Statistical significance was determined by Mann–Whitney test except G, which used a Kruskal–Wallis test, *P < 0.05, **P < 0.01, ***P < 0.001, ****P < 0.0001. Source data are available for this figure: SourceData FS1.
Figure 1.
Figure 1.
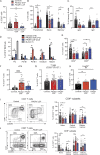
Phenotype of lymphocytes in PIK3R1 LOF patients. (A–D) PBMCs from healthy donors (n = 46–55) and PIK3R1 LOF patients (n = 5–11) were stained to determine the proportions of (A) B cells (CD20+); (B) transitional (CD10+CD27), naïve (CD10CD27), and memory (CD10CD27+) B cells; (C) IgG+ or IgA+ switched memory B cells; (D) mononuclear cells isolated from BM aspirates from healthy donors (n = 9), PIK3R1 LOF (n = 2), PIK3CD GOF (n = 3), and X-linked agammaglobulinemia (XLA; n = 1) patients were stained to identify distinct B cell subpopulations. (E–H) Frequencies of BM B cell subsets are shown. PBMCs were stained to determine the proportions of (E) CD4+ or CD8+ T cells; (F) Tfh cells; and (G) Tregs defined as CD127loCD25hi and (H) Total FoxP3+ cells. (I and J) Proportions of naïve (CD45RA+CCR7+), TCM (CD45RACCR7+), TEM (CD45RACCR7) and/or effector memory cells re-expressing CD45RA (CD45RA+CCR7) within the (I) CD4+ T cell compartment and (J) CD8+ T cell compartment were determined. Points show each individual analyzed as well as mean ± SEM and include previously published data for PIK3CD GOF patients (n = 19–39; Avery et al., 2018; Bier et al., 2019; Edwards et al., 2019), except FoxP3 staining which has not been published before. Statistical significance was determined by Kruskal–Wallis test, *P < 0.05, **P < 0.01, ***P < 0.001, ****P < 0.0001.
Figure S2.
Figure S2.
Generation and analysis of Pik3r1 LOF mice. (A) PCR for exon 11 flanking region of Pik3r1 was performed on cDNA from WT and Pik3r1 LOF splenocytes. (B) Lower bands from Pik3r1 LOF in A were sequenced to confirm deletion of exon 11. WT bands are shown for comparison. (C) Western blotting for p85α was performed on whole-cell lysates from WT and Pik3r1 LOF splenocytes or thymus. Vinculin is included as a loading control. (D–F) Offspring from Pik3cd GOF breeding pairs and Pik3r1 LOF breeding pairs were assessed for their genotype. (D) Setup of Pik3cd GOF and Pik3r1 LOF breeding pairs and expected genotypes of offspring—a 1:1 ratio of WT:mutant offspring is expected. (E) Numbers of WT, Pik3cd GOF, and Pik3r1 LOF offspring from their respective breeding pairs. Significant differences of observed versus expected were calculated using GraphPad Prism, ****P < 0.001. (F) Sorted follicular B cells were intracellularly stained for phosphorylated S6 at a resting state. Graphs show pS6 mean fluoresence intensity (MFI) normalized to WT levels, or % pS6+ cells for each genotype. Each point represents B cells isolated from a separate mouse, bars give mean ± SEM, n = 4. Histograms show representative expression of p-S6. (G–I) BM from young (9–12 wk) WT, Pik3cd GOF, and Pik3r1 LOF mice were stained to identify different B cell populations by flow cytometric analysis. (G) Percentages of IgM+ IgDlow, IgDhigh, and IgM IgD B cells. (H and I) Representative pseudocolor plots gated on IgM IgD cells and percentages of pre-pro (CD43high CD24low), pro (CD43mid CD24high), and pre (CD43low CD24high) B cells. Graphs in G–I show mean ± SEM, each point represents a different animal, n = 10–15 per group. Significant differences were determined by one-way ANOVA, *P < 0.05, **P < 0.01, ***P < 0.001. (J)  Spleens from old (30–45 wk) WT and Pik3r1 LOF mice were stained to identify different lymphocyte populations by flow cytometric analysis. Percentages of naïve, central memory, effector memory, Tfh (n = 11 WT, 7 Pik3r1 LOF), and Treg CD4+T cells (mean ± SEM, n = 8 WT, 10 Pik3r1 LOF); each point represents a different animal; mean ± SEM are shown in bar graphs. (K–M) Spleens from young (9–12 wk) WT and Pik3r1 LOF mice were stained to identify Treg population (CD4+FoxP3+) or CD8+ T cells by flow cytometric analysis. (K) Frequencies of Tregs within CD4+T cells are shown. (L) Frequency of CD25+ and CD25 Treg populations are depicted in the graph. Graphs in show mean ± SEM, n = 6 per group, each point represents a different animal. (M) Spleens from old (30–45 wk) WT and Pik3r1 LOF mice were stained to identify different lymphocyte populations by flow cytometric analysis. Percentages of naïve, central memory, effector memory CD8+T cells shown in bar graphs. Mean ± SEM, n = 7–11. Significant differences were determined by unpaired Students t tests, *P < 0.05. (N) Thymic development was assessed in young (9–12 wk) WT, Pik3cd GOF, and Pik3r1 LOF mice. Bar graphs represent the frequencies of double negative (DN), double positive (DP), CD4+ single positive, and CD8+ single positive cells. Graphs show mean ± SEM, n = 9–10 per group. Significant differences were determined by one-way ANOVA, *P < 0.05, **P < 0.01. Source data are available for this figure: SourceData FS2.
Figure 2.
Figure 2.
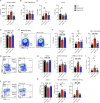
Phenotype of lymphocytes in Pik3r1 LOF mice. Spleens from young (9–12 wk) WT, Pik3cd GOF, and Pik3r1 LOF mice were stained to identify different lymphocyte populations by flow cytometric analysis. (A) Absolute number of B cells in the spleen. (B) Percentage of total transitional (B220+ CD93+) B cells. (C) Percentages of T1 (CD23) and T2/T3 (CD23+) transitional B cells. (D) Percentage of mature (B220+CD93) B cells. (E and F) Representative pseudocolor plots gated on WT or Pik3r1 LOF mature B cells (E) with the percentages of mature B cell subsets, including follicular (CD21highCD23high), marignal zone (MZ; CD21highCD23low), and CD21 CD23 double-negative (DN) B cells shown in bar graphs (F). (G and H) Representative pseudocolor plots gated on WT or Pik3r1 LOF CD4+ T cells (G) with the percentages of naïve (CD62LhiCD44lo), central memory (CD62LhiCD44hi), and effector memory (CD62LloCD44hi) CD4+T cells show in in bar graphs (H). (I) Percentage of CD4+Tfh population within CD4+T cells. (J and K) Representative pseudocolor plots gated on WT or Pik3r1 LOF CD8+ T cells (J) with the percentages of naïve (CD62LhiCD44lo), central memory (CD62LhiCD44hi), and effector memory (CD62LloCD44hi) CD8+T cells show in bar graphs (K). All graphs show individual points for each mouse and mean ± SEM, n = 10–15 per group. Significant differences were determined by one-way ANOVA, *P < 0.05, **P < 0.01, ***P < 0.001, ****P < 0.0001.
Figure 3.
Figure 3.
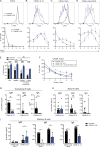
Human PIK3R1 LOF B cells have altered proliferation and Ig class switching in vitro. (A–D) Naïve B cells from healthy donors (n = 13–18) and PIK3R1 LOF patients (n = 2–3) were CFSE-labeled and cultured for 4 d with (A) CD40L alone or together with (B) IL-21, (C) CpG, or (D) CpG and SAC, a BCR agonist. Cells were harvested after 4 d and labeled with Zombie Aqua, followed by flow cytometric analysis. Histograms overlay CFSE dilution of B cells from a healthy donor (black dotted line) and a PIK3R1 LOF patient (blue line) from one representative experiment. Graphs below summarize CFSE dilution analysis for naïve B cells from healthy donors (n = 13–18) and PIK3R1 LOF patients (n = 3), showing the frequency of cells in each division interval. Data combined from three independent experiments. (E and F) Naïve (CD27CD10) or CD27 B cells from healthy donors (n = 3–6) and PIK3R1 LOF patients (n = 2) were cultured with CD40L and CpG in the absence or presence of two different concentrations of leniolisib. DMSO was added as a control. CFSE dilution analysis of control and PIK3R1 LOF B cells treated with 0.3 μM leniolisib shown as frequency of cells in each division interval. Each point represents a different individual, data combined from two independent experiments, bars represent mean ± SEM. Statistical significance was determined by Mann–Whitney tests, **P < 0.01, ****P < 0.0001. (G–I) Sort-purified (G) transitional, (H) naïve, and (I) unswitched memory B cells from healthy donors (n = 5–15) and PIK3R1 LOF patients (n = 3–6) were cultured with CD40L together with IL-21, or CpG and SAC. After 7 d, the amount of IgM, IgG, and IgA secreted into the culture supernatant was measured by ELISA. Each point represents a different individual, results combined from at least three independent experiments, bars show median and interquartile ranges. Statistical significance was determined by Mann–Whitney tests, *P < 0.05, **P < 0.01.
Figure S3.
Figure S3.
Responses of Pik3r1 LOF lymphocytes. (A) Follicular B cells (B220+CD93CD21highCD23high) were sorted from spleens of young (9–12 wk) WT, Pik3cd GOF, and Pik3r1 LOF mice. Cells were labeled with CellTrace Yellow and then stimulated with αCD40+IL-4 or LPS + TGFβ for 4 d. Graphs show percentage of cells per division. All graphs show mean ± SEM from four independent experiments. Each experiment was performed using n = 2 pooled mouse spleens. Significant differences were determined by one-way ANOVA, *P < 0.05, **P < 0.01, ***P < 0.001, ****P < 0.0001. Significant differences between WT and Pik3cd GOF, WT and Pik3r1 LOF, and Pik3cd GOF and Pik3r1 LOF B cells are indicated in red, blue, and black, respectively. (B) Naïve CD4+ T cells (CD4+CD44loCD62Lhi) were sorted from spleens of WT, Pik3cd GOF, or Pik3r1 LOF mice, stimulated with anti-CD3 and anti-CD28 mAbs under polarizing conditions for 4 d and then restimulated with PMA/ionomycin. Cells were harvested and stained for intracellular expression of TNFα. Graphs depict summary data of cytokine production under each condition stated under each graph. Significant differences were determined by ordinary one-way ANOVA. Plots show mean ± SEM from four independent experiments. (C–F) WT or Pik3r1 LOF OT-II T cells were transferred into SAPKO recipients, which were then immunized with OVA/Alum intraperitoneally. (C) Serum was collected and the level of anti-OVA IgM determined by ELISA. Expression of (D) IgM, (E) IgG1, and (F) IgG2a/c in GC B cells were measured through flow cytometry on day 7. Each point represents a different mouse, bars show mean ± SEM, n = 10–13. Significant differences were determined by Mann–Whitney, *P < 0.05.
Figure 4.
Figure 4.
Murine Pik3r1 LOF B cells have reduced switching. Follicular B cells (B220+CD93CD21highCD23high) were sorted from spleens of young (9–12 wk) WT, Pik3cd GOF, and Pik3r1 LOF mice. Cells were labeled with CellTrace Yellow and stimulated with αCD40 alone, αCD40+IL-4, LPS alone, or LPS + TGFβ for 4 d. Cells were then harvested and stained for IgG1, IgE, IgG2b, and IgG3 as shown. (A) Graphs show total percentage of switched cells of each isotype. Each point represents a separate experiment, bars give mean ± SEM, n = 2–5 as shown. (B) Graphs show percentage of switched cells per division. All graphs show mean ± SEM from 4–8 independent experiments. Significant differences between WT and Pik3cd GOF, WT and Pik3r1 LOF, and Pik3cd GOF and Pik3r1 LOF B cells are indicated in red, blue, and black, respectively. Significant differences were determined by one-way ANOVA, *P < 0.05, **P < 0.01, ***P < 0.001, ****P < 0.0001.
Figure 5.
Figure 5.
Human PIK3R1 LOF CD4+ T cells have altered cytokine production. (A–G) Sort-purified memory CD4+ T cells from healthy controls (n = 26–37) and PIK3R1 LOF patients (n = 6–9) were cultured for 5 d with TAE beads. (A, C, E, and G) Intracellular expression and (B, D, and F) secretion of (A and B) Th1, (C and D) Th2, or (E and F) Th17 cytokines were determined by intracellular staining and cytometric bead arrays, respectively. (G) IL-21 expression was determined by intracellular staining. Each point represents a different individual, bars show median, data combined from nine independent culture experiments. Statistical significance was determined using Mann–Whitney tests, *P < 0.05, **P < 0.01.
Figure 6.
Figure 6.
Mouse Pik3r1 CD4+ T cells also show dysregulated cytokine production. Naïve CD4+ T cells (CD4+CD44loCD62Lhi) were sorted from spleens of WT, Pik3cd GOF, or Pik3r1 LOF mice, stimulated with anti-CD3 and anti-CD28 mAbs under polarizing conditions for 4 d and then restimulated with PMA/ionomycin. (A) Average count of live cells in each culture condition. (B–D) Cells were harvested and stained for intracellular expression of (B) IFNγ, (C) IL-5, and (D) IL17A. Graphs depict cytokine production under each condition as stated under each graph. Significant differences were determined by one-way ANOVA, *P < 0.05, **P < 0.01, ***P < 0.001. Each point represents a separate mouse, bars show mean ± SEM from four independent experiments.
Figure 7.
Figure 7.
Pik3r1 LOF B cells show impaired expansion, switching, and affinity maturation in vivo. WT or Pik3r1 LOF SWHEL cells were transferred to WT congenic hosts, which were then immunized with HEL-2x-SRBC. (A) The expansion of SWHEL cells was tracked over time. (B) Percentage of cells with a plasmablast (CD138+) or GC (CD38loFashi) phenotype was determined. (C and D) Percentage of cells that were unswitched (IgM+) or switched to IgG1 were determined in the (C) plasmablast and (D) GC populations. (E) Levels of HEL-specific serum IgM and IgG1 at day 5.5 were determined by ELISA. (F) Donor GC IgM or IgG1+ cells were sorted on day 9.5 and sequenced to identify mutations. (G) The ratio of DZ to LZ cells in the GC was determined by CXCR4 and CD86 staining. Each point represents one mouse, bars show mean ± SEM, n = 12 from three experiments, except F, n = 4–5 from two experiments. Significant differences were determined by Mann–Whitney, *P < 0.05, **P < 0.01, ***P < 0.001, ****P < 0.0001.
Figure 8.
Figure 8.
Pik3r1 LOF Tfh cells have impaired ability to provide help to B cells. WT or Pik3r1 LOF OT-II T cells were transferred into SAPKO recipients, which were then immunized with OVA/Alum intraperitoneally. Spleens were harvested 7 d later and flow cytometry analysis was performed. (A) Percentages of OT-II cells recovered 7 d after transfer. (B) Percentage of Tfh (CXCR5+PD-1+) cells in the OT-II population. (C) Percentage of GC B cells (B220+FashiCD38lo) in recipient mice. (D–F) Recipient splenocytes harvested at day 7 were stimulated ex vivo with PMA/ionomycin for 6 h and intracellular cytokine staining was performed to identify OT-II cells expressing (D) IL-2, (E) IFNγ, and (F) IL-17A. Each point represents a different mouse, combined data from three independent experiments, bars show Mean ± SEM, n = 10–13. Significant differences were determined by Mann–Whitney, *P < 0.05.
Figure 9.
Figure 9.
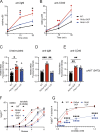
Pik3r1 LOF and Pik3cd GOF murine B cells show different alterations in signaling. Follicular B cells (B220+CD93CD21highCD23high) were sorted from spleens of WT, Pik3cd GOF, and Pik3r1 LOF mice. (A and B) Cells were stimulated with (A) αIgM or (B) αCD40, and p-S6 was detected by flow cytometry at the indicated times. Plots show mean ± SEM, n = 4. Significant differences between WT and Pik3cd GOF, WT and Pik3r1 LOF, and Pik3cd GOF and Pik3r1 LOF B cells are indicated in red, blue, and black, respectively. Significant differences were determined by one-way ANOVA; *P < 0.05, **P < 0.01. (C–E) Cells were left unstimulated (C) or stimulated with αIg (D) or αCD40 (E) for 30 min. Total cell lysates were prepared and pAkt (S473) was determined using the Milliplex MAP Total Akt/mTOR Magnetic Bead 11-Plex Kit. Values were normalized to mean values for each experiment. Each point represents an individual sorted B cell population from different mice, from at least three independent experiments, bars give mean ± SEM, n = 4–6. Significant differences were calculated by one-way ANOVA; *P < 0.05, **P < 0.01, ***P < 0.001. (F and G) Cells were labeled with CellTrace Yellow and stimulated with αCD40+IL-4 for 4 d in the presence of DMSO (control) or various concentration of leniolisib as shown. Cells were then harvested and stained for IgG1. (F) Graphs show percentage of switched cells per division. (G) The percentage of IgG1+ switched cells in division 4 was plotted for each concentration of inhibitor. (F and G) Graphs show mean ± SEM from three independent experiments. Significant differences were calculated by two-way ANOVA *P < 0.05, **P < 0.01, ****P < 0.0001.
Figure S4.
Figure S4.
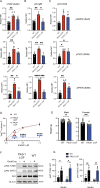
Extended phenotyping of Pik3r1 LOF mice. (A–D) Follicular B cells (B220+CD93CD21highCD23high) were sorted from spleens of WT, Pik3cd GOF, and Pik3r1 LOF mice. (A–C) Cells were left unstimlated (A) or stimulated with αIg (B) or αCD40 (C) for 30 min. Total cell lysates were prepared and pGSK3β, pTSC2, and pPTEN was determined using the Milliplex MAP Total Akt/mTOR Magnetic Bead 11-Plex Kit. Values were normalized to mean values for each experiment. Each point represents an individual sorted B cell population from different mice, from at least three independent experiments, bars give mean ± SEM, n = 4–6. Significant differences were calculated by one-way ANOVA. (D) Cells were labeled with CellTrace Yellow and stimulated with αCD40+IL-4 for 4 d in the presence of DMSO (control) or various concentration of leniolisib as shown. Cells were then harvested and stained for IgE. The percentage of IgE+ switched cells in division 5 was plotted for each concentration of inhibitor. Graph shows mean ± SEM from two independent experiments. Significant differences were calculated by two-way ANOVA, **P < 0.01, ****P < 0.0001. (E) Mice were weighed at 9–10 wk of age. Each point indicates an individual animal, bars show mean ± SEM, male WT n = 20, Pik3r1 LOF n = 15, female WT n = 23, Pik3r1 LOF n = 10. Significant differences were determined by Mann–Whitney, **P < 0.01, ***P < 0.001. (F and G) Epidydimal white adipose explants from Pik3r1 LOF and littermate WT control were treated with PBS or 10 nM insulin for 20 min. (F) Representative Western blot of protein expression for total Akt, phosphorylated Akt (pAkt T308 and pAkt S473), and loading control (14-3-3) in response to ±10 nM insulin. (G) Quantification of Western blots (F) of phosphorylated Akt (T308 and S473) normalized to total Akt levels. Each point represents a different mouse, bars represent means ± SEM (n = 3–4 animals per condition). Source data are available for this figure: SourceData FS4.

References

    1. Acosta-Rodríguez, E.V., Rivino L., Geginat J., Jarrossay D., Gattorno M., Lanzavecchia A., Sallusto F., and Napolitani G.. 2007. Surface phenotype and antigenic specificity of human interleukin 17-producing T helper memory cells. Nat. Immunol. 8:639–646. 10.1038/ni1467 - DOI - PubMed
    1. Al Qureshah, F., Sagadiev S., Thouvenel C.D., Liu S., Hua Z., Hou B., Acharya M., James R.G., and Rawlings D.J.. 2021. Activated PI3Kδ signals compromise plasma cell survival via limiting autophagy and increasing ER stress. J. Exp. Med. 218:218. 10.1084/jem.20211035 - DOI - PMC - PubMed
    1. Angulo, I., Vadas O., Garçon F., Banham-Hall E., Plagnol V., Leahy T.R., Baxendale H., Coulter T., Curtis J., Wu C., et al. . 2013. Phosphoinositide 3-kinase δ gene mutation predisposes to respiratory infection and airway damage. Science. 342:866–871. 10.1126/science.1243292 - DOI - PMC - PubMed
    1. Asano, T., Okada S., Tsumura M., Yeh T.W., Mitsui-Sekinaka K., Tsujita Y., Ichinose Y., Shimada A., Hashimoto K., Wada T., et al. . 2018. Enhanced AKT phosphorylation of circulating B cells in patients with activated PI3Kδ syndrome. Front. Immunol. 9:568. 10.3389/fimmu.2018.00568 - DOI - PMC - PubMed
    1. Avery, D.T., Deenick E.K., Ma C.S., Suryani S., Simpson N., Chew G.Y., Chan T.D., Palendira U., Bustamante J., Boisson-Dupuis S., et al. . 2010. B cell-intrinsic signaling through IL-21 receptor and STAT3 is required for establishing long-lived antibody responses in humans. J. Exp. Med. 207:155–171. 10.1084/jem.20091706 - DOI - PMC - PubMed

Publication types

Substances