

A case of hermaphroditism in the gonochoristic sea urchin, Strongylocentrotus purpuratus, reveals key mechanisms of sex determination†
- PMID: 36943312
- PMCID: PMC10266946
- DOI: 10.1093/biolre/ioad036
A case of hermaphroditism in the gonochoristic sea urchin, Strongylocentrotus purpuratus, reveals key mechanisms of sex determination†
Abstract
Sea urchins are usually gonochoristic, with all of their five gonads either testes or ovaries. Here, we report an unusual case of hermaphroditism in the purple sea urchin, Strongylocentrotus purpuratus. The hermaphrodite is self-fertile, and one of the gonads is an ovotestis; it is largely an ovary with a small segment containing fully mature sperm. Molecular analysis demonstrated that each gonad producedviable gametes, and we identified for the first time a somatic sex-specific marker in this phylum: Doublesex and mab-3 related transcription factor 1 (DMRT1). This finding also enabled us to analyze the somatic tissues of the hermaphrodite, and we found that the oral tissues (including gut) were out of register with the aboral tissues (including tube feet) enabling a genetic lineage analysis. Results from this study support a genetic basis of sex determination in sea urchins, the viability of hermaphroditism, and distinguish gonad determination from somatic tissue organization in the adult.
Keywords: hermaphrodite; hermaphroditism; ovary; ovotestis; sea urchin; sex determination; testis.
© The Author(s) 2023. Published by Oxford University Press on behalf of Society for the Study of Reproduction. All rights reserved. For permissions, please e-mail: journals.permissions@oup.com.
Figures


 1, a normal testis. (B) Close-up of lobes of gonad 1, a testis, note presence of sperm. (C) Seawater around gonad 1 containing viable, swimming sperm. (D) Darkfield image of gonad 2, appearance is that of a normal ovary. (E) Close-up of lobes of gonad 2, note presence of mature, unfertilized eggs. (F) Darkfield image of gonad 2 and associated unfertilized eggs. (G– I) Darkfield image of gonads 3, 4, and 5. Each of these were normal testes, indistinguishable from 1.
 2, ovary Hyalin− and Vasa− localization. Several large, Hyalin+ eggs are clearly visible. (D) Close-up of Hyalin+ mature eggs in ovary portion of hermaphrodite gonad 2. (E) Inset showing Hyalin− and Vasa− localization in the ovotestis portion of hermaphrodite gonad 2, note distinct lack of not only Hyalin+ eggs but oogonia and early oocytes are not visible as well. This region was noted to contain sperm. (F) Bindin− and tubulin− localization in a normal control testis. Bindin puncta are visible in green at the tip and collar of the sperm, while tubulin marks the sperm flagella. (G) Inset showing cluster of spermatozoa with highlighted sperm tails. (H) Bindin and tubulin localization in hermaphrodite gonad 1, a normal testis. Localization is indistinguishable from the control. (I) Inset showing tubulin flagella of normal sperm in hermaphrodite gonad 1. (J) Bindin and tubulin localization in ovotestis portion of hermaphrodite gonad 2, appearing indistinguishable from localization in control male.
 1, normal sperm (scale bar = 20 μM). (C, D) Hermaphrodite gonad 2, normal eggs. (E, F) Hermaphrodite gonad 3. (G–H) Hermaphrodite gonad 4. (I–J) Hermaphrodite gonad 5. (K, L) Control ovary. (M, N) Control testis.
 2, where all morphology appears to be that of a normal testis; however, a single egg is present among spermatozoa (asterisk). (C) Partial ovotestis in hermaphrodite gonad 2, a single lobe where a normal looking nest of mature eggs is present; however, all somatic structures resemble that of a testis. (D) Close-up of the partial ovotestis showing spermatozoa with triangular heads (arrowheads) next to a mature egg within the same lobe of the ovotestis.
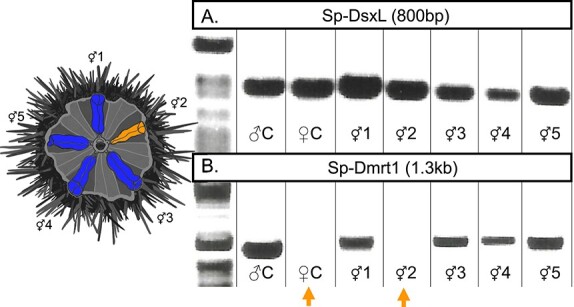 2, the ovary, identical to the result in the control female DNA lane.


Similar articles
-
Identification of protein components from the mature ovary of the sea urchin Evechinus chloroticus (Echinodermata: Echinoidea).Proteomics. 2008 Jun;8(12):2531-42. doi: 10.1002/pmic.200700995. Proteomics. 2008. PMID: 18563751
-
Adhesive plasticity among populations of purple sea urchin (Strongylocentrotus purpuratus).J Exp Biol. 2020 Aug 13;223(Pt 15):jeb228544. doi: 10.1242/jeb.228544. J Exp Biol. 2020. PMID: 32587066
-
Sunflower sea star predation on urchins can facilitate kelp forest recovery.Proc Biol Sci. 2023 Feb 22;290(1993):20221897. doi: 10.1098/rspb.2022.1897. Epub 2023 Feb 22. Proc Biol Sci. 2023. PMID: 36809801 Free PMC article.
-
Neurosensory and neuromuscular organization in tube feet of the sea urchin Strongylocentrotus purpuratus.J Comp Neurol. 2011 Dec 1;519(17):3566-79. doi: 10.1002/cne.22724. J Comp Neurol. 2011. PMID: 21800307
-
Ocean acidification research in the 'post-genomic' era: Roadmaps from the purple sea urchin Strongylocentrotus purpuratus.Comp Biochem Physiol A Mol Integr Physiol. 2015 Jul;185:33-42. doi: 10.1016/j.cbpa.2015.03.007. Epub 2015 Mar 13. Comp Biochem Physiol A Mol Integr Physiol. 2015. PMID: 25773301 Review.
Cited by
-
Selection Shapes the Genomic Landscape of Introgressed Ancestry in a Pair of Sympatric Sea Urchin Species.Genome Biol Evol. 2024 Jun 4;16(6):evae124. doi: 10.1093/gbe/evae124. Genome Biol Evol. 2024. PMID: 38874390 Free PMC article.
-
Synchronously Mature Intersex Japanese Flounder (Paralichthys olivaceus): A Rare Case.Animals (Basel). 2024 Oct 12;14(20):2948. doi: 10.3390/ani14202948. Animals (Basel). 2024. PMID: 39457878 Free PMC article.
-
Identification of a candidate sex determination region and sex-specific molecular markers based on whole-genome re‑sequencing in the sea star Asterias amurensis.DNA Res. 2024 Dec 27;32(1):dsaf003. doi: 10.1093/dnares/dsaf003. DNA Res. 2024. PMID: 39792457 Free PMC article.
References
-
- Kim Y, Capel B. Balancing the bipotential gonad between alternative organ fates: a new perspective on an old problem. Dev Dyn 2006; 235:2292–2300. - PubMed
-
- Nef S, Stevant I, Greenfield A. Characterizing the bipotential mammalian gonad. Curr Top Dev Biol 2019; 134:167–194. - PubMed
-
- Lucas-Herald AK, Bashamboo A. Gonadal development. Endocr Dev 2014; 27:1–16. - PubMed
-
- Val P, Swain A. Mechanisms of disease: normal and abnormal gonadal development and sex determination in mammals. Nat Clin Pract Urol 2005; 2:616–627. - PubMed
Publication types
MeSH terms
Grants and funding
LinkOut - more resources
Full Text Sources
Miscellaneous
