. 2023 Jun 1;133(11):e163799.
doi: 10.1172/JCI163799.

IL-6 in the infarcted heart is preferentially formed by fibroblasts and modulated by purinergic signaling

Affiliations

IL-6 in the infarcted heart is preferentially formed by fibroblasts and modulated by purinergic signaling

Christina Alter et al. J Clin Invest. .

Abstract

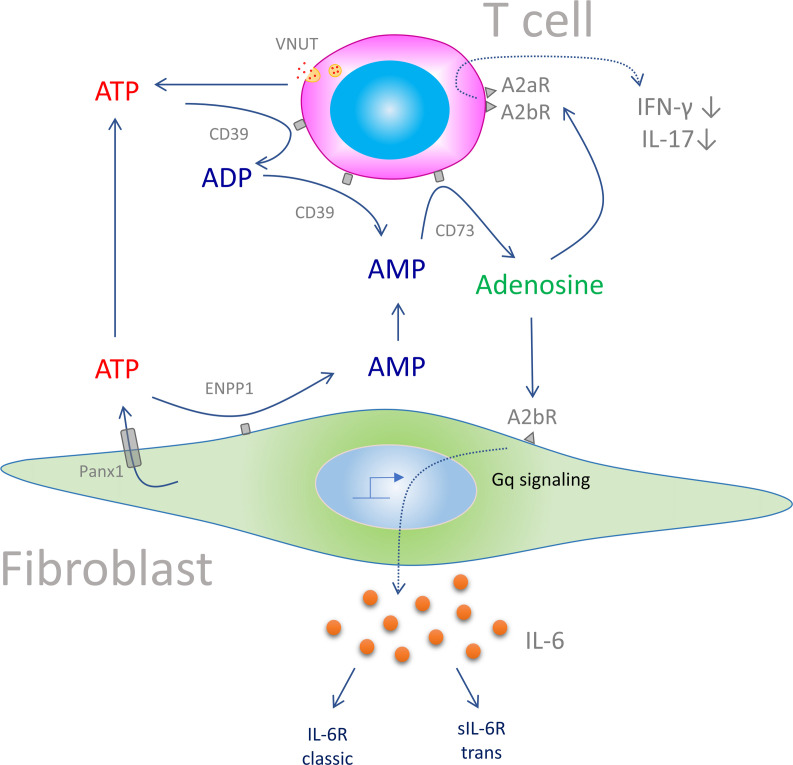
Plasma IL-6 is elevated after myocardial infarction (MI) and is associated with increased morbidity and mortality. Which cardiac cell type preferentially contributes to IL-6 expression and how its production is regulated are largely unknown. Here, we studied the cellular source and purinergic regulation of IL-6 formation in a murine MI model. We found that IL-6, measured in various cell types in post-MI hearts at the protein level and by quantitative PCR and RNAscope, was preferentially formed by cardiac fibroblasts (CFs). Single-cell RNA-Seq (scRNA-Seq) in infarcted mouse and human hearts confirmed this finding. We found that adenosine stimulated fibroblast IL-6 formation via the adenosine receptor A2bR in a Gq-dependent manner. CFs highly expressed Adora2b and rapidly degraded extracellular ATP to AMP but lacked CD73. In mice and humans, scRNA-Seq revealed that Adora2B was also mainly expressed by fibroblasts. We assessed global IL-6 production in isolated hearts from mice lacking CD73 on T cells (CD4-CD73-/-), a condition known to be associated with adverse cardiac remodeling. The ischemia-induced release of IL-6 was strongly attenuated in CD4-CD73-/- mice, suggesting adenosine-mediated modulation. Together, these findings demonstrate that post-MI IL-6 was mainly derived from activated CFs and was controlled by T cell-derived adenosine. We show that purinergic metabolic cooperation between CFs and T cells is a mechanism that modulates IL-6 formation by the heart and has therapeutic potential.

Keywords: Cardiology; Cytokines; Inflammation.


Conflict of interest statement

Conflict of interest: The authors have declared that no conflict of interest exists.

Figures

Figure 1
Figure 1. Temporal changes in expression profiles of Il6 and Adora2b in different subpopulations of cardiac cells in the infarcted heart.
(A) qPCR measurement of Il6 mRNA expression in macrophages, monocytes, DCs, granulocytes, T cells, B cells, CFs, EpiSCs, ECs, and cardiomyocytes isolated from C57BL/6J mice on post-MI days 1, 3, and 7 (n = 3–5). (B) Adora2b mRNA expression in different cardiac cell populations (same post-MI time points and cells as in A) (n = 5). Values are the median with the IQR. (C and D) Analysis of Il6 (C) and Adora2b (D) expression following scRNA-Seq analysis of hearts 5 days after MI. Populations of activated CFs, EpiSCs, and ICs isolated from the infarcted hearts of 3 C57BL/6J mice per group were combined (Supplemental Figure 1) and analyzed for their fractional contribution within the combined cluster (Supplemental Figure 3), resulting in 26 well-defined cell populations with the indicated cell identities. Mono, monocytes; Mac, macrophages; VSMC, vascular smooth muscle cells.
Figure 2
Figure 2. Il6 expression in the infarcted heart as measured by RNAscope.
Sections from hearts of C57BL/6J mice were analyzed 3 days after MI. (A) Representative WGA staining (bright green) delineates the infarcted area. Close-ups on the right were stained for Il6 mRNA (blue) with RNAscope without counterstaining. (B) Representative section stained for Ptprc (CD45) (red) and Il6 (blue) mRNA. Close-up in the upper right panel shows chromogenic staining at higher magnification. The chromogenic Fast Red dye could additionally be visualized in the red fluorescence spectrum, as shown in the lower panel of the close-up. The fluorescence image was overlaid with the bight-field image (gray). (C) Representative staining for Postn (blue) and Il6 (red) mRNA. The upper and lower close-ups are the chromogenic and fluorescence images, respectively. Representative images of the same heart are shown. n = 3. Scale bars: 300 μm and 20 μm (close-up insets). LV, left ventricle; RV, right ventricle.
Figure 3
Figure 3. Quantification of IL-6 secretion from cardiac ECs, granulocytes, macrophages, and CFs by ELISPOT.
Cells were isolated 3 days after MI and seeded at a density of 10,000 cells per well. The number of IL-6–secreting cells was determined by ELISPOT assay after overnight incubation. n = 5. Values are the mean ± SD. *P ≤ 0.05, by 1-way ANOVA with Tukey’s multiple-comparison test. Gran, granulocytes.
Figure 4
Figure 4. A2bR stimulation of CFs by adenosine induces IL-6 secretion in a Gq-dependent manner.
(AD) Murine CFs were isolated from A2bR–/– or A2bR+/+ (control) transgenic mice and incubated in the presence or absence of 20 μM adenosine (Ado) or 20 μM adenosine in combination with the Gq inhibitor FR900359 (1 μM) in the presence of the adenosine deaminase inhibitor EHNA (33 μM) and the ENT1 inhibitor NBMPR (33 μM). (A, C, and D) Il6, Il11, and Lif expression was determined by qPCR 24 hours later. (B) IL-6 cytokine secretion was measured after 24 hours. n = 3. Values are the mean ± SD. *P ≤ 0.05 and **P ≤ 0.01, by 2-way ANOVA using the 2-stage step-up method of Benjamini, Krieger, and Yekutieli.
Figure 5
Figure 5. Purinergic signaling in CFs.
(A) Kinetics of extracellular ATP degradation in murine CFs isolated from C57BL/6J mice analyzed by HPLC (reaction was started with 20 μM ATP, 37°C; n = 3). (BE) Expression analysis of the ATP-degrading enzymes Entpd1 (CD39) (B), Enpp1 (C), Enpp3 (D), and Nt5e (CD73) (E) by scRNA-Seq of 3 hearts 5 days after MI (see above and Supplemental Figures 1–3). (F) Protein expression analysis by flow cytometry of CD39, ENPP1, CD38, and CD73 in CFs obtained from noninfarcted hearts as compared with aCFs and EpiSCs from mice 5 days after MI (n = 5). Only ENPP1 was measured because specific antibodies against ENPP3 were not available. Values are the mean ± SD. *P ≤ 0.05, by 1-way ANOVA with Dunnett’s multiple-comparison test.
Figure 6
Figure 6. Cytokine secretion by the heart is influenced by MI and lack of CD73 on T cells.
(A) Cytokine secretion was assessed in the coronary effluent of isolated perfused hearts from sham-operated CD4-Cre–/– CD73fl/fl mice (A) and 3 days after MI (B). Sham-operated mice, n = 3; MI mice, n = 6. (C) Influence of CD73 deficiency on T cells on the cardiac release of IL-6, MCP-1, and IL-9 measured in control (CD4-Cre–/– CD73fl/fl) and T cell–specific CD73-KO (CD4-Cre+/– CD73fl/fl) mice 3 days after MI (n = 6). Values are the mean ± SD. *P ≤ 0.05, **P ≤ 0.01, and ***P ≤ 0.001, by 2-tailed Student’s t test (A and B) and 2-way ANOVA using the 2-stage step-up method of Benjamini, Krieger, and Yekutieli (C).
Figure 7
Figure 7. Scheme of the proposed mechanism by which purinergic crosstalk between T cells and CFs controls IL-6 production.
In the post-MI heart during scar formation, ATP is derived mainly from noncardiomyocytes. Fibroblasts, in contrast to T cells, cannot further degrade AMP to adenosine, such that accumulating AMP diffuses to neighboring T cells, which highly express CD73. Similarly, granulocytes and monocytes contribute to this extracellular AMP pool. Supply of AMP to T cell CD73 augments local adenosine formation, which stimulates IL-6 production by fibroblasts via the A2bR in a Gq-dependent manner. T cells are not only the hub for extracellular adenosine formation, as adenosine can also modulate in an autacoid feedback loop the production of INF-γ and IL-17 (14). IL-6 predominantly acts via trans-signaling (sIL-6R) to confer proinflammatory activity in the post-MI heart (37).

Comment in

  • Interleukin 6 helps weave the inflammatory web during acute coronary syndromes

References

    1. Hunter CA, Jones SA. IL-6 as a keystone cytokine in health and disease. Nat Immunol. 2015;16(5):448–457. doi: 10.1038/ni.3153. - DOI - PubMed
    1. Kucharz EJ, Wilk T. Dynamics of serum interleukin-6 level in patients with acute myocardial infarction. Eur J Intern Med. 2000;11(5):253–256. doi: 10.1016/S0953-6205(00)00098-4. - DOI - PubMed
    1. Heinrich PC, et al. Interleukin-6-type cytokine signalling through the gp130/Jak/STAT pathway1. Biochem J. 1998;334(pt 2):297–314. doi: 10.1042/bj3340297. - DOI - PMC - PubMed
    1. Fontes JA, et al. The varying faces of IL-6: from cardiac protection to cardiac failure. Cytokine. 2015;74(1):62–68. doi: 10.1016/j.cyto.2014.12.024. - DOI - PMC - PubMed
    1. Ridker PM, et al. Modulation of the interleukin-6 signalling pathway and incidence rates of atherosclerotic events and all-cause mortality: analyses from the Canakinumab Anti-Inflammatory Thrombosis Outcomes Study (CANTOS) Eur Heart J. 2018;39(38):3499–3507. doi: 10.1093/eurheartj/ehy310. - DOI - PubMed

Publication types