. 2023 Jul;43(5):882-893.
doi: 10.1007/s10875-023-01459-x. Epub 2023 Mar 21.

Neutrophil Activation and Immune Thrombosis Profiles Persist in Convalescent COVID-19

Collaborators, Affiliations

Neutrophil Activation and Immune Thrombosis Profiles Persist in Convalescent COVID-19

Hakim Hocini et al. J Clin Immunol. 2023 Jul.

Erratum in

  • Correction to: Neutrophil Activation and Immune Thrombosis Profiles Persist in Convalescent COVID‑19.
    Hocini H, Wiedemann A, Blengio F, Lefebvre C, Cervantes-Gonzalez M, Foucat E, Tisserand P, Surenaud M, Coléon S, Prague M, Guillaumat L, Krief C, Fenwick C, Laouénan C, Bouadma L, Ghosn J, Pantaleo G, Thiébaut R; French COVID cohort study group; Lévy Y. Hocini H, et al. J Clin Immunol. 2023 Jul;43(5):894. doi: 10.1007/s10875-023-01477-9. J Clin Immunol. 2023. PMID: 36991251 Free PMC article. No abstract available.

Abstract

Purpose: Following a severe COVID-19 infection, a proportion of individuals develop prolonged symptoms. We investigated the immunological dysfunction that underlies the persistence of symptoms months after the resolution of acute COVID-19.

Methods: We analyzed cytokines, cell phenotypes, SARS-CoV-2 spike-specific and neutralizing antibodies, and whole blood gene expression profiles in convalescent severe COVID-19 patients 1, 3, and 6 months following hospital discharge.

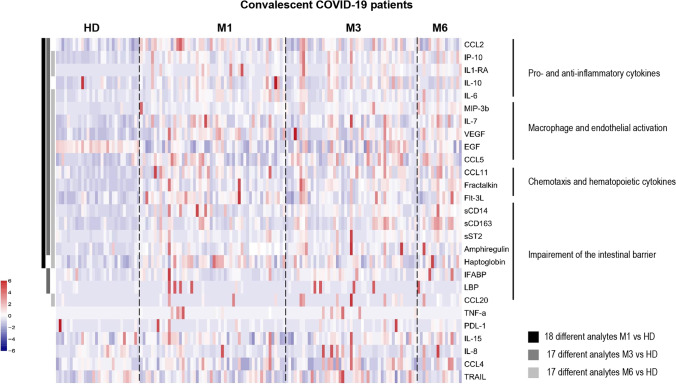
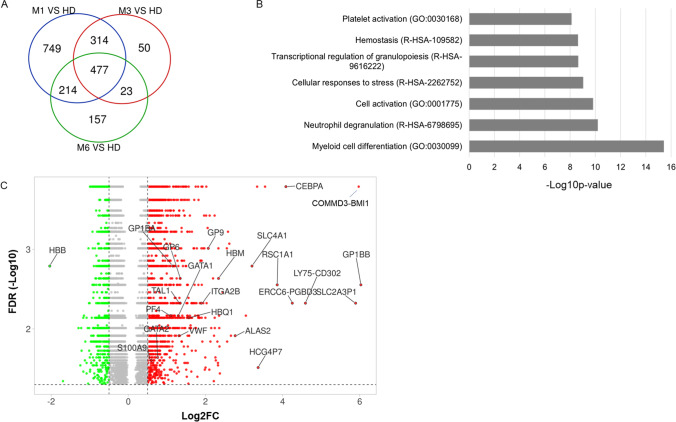
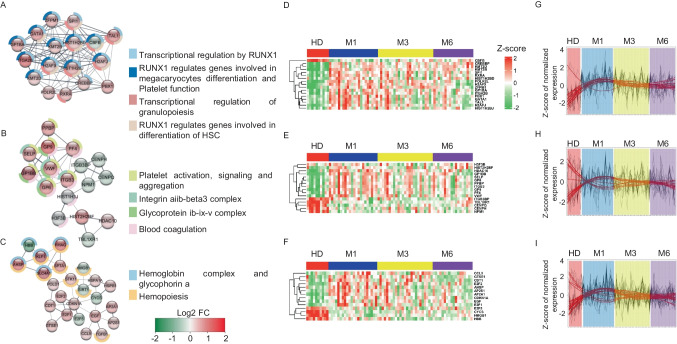
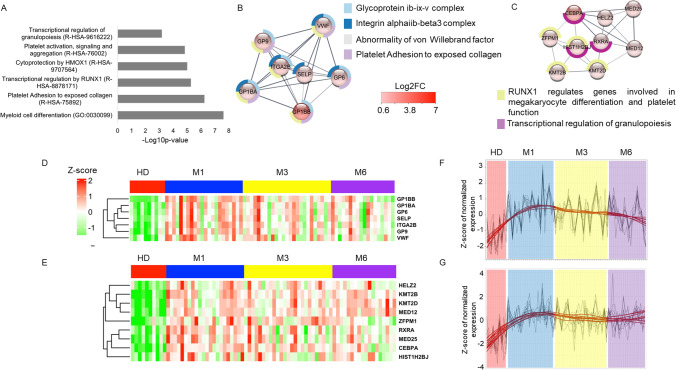
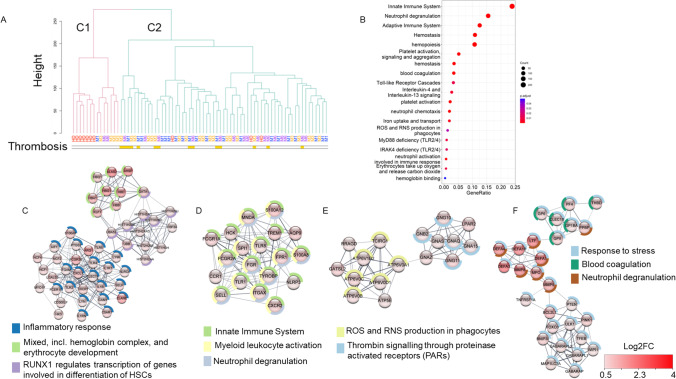
Results: We observed persistent abnormalities until month 6 marked by (i) high serum levels of monocyte/macrophage and endothelial activation markers, chemotaxis, and hematopoietic cytokines; (ii) a high frequency of central memory CD4+ and effector CD8+ T cells; (iii) a decrease in anti-SARS-CoV-2 spike and neutralizing antibodies; and (iv) an upregulation of genes related to platelet, neutrophil activation, erythrocytes, myeloid cell differentiation, and RUNX1 signaling. We identified a "core gene signature" associated with a history of thrombotic events, with upregulation of a set of genes involved in neutrophil activation, platelet, hematopoiesis, and blood coagulation.

Conclusion: The lack of restoration of gene expression to a normal profile after up to 6 months of follow-up, even in asymptomatic patients who experienced severe COVID-19, signals the need to carefully extend their clinical follow-up and propose preventive measures.

Trial registration: ClinicalTrials.gov NCT04262921.

Keywords: COVID-19 disease; post-acute COVID-19 syndrome; thrombosis.


Conflict of interest statement

The authors declare no competing interests.

Figures

Fig. 1
Fig. 1
Heatmap of standardized biomarker expression in the serum of convalescent COVID-19 patients at M1, M3, and M6 post-infection. The colors represent standardized expression values centered on the mean, with variance equal to 1. Biomarker hierarchical clustering was computed using the Euclidean distance and Ward’s method. HD, healthy donors (n = 30); M1 (n = 42), M3 (n = 47), M6 (n = 16). The vertical lines on the left side of the heatmap represent which analytes levels are different between healthy donors and covid19 patients at M1 (left, dark-grey), M3 (middle, middle-grey), and M6 (right, light-grey) time points
Fig. 2
Fig. 2
Differentially expressed genes between convalescent patients at M1, M3, and M6 relative to healthy donors (HD). A Venn diagram of the number of DEGs between convalescent patients at M1, M3, and M6 relative to HD. B Pathways associated with DEGs between convalescent at M1 and HD. C Volcano plot of DEGs with an FDR ≤ 0.05 between convalescent COVID-19 patients at M1 relative to HD. Up- and downregulated genes are represented by red and green dots, respectively
Fig. 3
Fig. 3
The main molecular complexes associated with the DEGs between convalescent patients at M1 relative to HD and their evolution over the time. AC MCODE 1, 2, and 3, respectively, and the main associated pathways. The spheres are colored depending on the gene fold change (Log2FC), as depicted in the figure. Pathways associated with each MCODE are shown as donuts. DF MCODE 1, 2, and 3 gene expression level at M1, M3, M6 of convalescence and in HD. GI Trend of MCODE 1, 2, and 3 gene expression at M1, M3, M6, and HD
Fig. 4
Fig. 4
Differentially expressed genes shared between the comparisons of convalescent patients at M1, M3, and M6 to HD. A Pathways associated with 477 DEGs shared between convalescent patients at M1, M3, and M6 relative to HD. B, C MCODE 1 and 2 of the 477 DEGs and their main pathways. The spheres are colored depending on the gene fold change (Log2FC), as depicted in the figure. Pathways associated with each MCODE are shown as donuts. D, E Heatmap of gene expression belonging to MCODE 1 and 2. F, G Trend of MCODE 1 and 2 gene expression at M1, M3, M6, and HD
Fig. 5
Fig. 5
Clustering of HD and convalescent COVID-19 patient samples recovered at M1, M3, and M6 and gene expression profile associated with thrombosis in convalescent COVID-19 patients. A Clustering of HD and convalescent COVID-19 patient samples recovered at M1, M3, and M6. B Pathways associated with DEGs between convalescent patients who experienced thrombosis in cluster C2 and those who did not experience thrombosis and classified close to HD (convalescent patients in cluster C1). CF MCODE 1, 2, 3, and 4 and associated pathways of the DEGs between convalescent patients who experienced thrombosis belonging to cluster C2 and those who did not experience thrombosis classified close to HD (convalescent patients in cluster C1). The spheres are colored depending on the gene fold change (Log2FC), as depicted in the figure. The pathways associated with each MCODE are shown as donuts

References

    1. Raveendran AV, Jayadevan R, Sashidharan S. Long COVID: an overview. Diabetes Metab Syndr. 2021;15(3):869–875. doi: 10.1016/j.dsx.2021.04.007. - DOI - PMC - PubMed
    1. Wilk AJ, Rustagi A, Zhao NQ, Roque J, Martínez-Colón GJ, McKechnie JL, et al. A single-cell atlas of the peripheral immune response in patients with severe COVID-19. Nat Med. 2020;26(7):1070–1076. doi: 10.1038/s41591-020-0944-y. - DOI - PMC - PubMed
    1. Silvin A, Chapuis N, Dunsmore G, Goubet AG, Dubuisson A, Derosa L, et al. Elevated calprotectin and abnormal myeloid cell subsets discriminate severe from mild COVID-19. Cell. 2020;182(6):1401–18.e18. doi: 10.1016/j.cell.2020.08.002. - DOI - PMC - PubMed
    1. Lucas C, Wong P, Klein J, Castro TBR, Silva J, Sundaram M, et al. Longitudinal analyses reveal immunological misfiring in severe COVID-19. Nature. 2020;584(7821):463–469. doi: 10.1038/s41586-020-2588-y. - DOI - PMC - PubMed
    1. Lévy Y, Wiedemann A, Hejblum BP, Durand M, Lefebvre C, Surénaud M, et al. CD177, a specific marker of neutrophil activation, is associated with coronavirus disease 2019 severity and death. iScience. 2021;24(7):102711. doi: 10.1016/j.isci.2021.102711. - DOI - PMC - PubMed

Publication types

Associated data