. 2023 Mar 28;120(13):e2300648120.
doi: 10.1073/pnas.2300648120. Epub 2023 Mar 21.

Dissection of complement and Fc-receptor-mediated pathomechanisms of autoantibodies to myelin oligodendrocyte glycoprotein

Affiliations

Dissection of complement and Fc-receptor-mediated pathomechanisms of autoantibodies to myelin oligodendrocyte glycoprotein

Simone Mader et al. Proc Natl Acad Sci U S A. .

Abstract

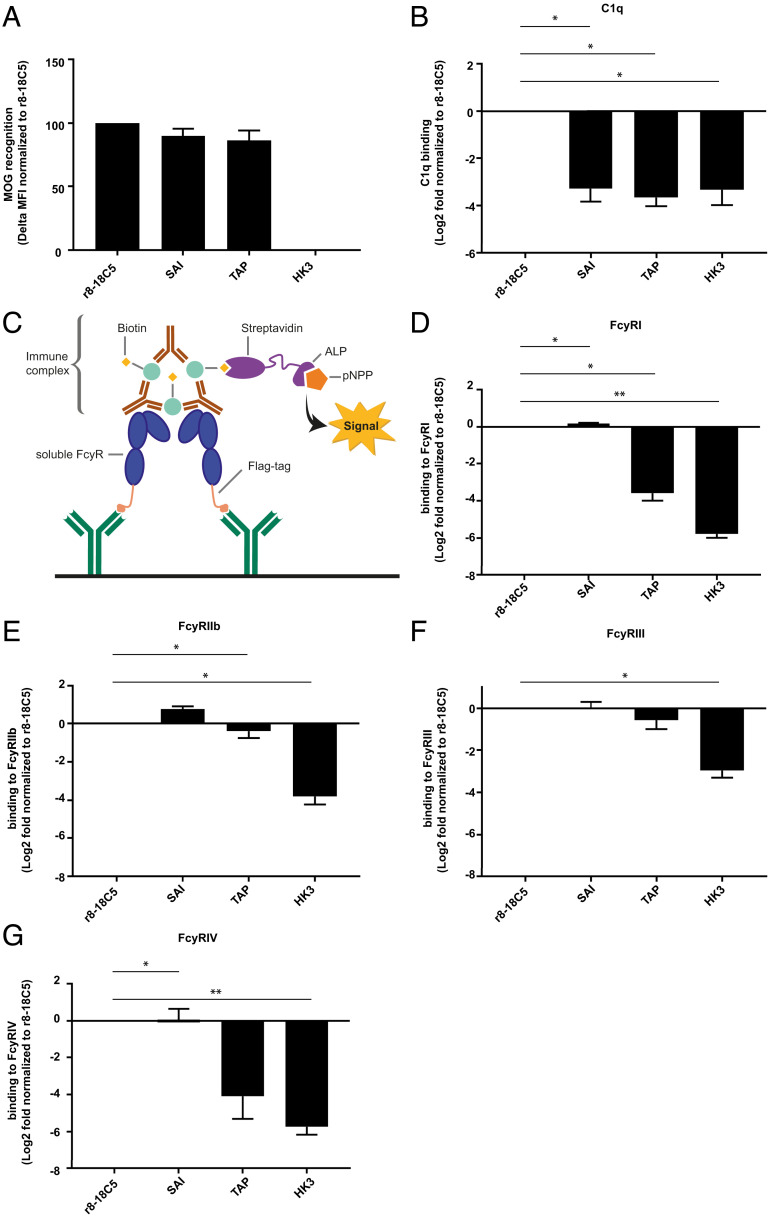
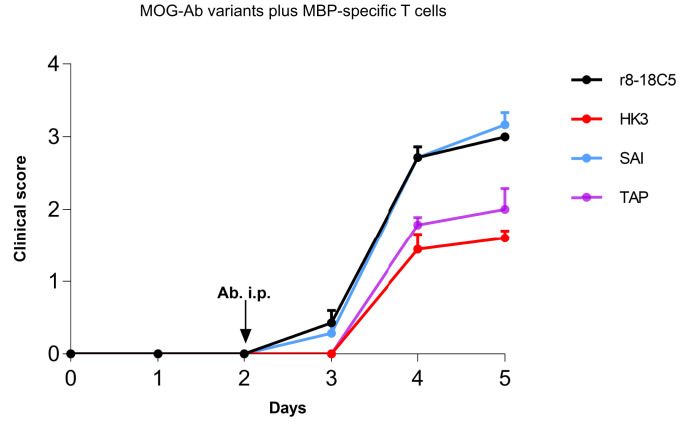
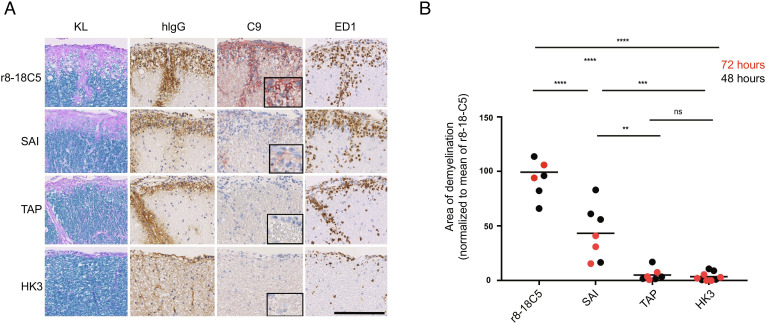
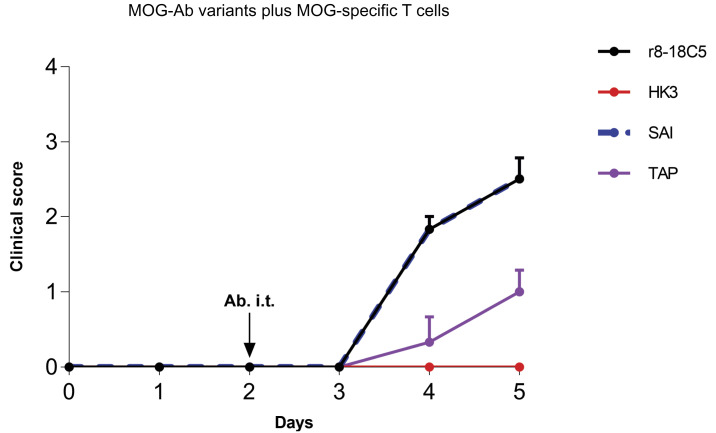
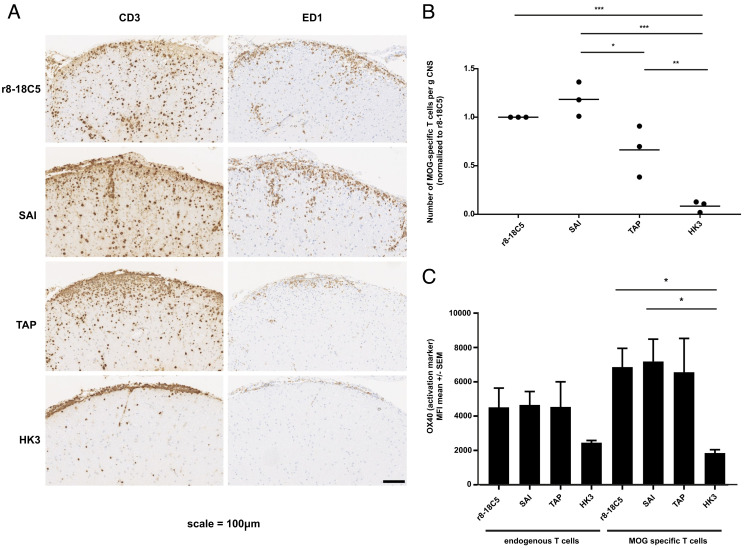
Autoantibodies against myelin oligodendrocyte glycoprotein (MOG) have recently been established to define a new disease entity, MOG-antibody-associated disease (MOGAD), which is clinically overlapping with multiple sclerosis. MOG-specific antibodies (Abs) from patients are pathogenic, but the precise effector mechanisms are currently still unknown and no therapy is approved for MOGAD. Here, we determined the contributions of complement and Fc-receptor (FcR)-mediated effects in the pathogenicity of MOG-Abs. Starting from a recombinant anti-MOG (mAb) with human IgG1 Fc, we established MOG-specific mutant mAbs with differential FcR and C1q binding. We then applied selected mutants of this MOG-mAb in two animal models of experimental autoimmune encephalomyelitis. First, we found MOG-mAb-induced demyelination was mediated by both complement and FcRs about equally. Second, we found that MOG-Abs enhanced activation of cognate MOG-specific T cells in the central nervous system (CNS), which was dependent on FcR-, but not C1q-binding. The identification of complement-dependent and -independent pathomechanisms of MOG-Abs has implications for therapeutic strategies in MOGAD.

Keywords: Autoimmunity; demyelination; effector mechanisms; inflammation; neuroimmunology.


Conflict of interest statement

The authors declare no competing interest.

Figures

Fig. 1.
Fig. 1.
Antigen recognition, C1q- and FcγR-binding of mutated MOG-specific mAbs. The MOG antibody r8-18C5 and the Fc mutant antibodies SAI and TAP show comparable binding to MOG in a cell-based flow cytometry assay (A). IgG binding to MOG was normalized to binding of the r8-18C5 and the assay was repeated two times for each antibody (delta MFI value). (B) C1q binding was analyzed with an ELISA. Specifically, ED-hMOG was coated and indicated Ab variants were added. Subsequently, C1q was added and its binding was quantified using anti-C1q Ab. Binding of the mutant Abs was normalized to the binding of the antibody r8-18C5 and the assay was repeated three times for each antibody. FcγRI, FcyRIIb, FcyRIII, and FcγRIV binding was investigated by ELISA (CG). Anti-FLAG antibodies were coated on an ELISA plate and used to capture soluble flag-tagged FcγR (FcγRI, FcyRIIb, FcyRIII, FcγRIV) (C). Binding of antibody-MOG IgG immune complexes to the added soluble FcγRs was quantified (D-G). Binding of the mutant MOG-Abs SAI and TAP is normalized to the binding of the MOG antibody r8-18C5. The assay was repeated three times for each antibody. Data are shown as mean with SEM. Each mutant mAbs’ affinity to C1q and FcyRs was presented as log2 fold change compared to r8-18C5 measured on the same plate and was analyzed using 2-tailed one-sample t test (parametric Welch’s t test) with Benjamini–Hochberg multiple comparison correction (n = 3).
Fig. 2.
Fig. 2.
Clinical EAE in the model with MBP-specific T cells and mutated MOG-Abs. Lewis rats were injected with MBP-specific T cells that strongly breach the blood–brain barrier. At day 2, the indicated nonmutated MOG-Abs, the mutated MOG-Abs (TAP, SAI), and the control Ab HK3 were injected intraperitoneally. Histology was performed at day 4 or 5. We investigated the development of the clinical disease over time. The clinical score displayed represents the mean + SEM of the following number of animals. r8-18C5 (day 4, n = 5; day 5, n = 2), SAI (day 4, n = 4; day 5, n = 3), TAP (day 4, n = 4; day 5, n = 3), HK3 (day 4, n = 4; day 5, n = 5). Day 4: r8-18C5 vs. SAI = ns; r8-18C5 vs. TAP P ≤ 0.01; 8-18C5 vs. HK3 P < 0.0001; SAI vs. TAP P ≤ 0.01; SAI vs. HK3 P < 0.0001; TAP vs. HK3 = ns. Day 5: r8-18C5 vs. SAI = ns; r8-18C5 vs. TAP P ≤ 0.05; 8-18C5 vs. HK3 P ≤ 0.01; SAI vs. TAP P ≤ 0.01; SAI vs. HK3 P ≤ 0.001; TAP vs. HK3 = ns.
Fig. 3.
Fig. 3.
Histopathology of the EAE induced by MBP-specific T cells and mutated MOG antibodies. Spinal cord sections of Lewis rats, which developed EAE subsequent to transfer of T cells specific for MBP (A and B). Animals were intraperitoneally injected 72 h prior to the analysis (day 5) with the MOG-specific antibodies r8-18C5 (positive control), SAI (abolished C1q binding with intact FcγR binding), or TAP (abolished binding to C1q and to FcγRI and FcγRIV). The antibody HK3 was used as negative control. For each experimental animal, consecutive spinal cord sections were subjected to Kluver–Barrera (KL) staining to show the presence (turquoise) or absence (light blue/pink) of myelin, or to stainings with antibodies specific for human immunoglobulin G (hIgG, brown) to reveal the presence of the antibodies in the tissue, for complement C9neo (C9neo, red) to reveal the terminal membrane attack complex as indicator for complement-dependent (cellular) cytotoxicity, and with the antibody ED1 (brown) specific for macrophages/activated microglia needed for antibody-dependent cellular cytotoxicity. Counterstaining was done with hematoxylin to reveal nuclei (blue). Bar = 100 µm. (B) The spinal cords were used for the quantification of demyelination of animals after 48 h of antibody injection (black dots) or 72 h (red dots) of injection. We normalized the 48-h animals (TAP, SAI, and HK3) to the mean value of demyelination (mm2) of all rats for r8-18C5 and expressed it as percentage. In the same figure, we also merged the 72-h animals which we label in red (normalized to the r8-18C5 after 72 h). One-way ANOVA with Tukey’s test (four groups) was performed for comparison between groups. P < 0.05 was considered significant.
Fig. 4.
Fig. 4.
Clinical EAE in the model with cognate MOG-specific T cells and mutated MOG-Abs. Lewis rats were injected with MOG-specific T cells that do not induce clinical disease on their own. At day 2, the indicated nonmutated MOG-Abs, the mutated MOG-Abs, and the control Ab HK3 were injected intraperitoneally. Histology and FACS analysis of the infiltrates were performed at day 5. Development of the clinical disease over time. The clinical score displayed represents the mean + SEM of the following number of animals. r8-18C5 (n = 3), SAI (n = 3), TAP (n = 3), HK3 (n = 3). One-way ANOVA with Tukey’s test (four groups) was performed for comparison between groups. P < 0.05 was considered significant. Day 4: r8-18C5 vs. SAI = ns; r8-18C5 vs. TAP P ≤ 0.01; r8-18C5 vs. HK3 P ≤ 0.001; SAI vs. TAP P ≤ 0.01; SAI vs. HK3 P ≤ 0.001; TAP vs. HK3 = ns. Day 5: r18C5 vs. SAI =ns; 8-18C5 vs. TAP P ≤ 0.05; r8-18C5 vs. HK3 ≤ 0.001(***), SAI 5 vs. TAP P ≤ 0.05; SAI vs. HK3 P ≤ 0.001; TAP vs. HK3 = ns.
Fig. 5.
Fig. 5.
Pathology of the EAE induced by MOG-specific T cells and mutated MOG antibodies. Lewis rats received MOG-specific T cells 2 d before the MOG-specific antibodies r8-18-C5 (positive control), SAI (abolished C1q binding and intact FcγR binding), TAP (abolished C1q binding and abolished binding to FcγRI and FcγRIV), or the control Ab HK3 were injected. After 72 h, about half of the spinal cords were fixed with PFA, embedded, and analyzed for histopathology (A and B), while the other half of the spinal cords were processed for FACS analysis (C). (A and B) For each experimental animal, consecutive spinal cord sections were stained with anti-CD3 antibodies to visualize T cells (brown) and the ED1 antibody to show macrophages/activated microglia (brown). Counterstaining was done with hematoxylin to reveal nuclei (blue). Bar = 100 µm. (C) The same spinal cords were used for the quantification of T cells via flow cytometry and their activation status reflected by OX40 expression was determined. MOG-specific T cells were separated from endogenous bystander T cells by their fluorescence properties. The number of MOG-specific T cells is displayed in relation to the amount observed after injection of the r8-18C5 (set as 1). (C) The activation status of endogenous bystander T cells and injected MOG-specific T cells in the CNS inflammatory lesions was determined by staining for the activation marker OX40. One-way ANOVA with Tukey’s test (four groups) was performed for comparison between groups. P < 0.05 was considered significant.

References

    1. Dalmau J., Graus F., Antibody-mediated encephalitis. N. Engl. J. Med. 378, 840–851 (2018), 10.1056/NEJMra1708712. - DOI - PubMed
    1. Prüss H., Autoantibodies in neurological disease. Nat. Rev. Immunol. 21, 798–813 (2021), 10.1038/s41577-021-00543-w. - DOI - PMC - PubMed
    1. Ludwig R. J., et al. , Mechanisms of autoantibody-induced pathology. Front. Immunol. 8, 603 (2017), 10.3389/fimmu.2017.00603. - DOI - PMC - PubMed
    1. Mader S., Kumpfel T., Meinl E., Novel insights into pathophysiology and therapeutic possibilities reveal further differences between AQP4-IgG- and MOG-IgG-associated diseases. Curr. Opin. Neurol. 33, 362–371 (2020), 10.1097/wco.0000000000000813. - DOI - PubMed
    1. Lee D. S. W., Rojas O. L., Gommerman J. L., B cell depletion therapies in autoimmune disease: Advances and mechanistic insights. Nat. Rev. Drug Discov. 20, 179–199 (2021), 10.1038/s41573-020-00092-2. - DOI - PMC - PubMed

Publication types