. 2023 Mar 30;186(7):1398-1416.e23.
doi: 10.1016/j.cell.2023.02.027. Epub 2023 Mar 20.

Human T cell generation is restored in CD3δ severe combined immunodeficiency through adenine base editing

Affiliations

Human T cell generation is restored in CD3δ severe combined immunodeficiency through adenine base editing

Grace E McAuley et al. Cell. .

Abstract

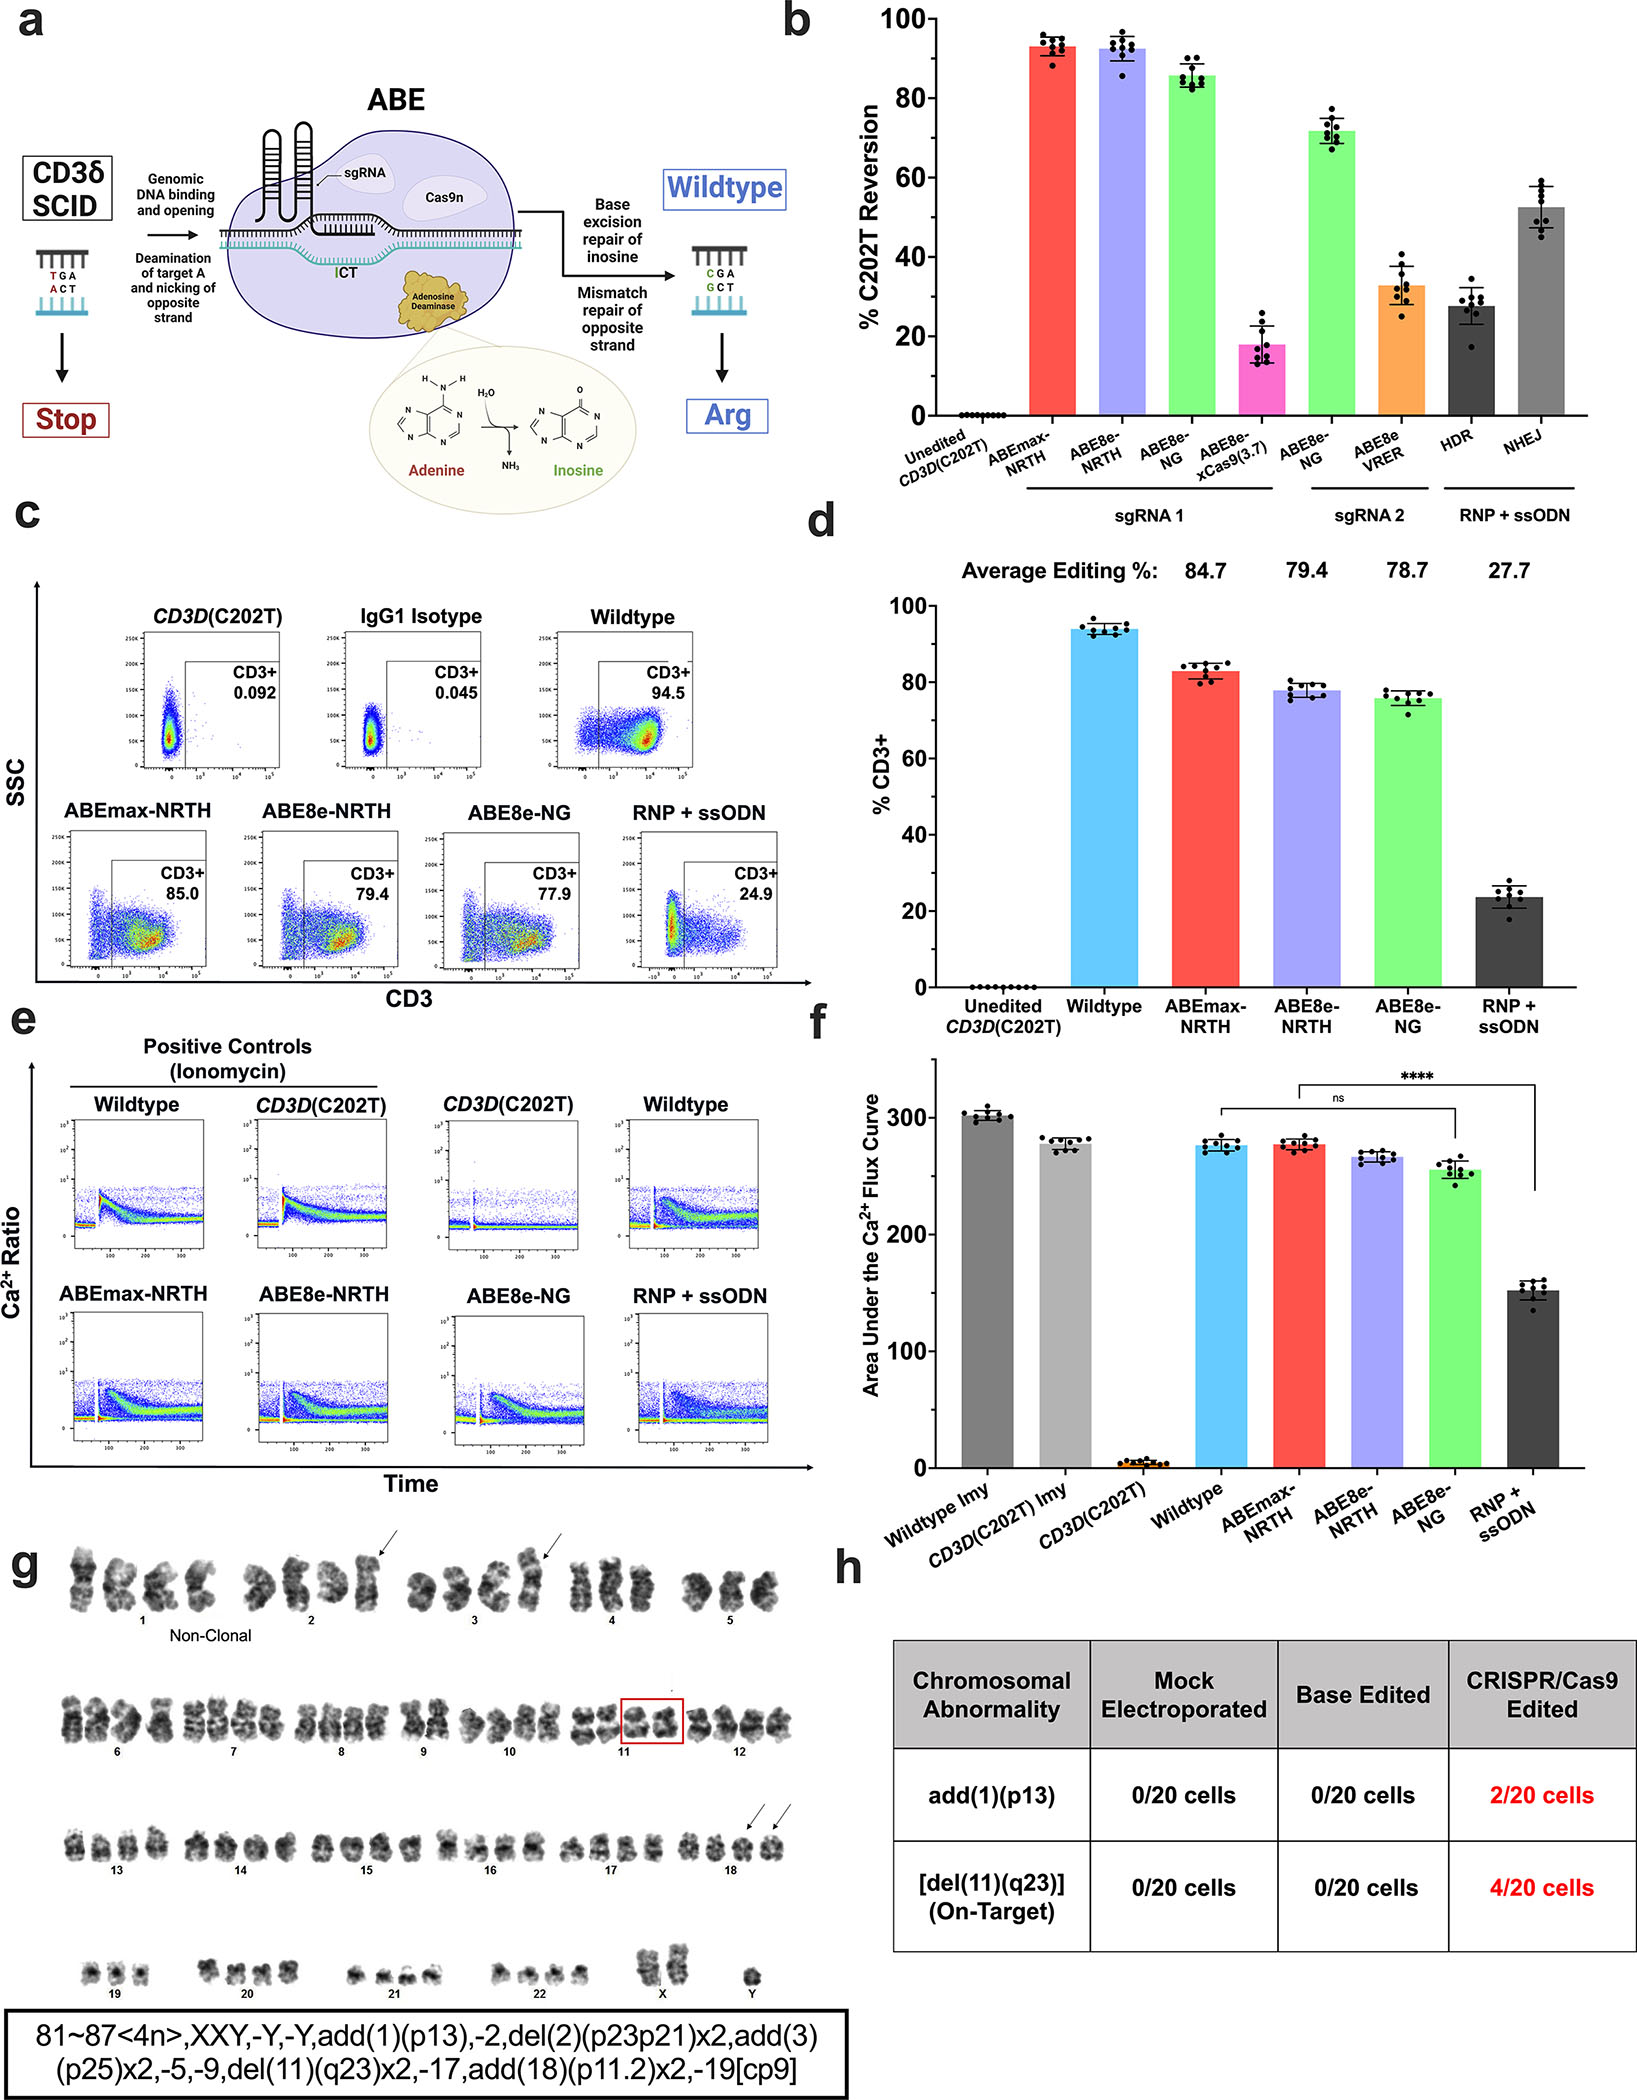
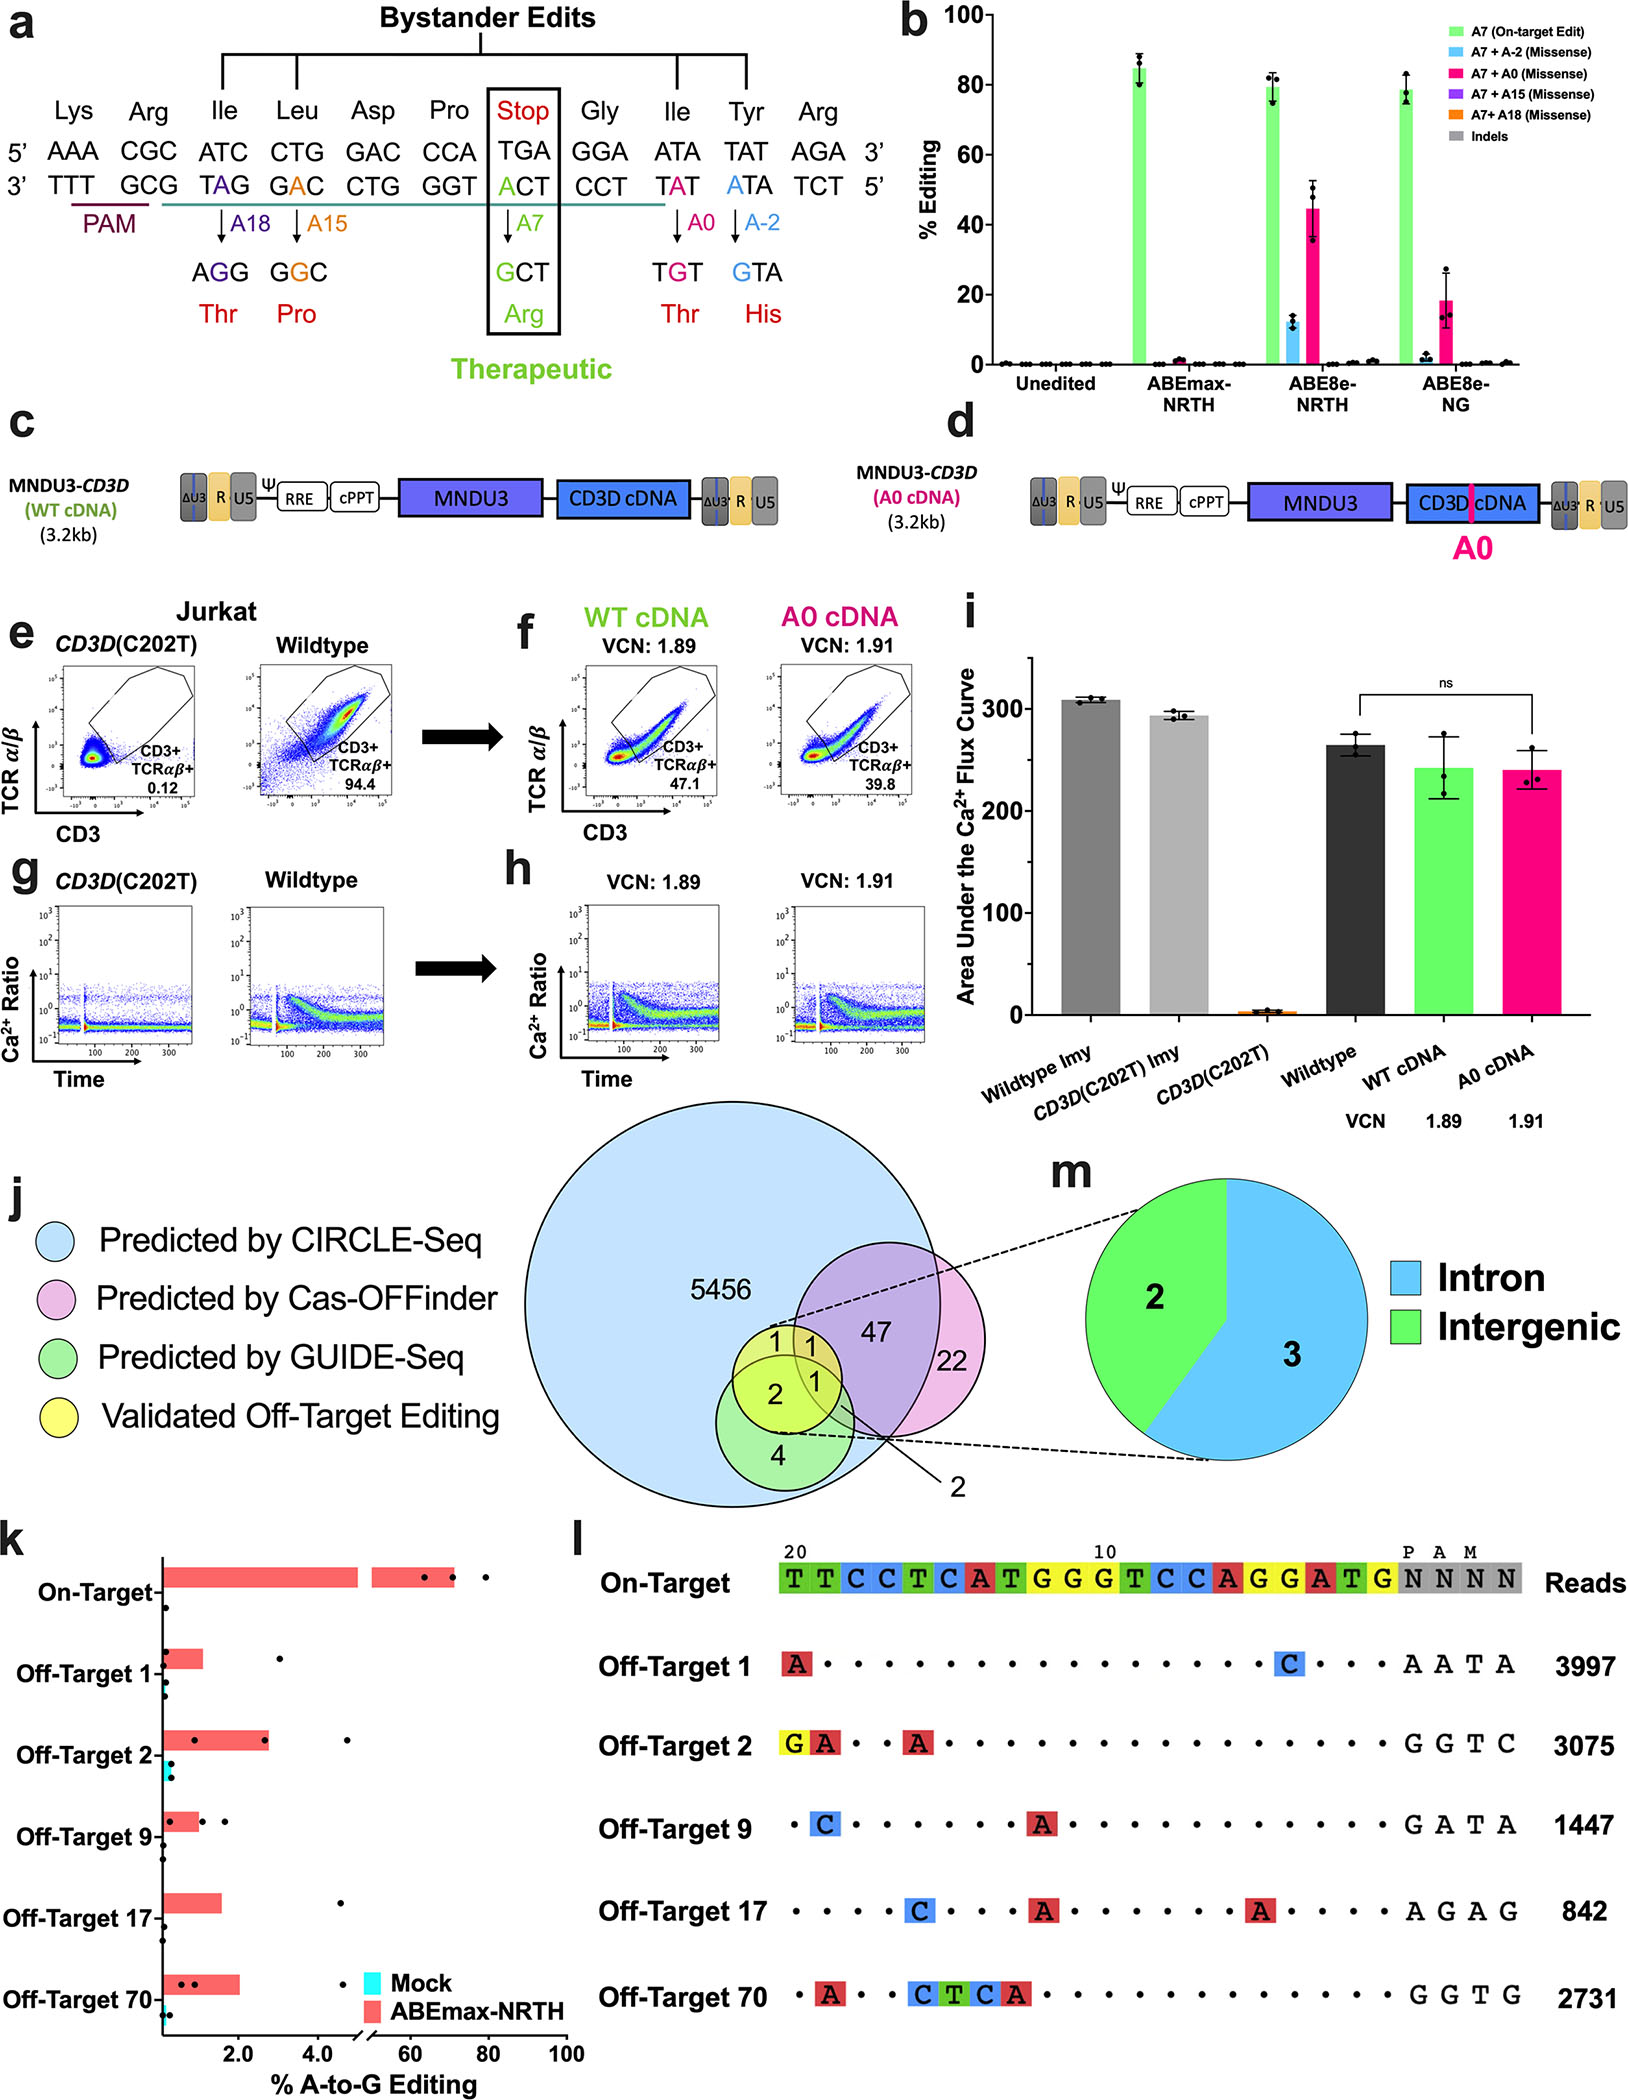
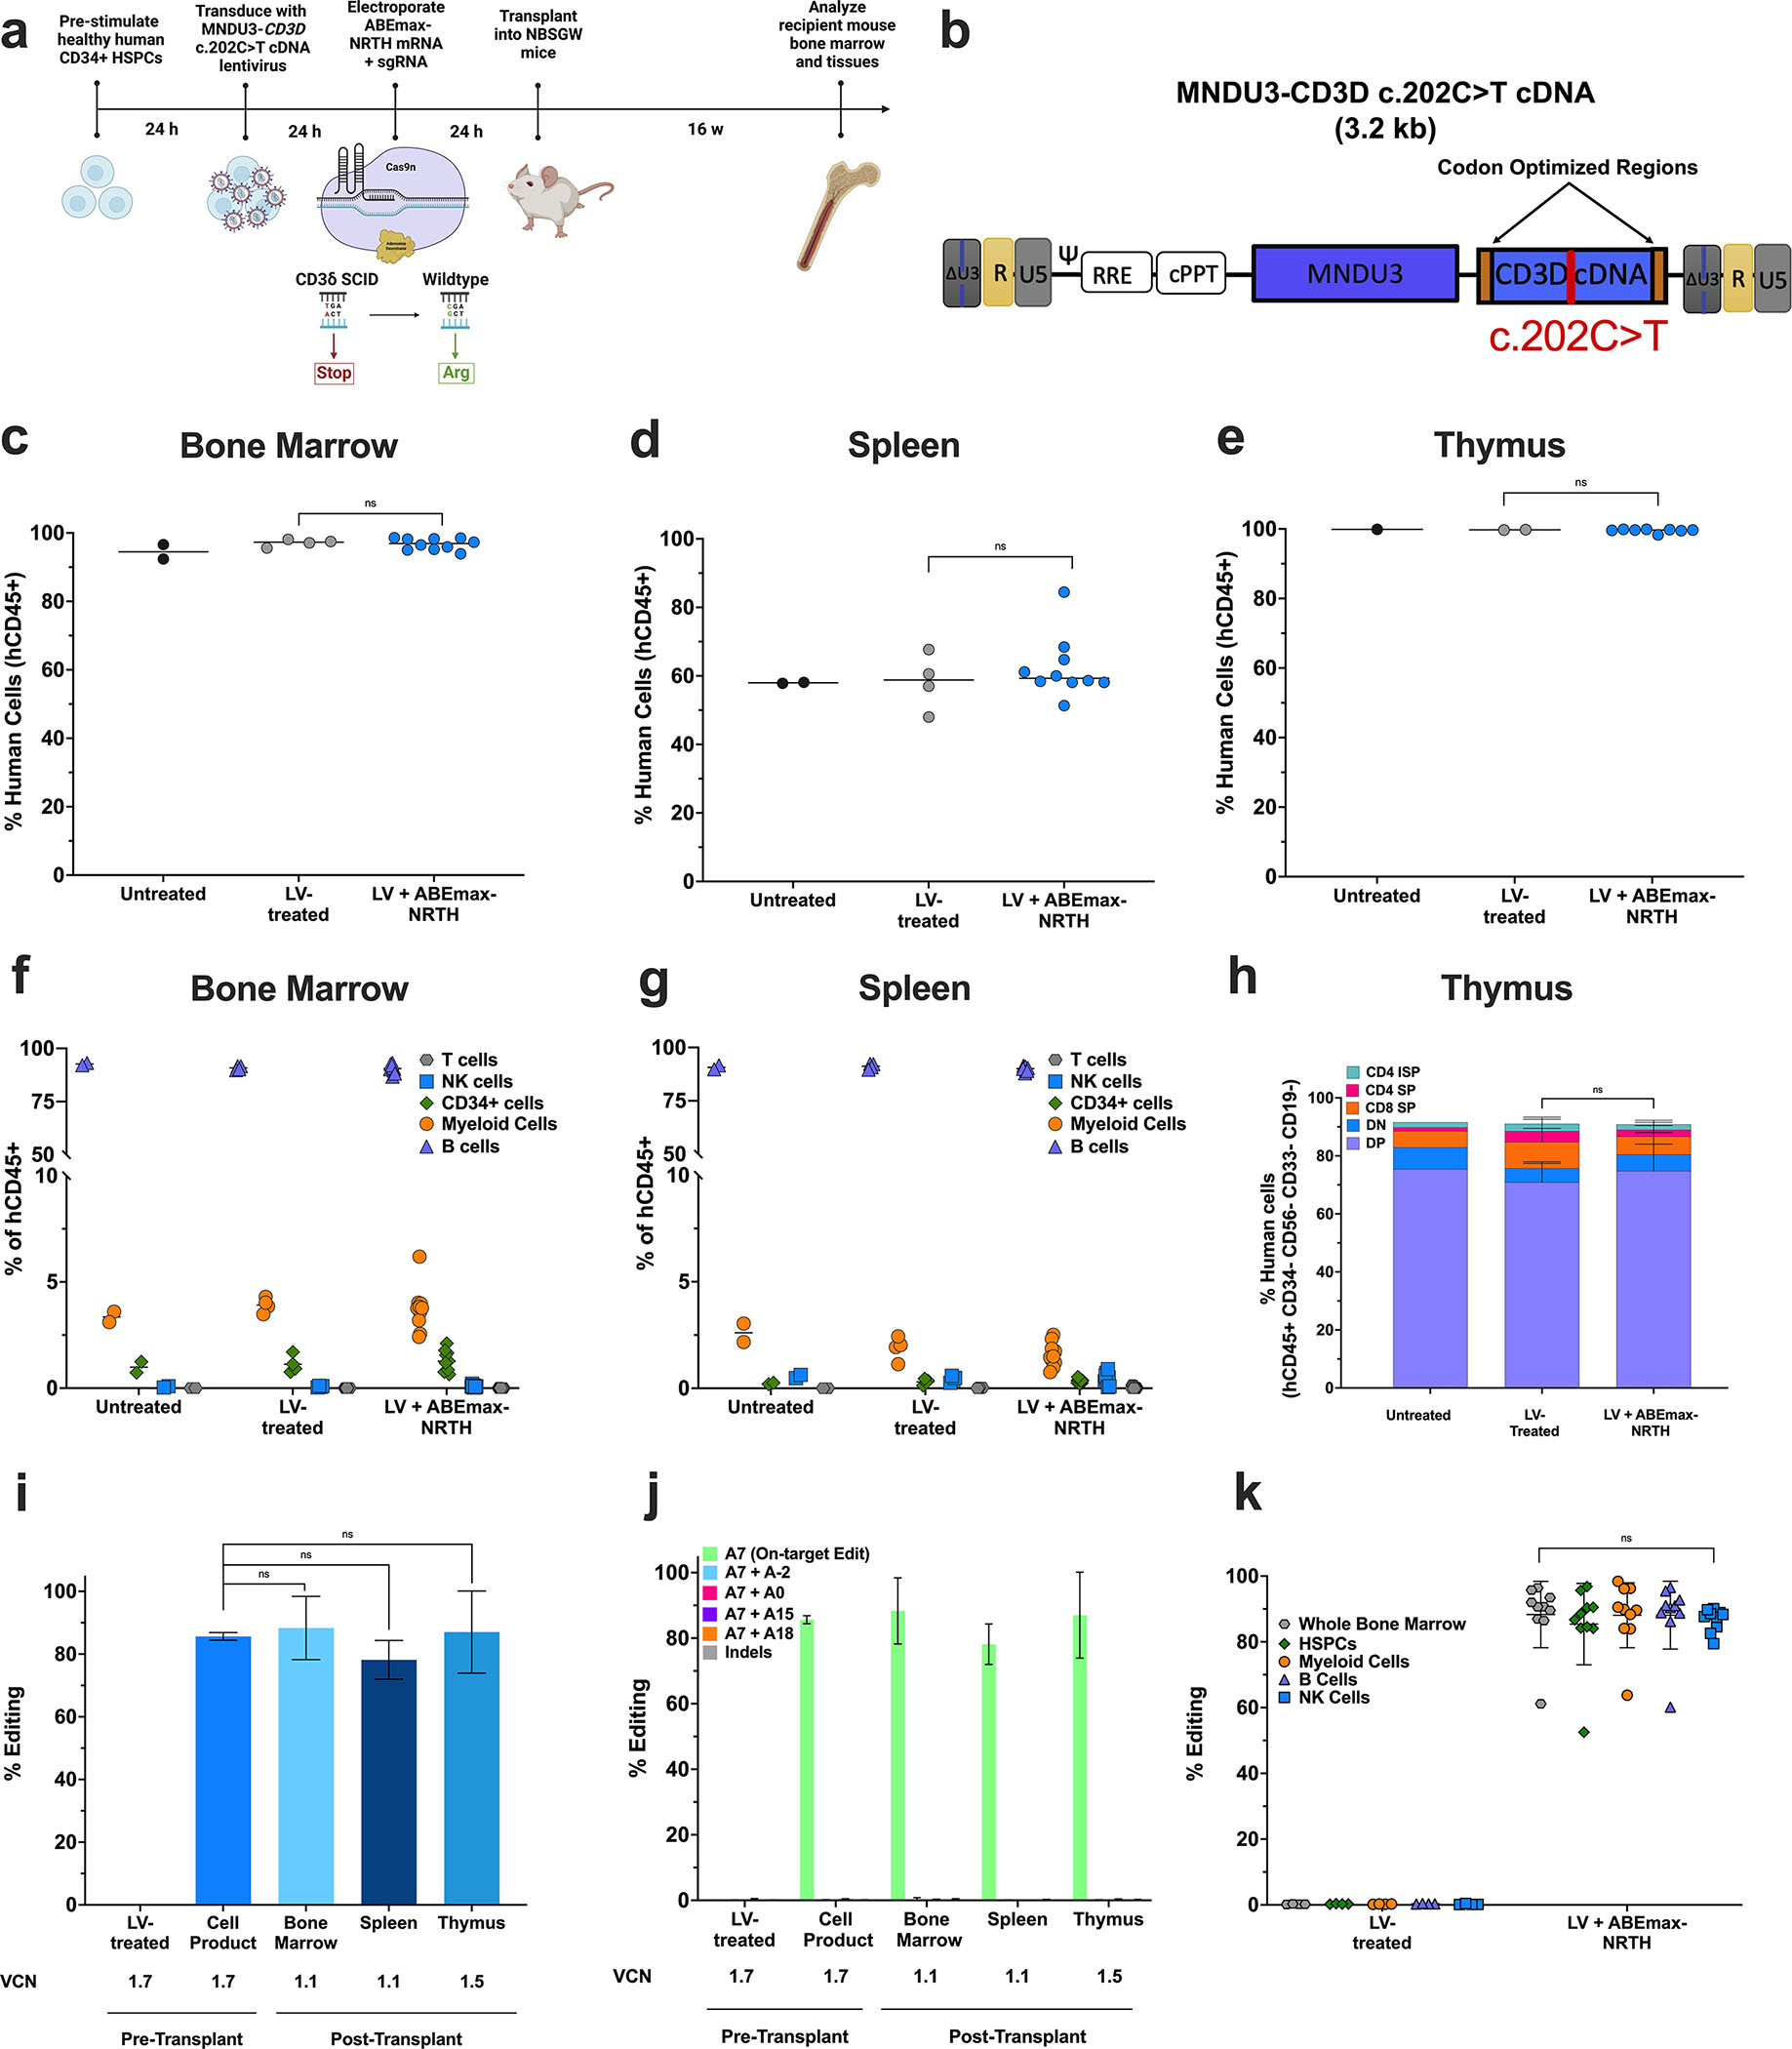
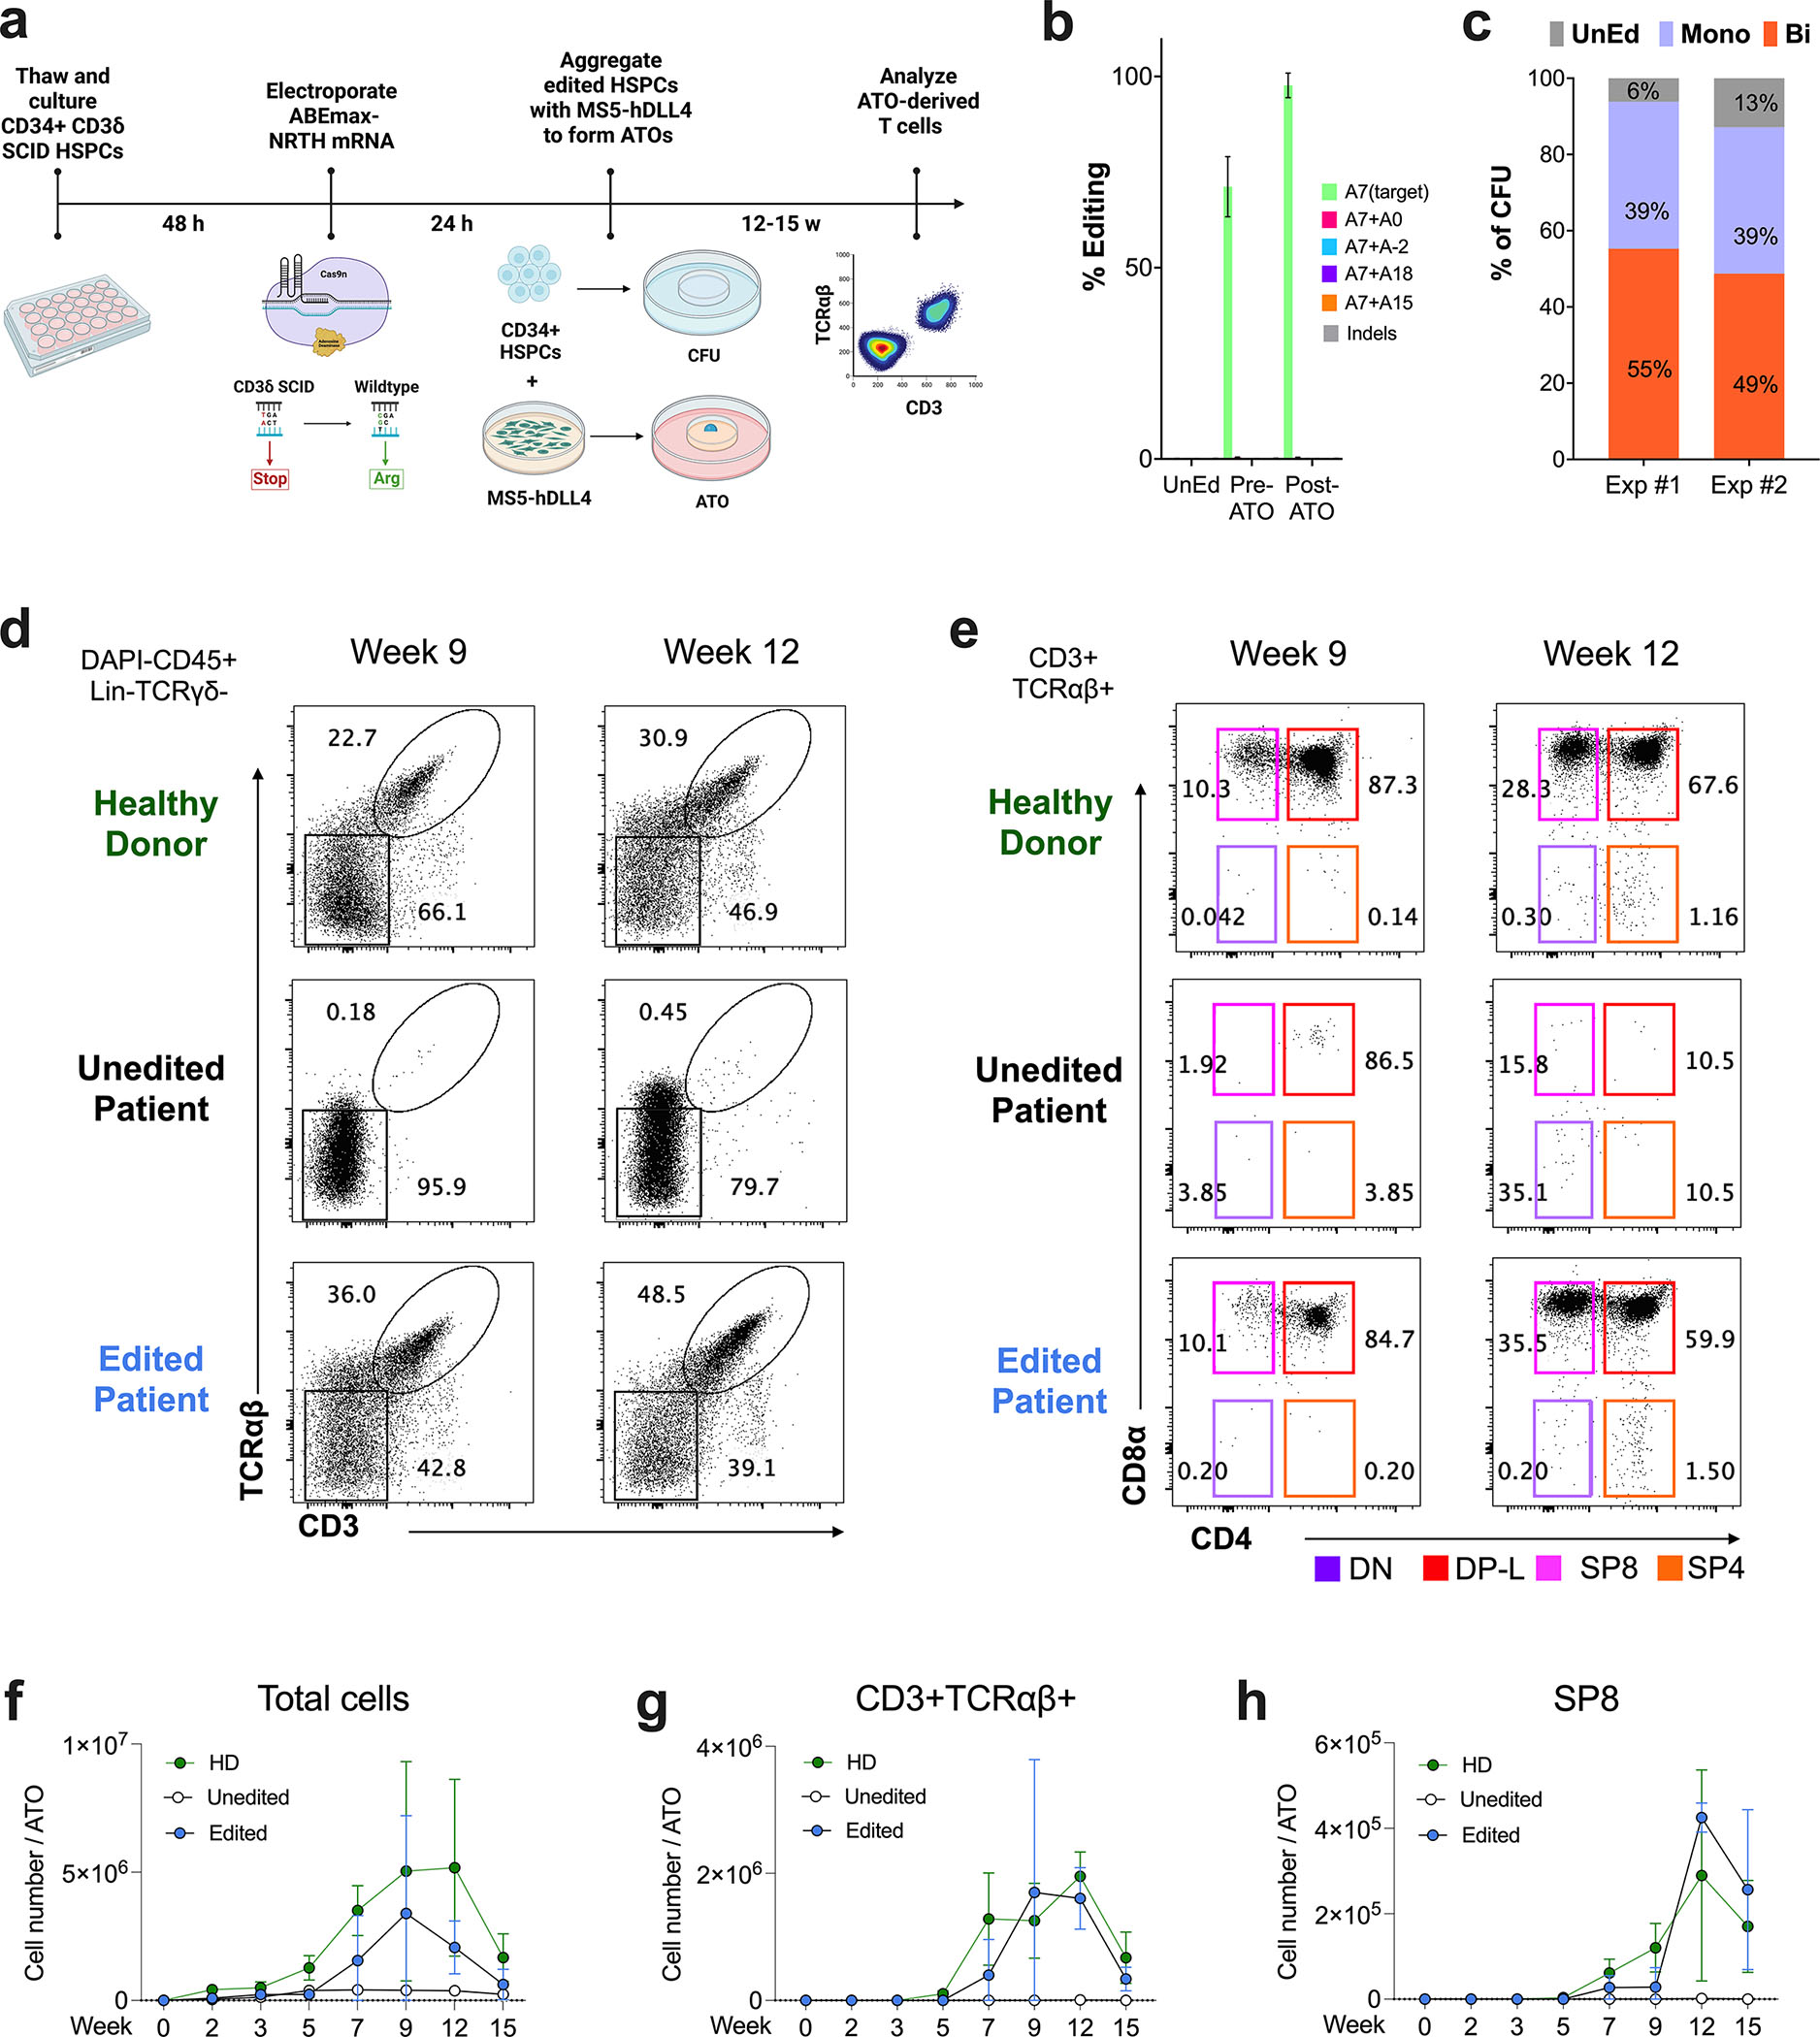
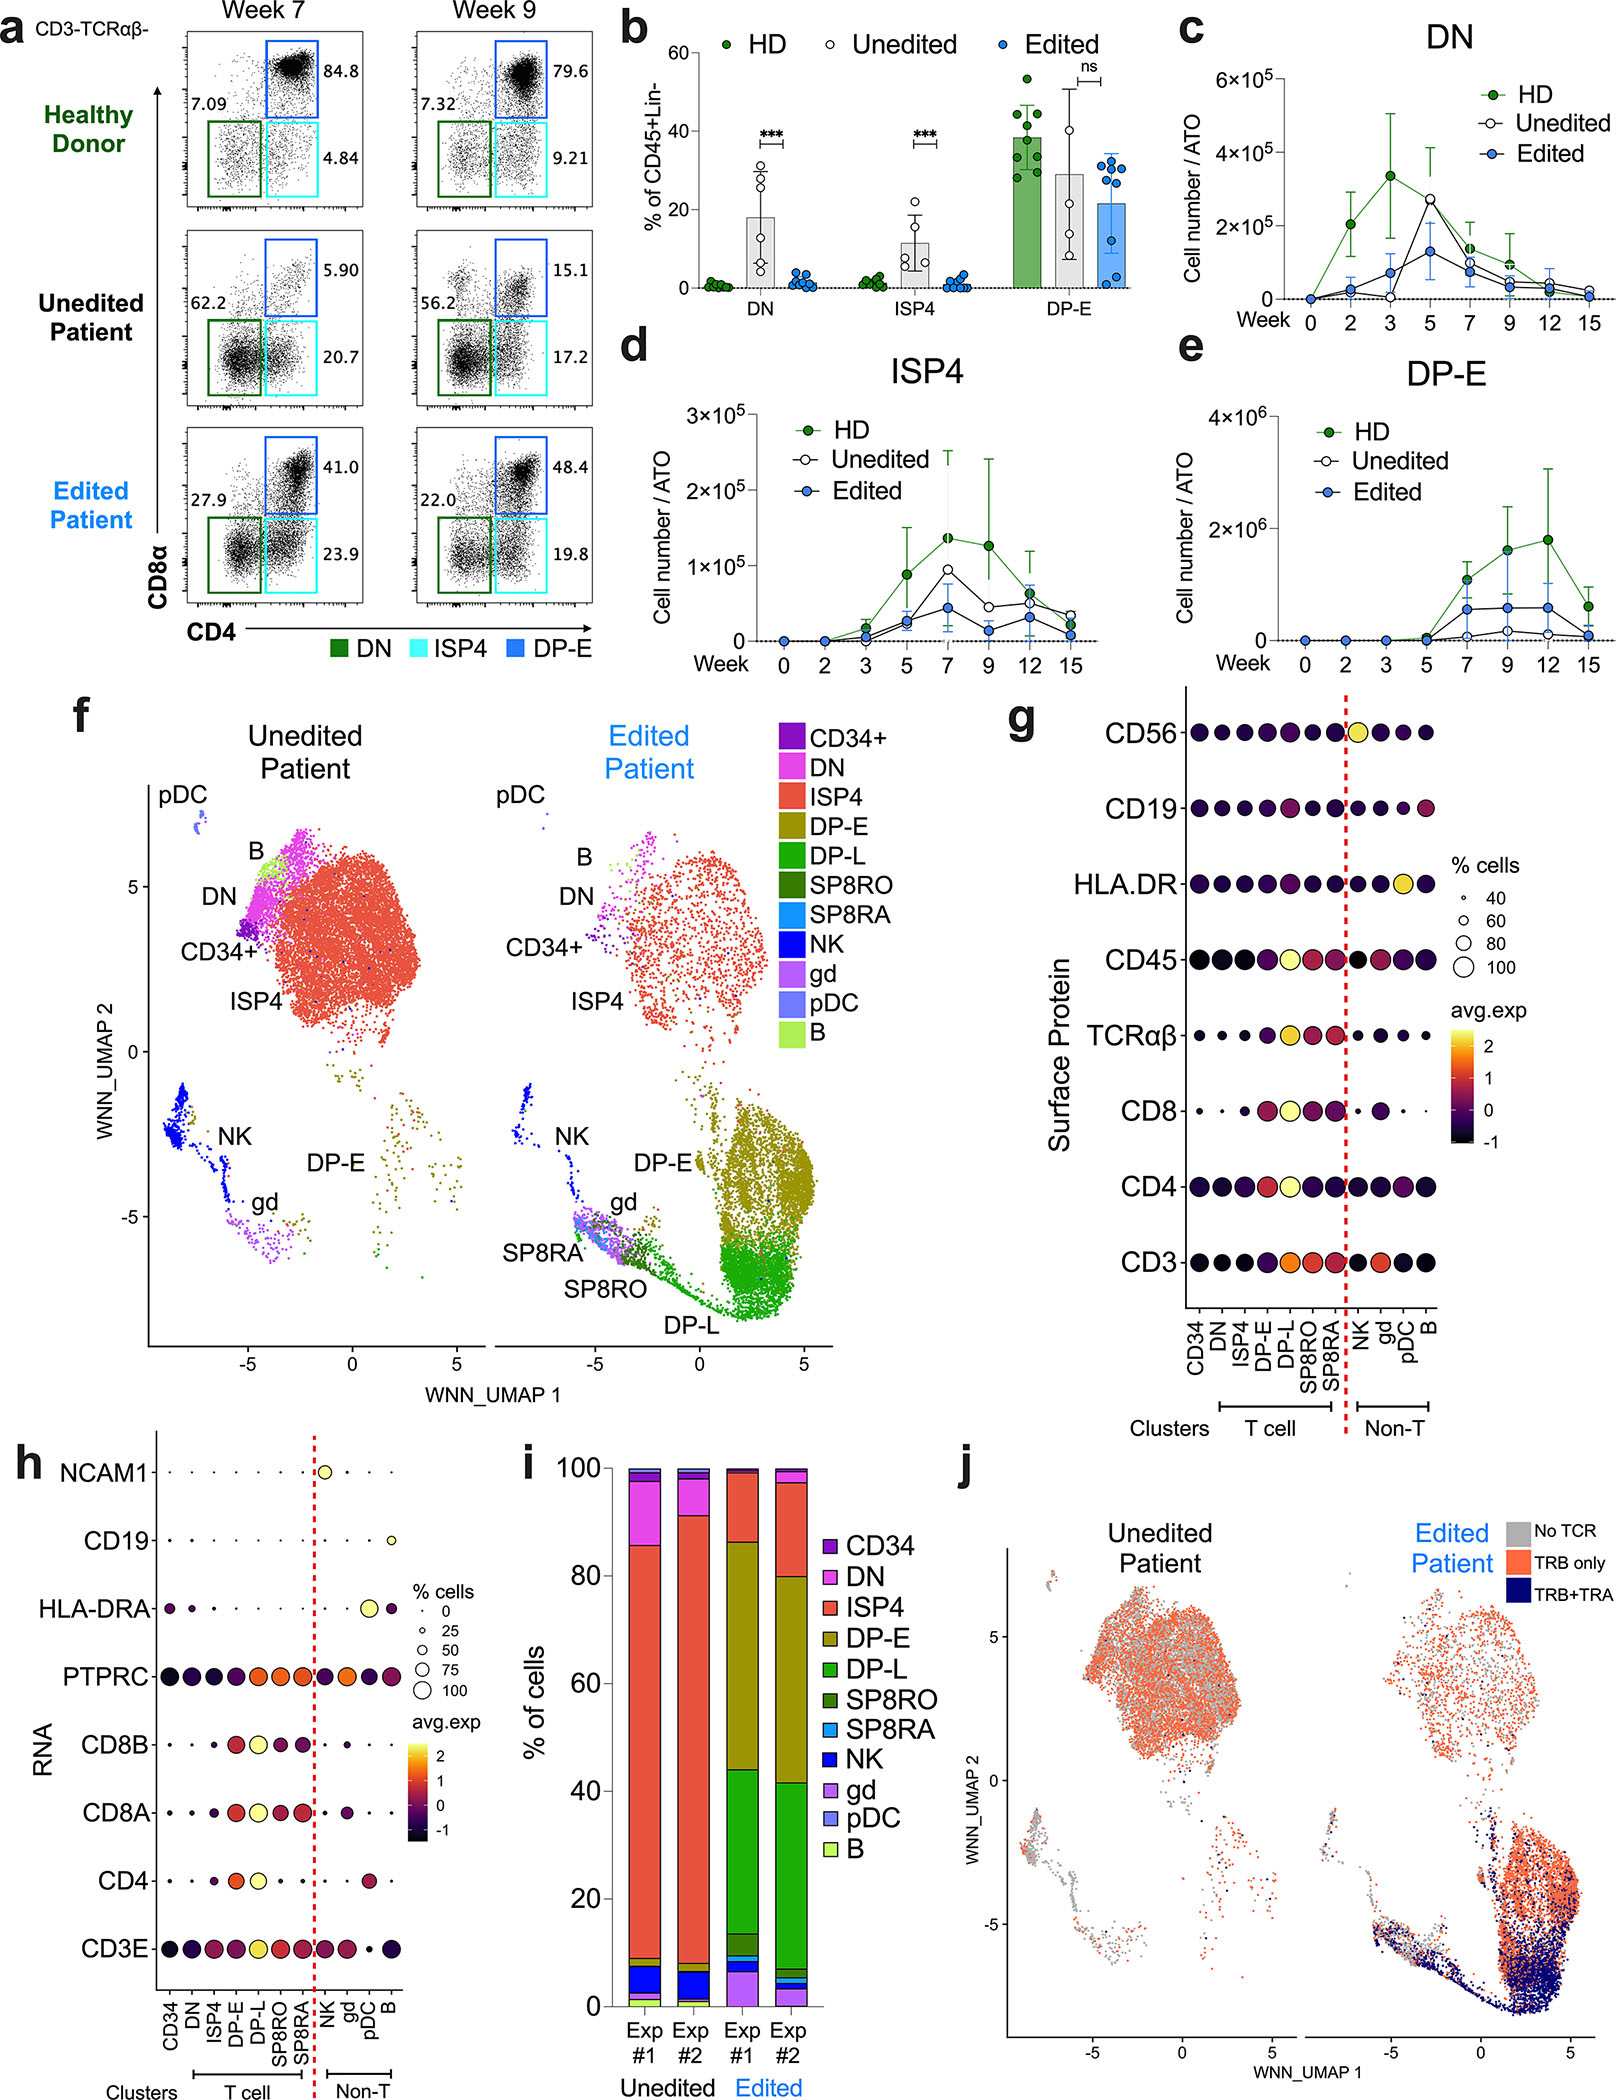
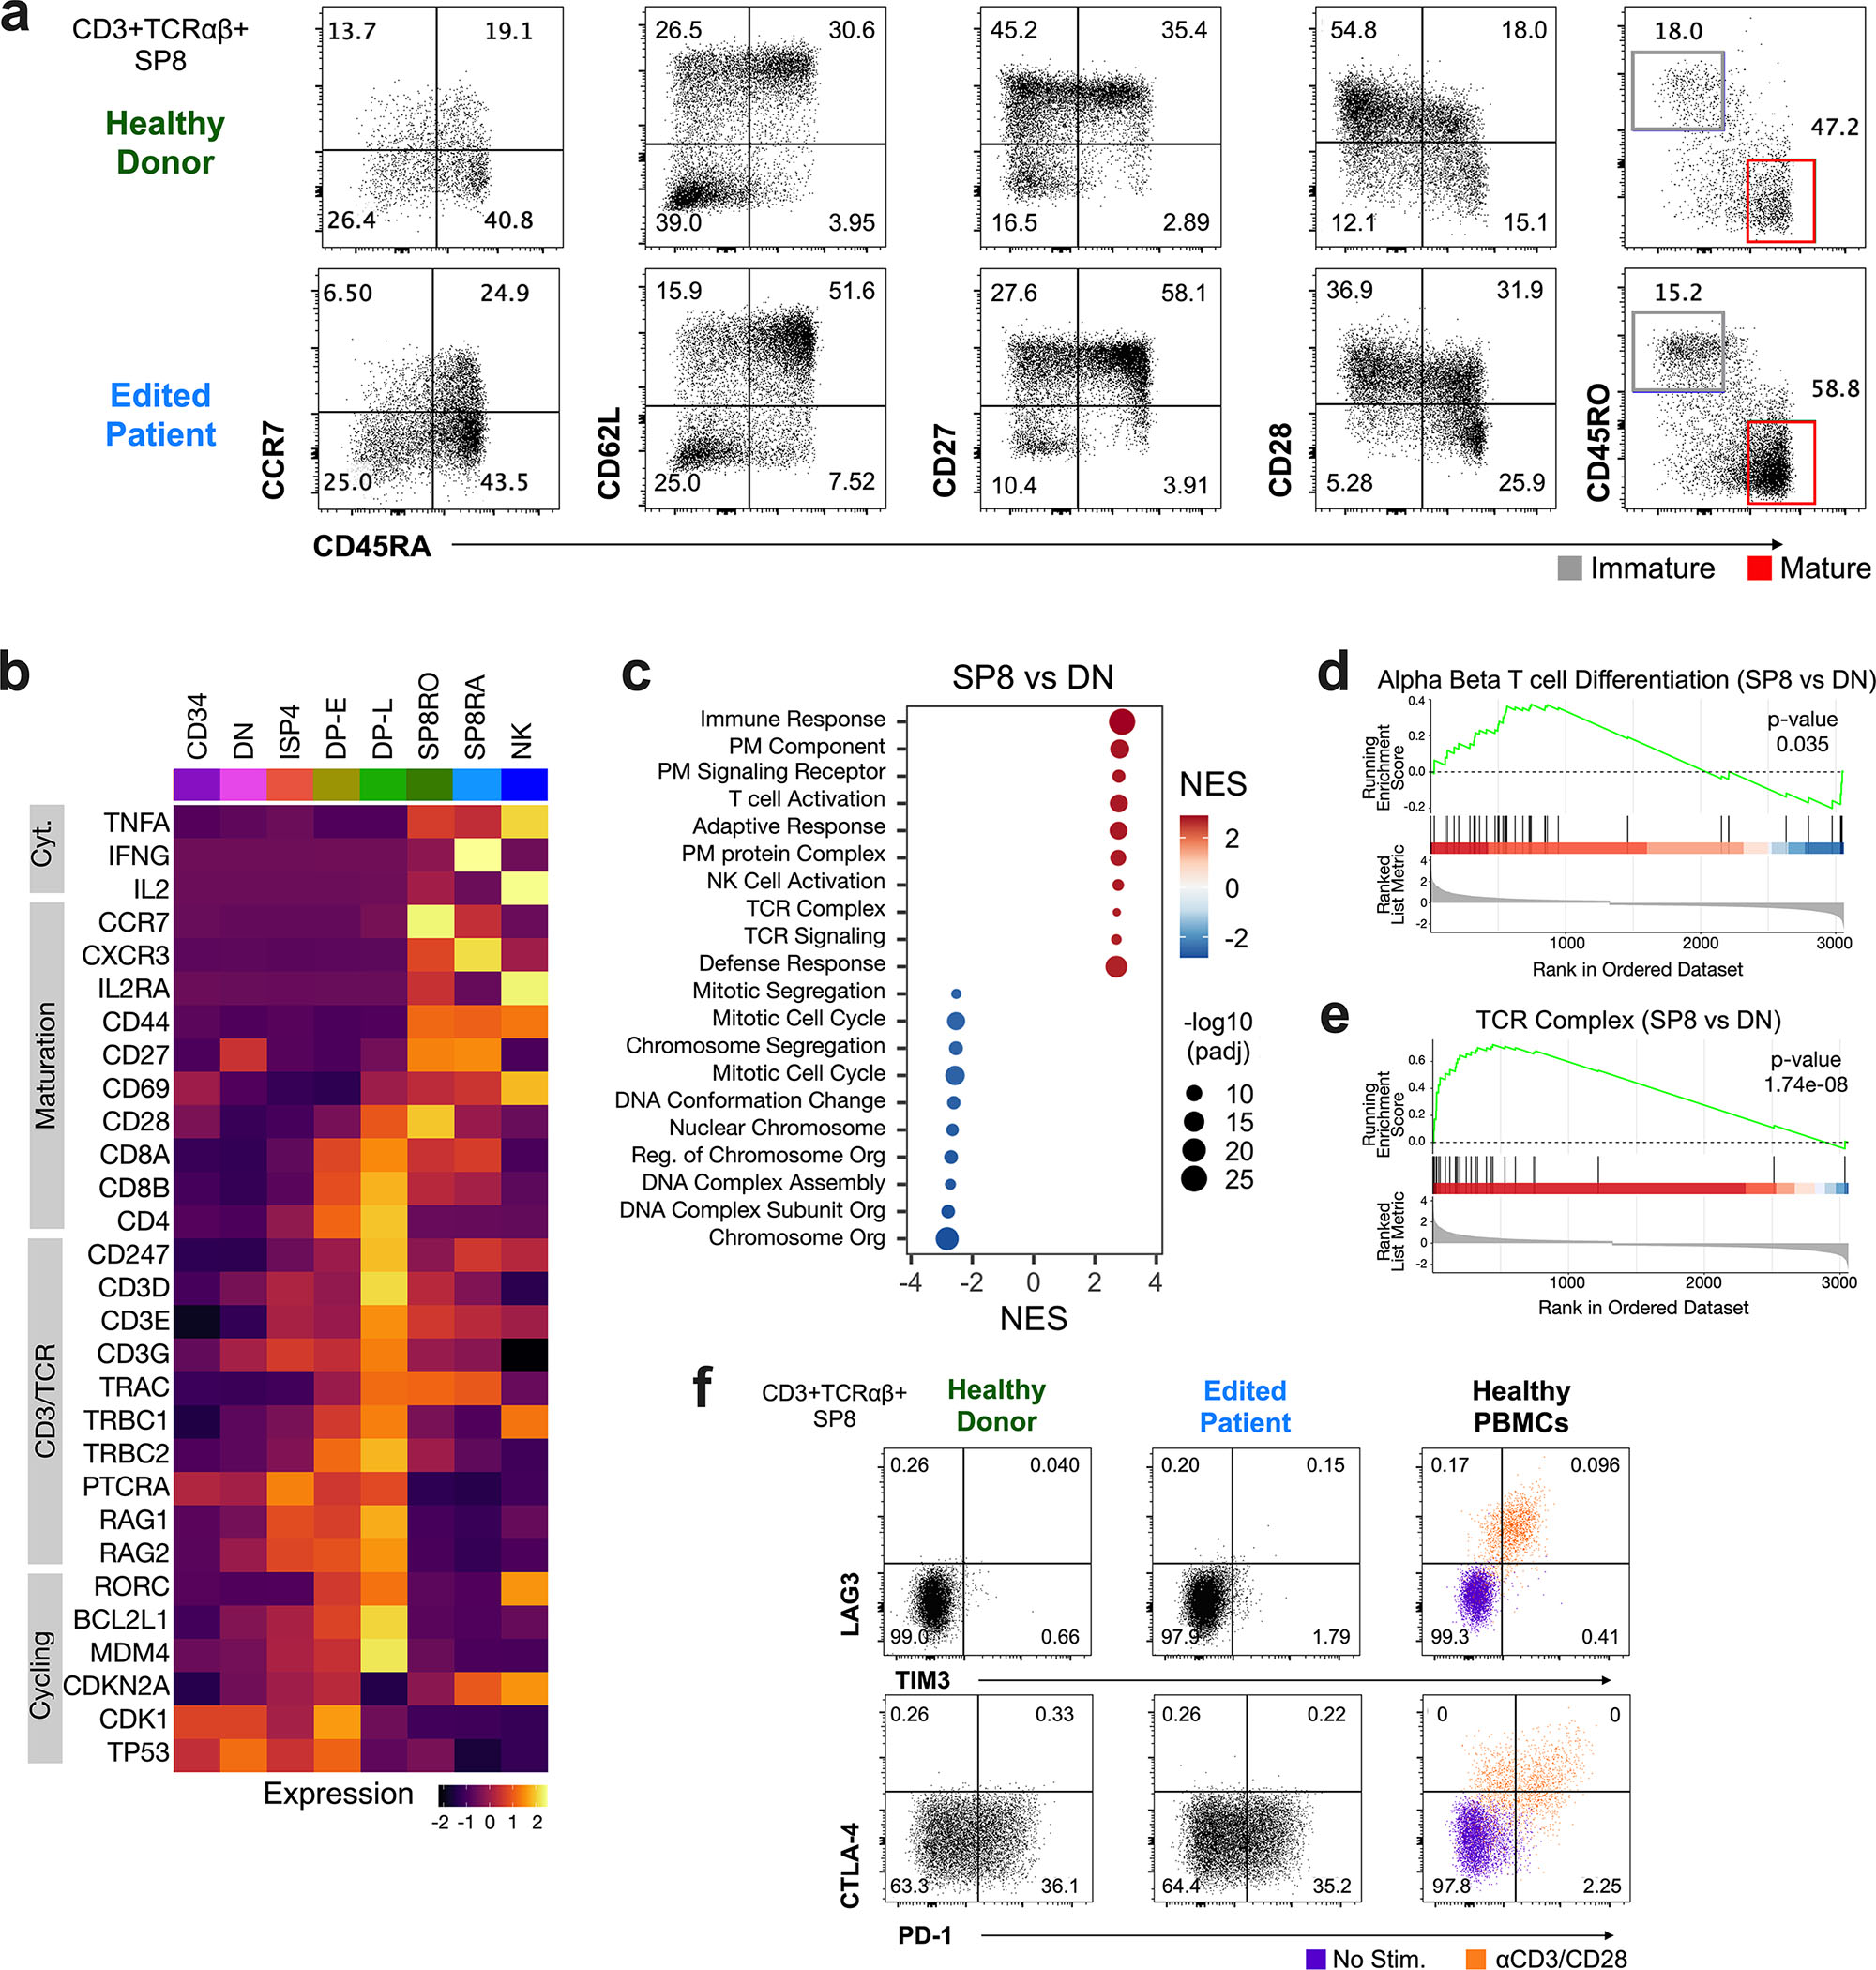
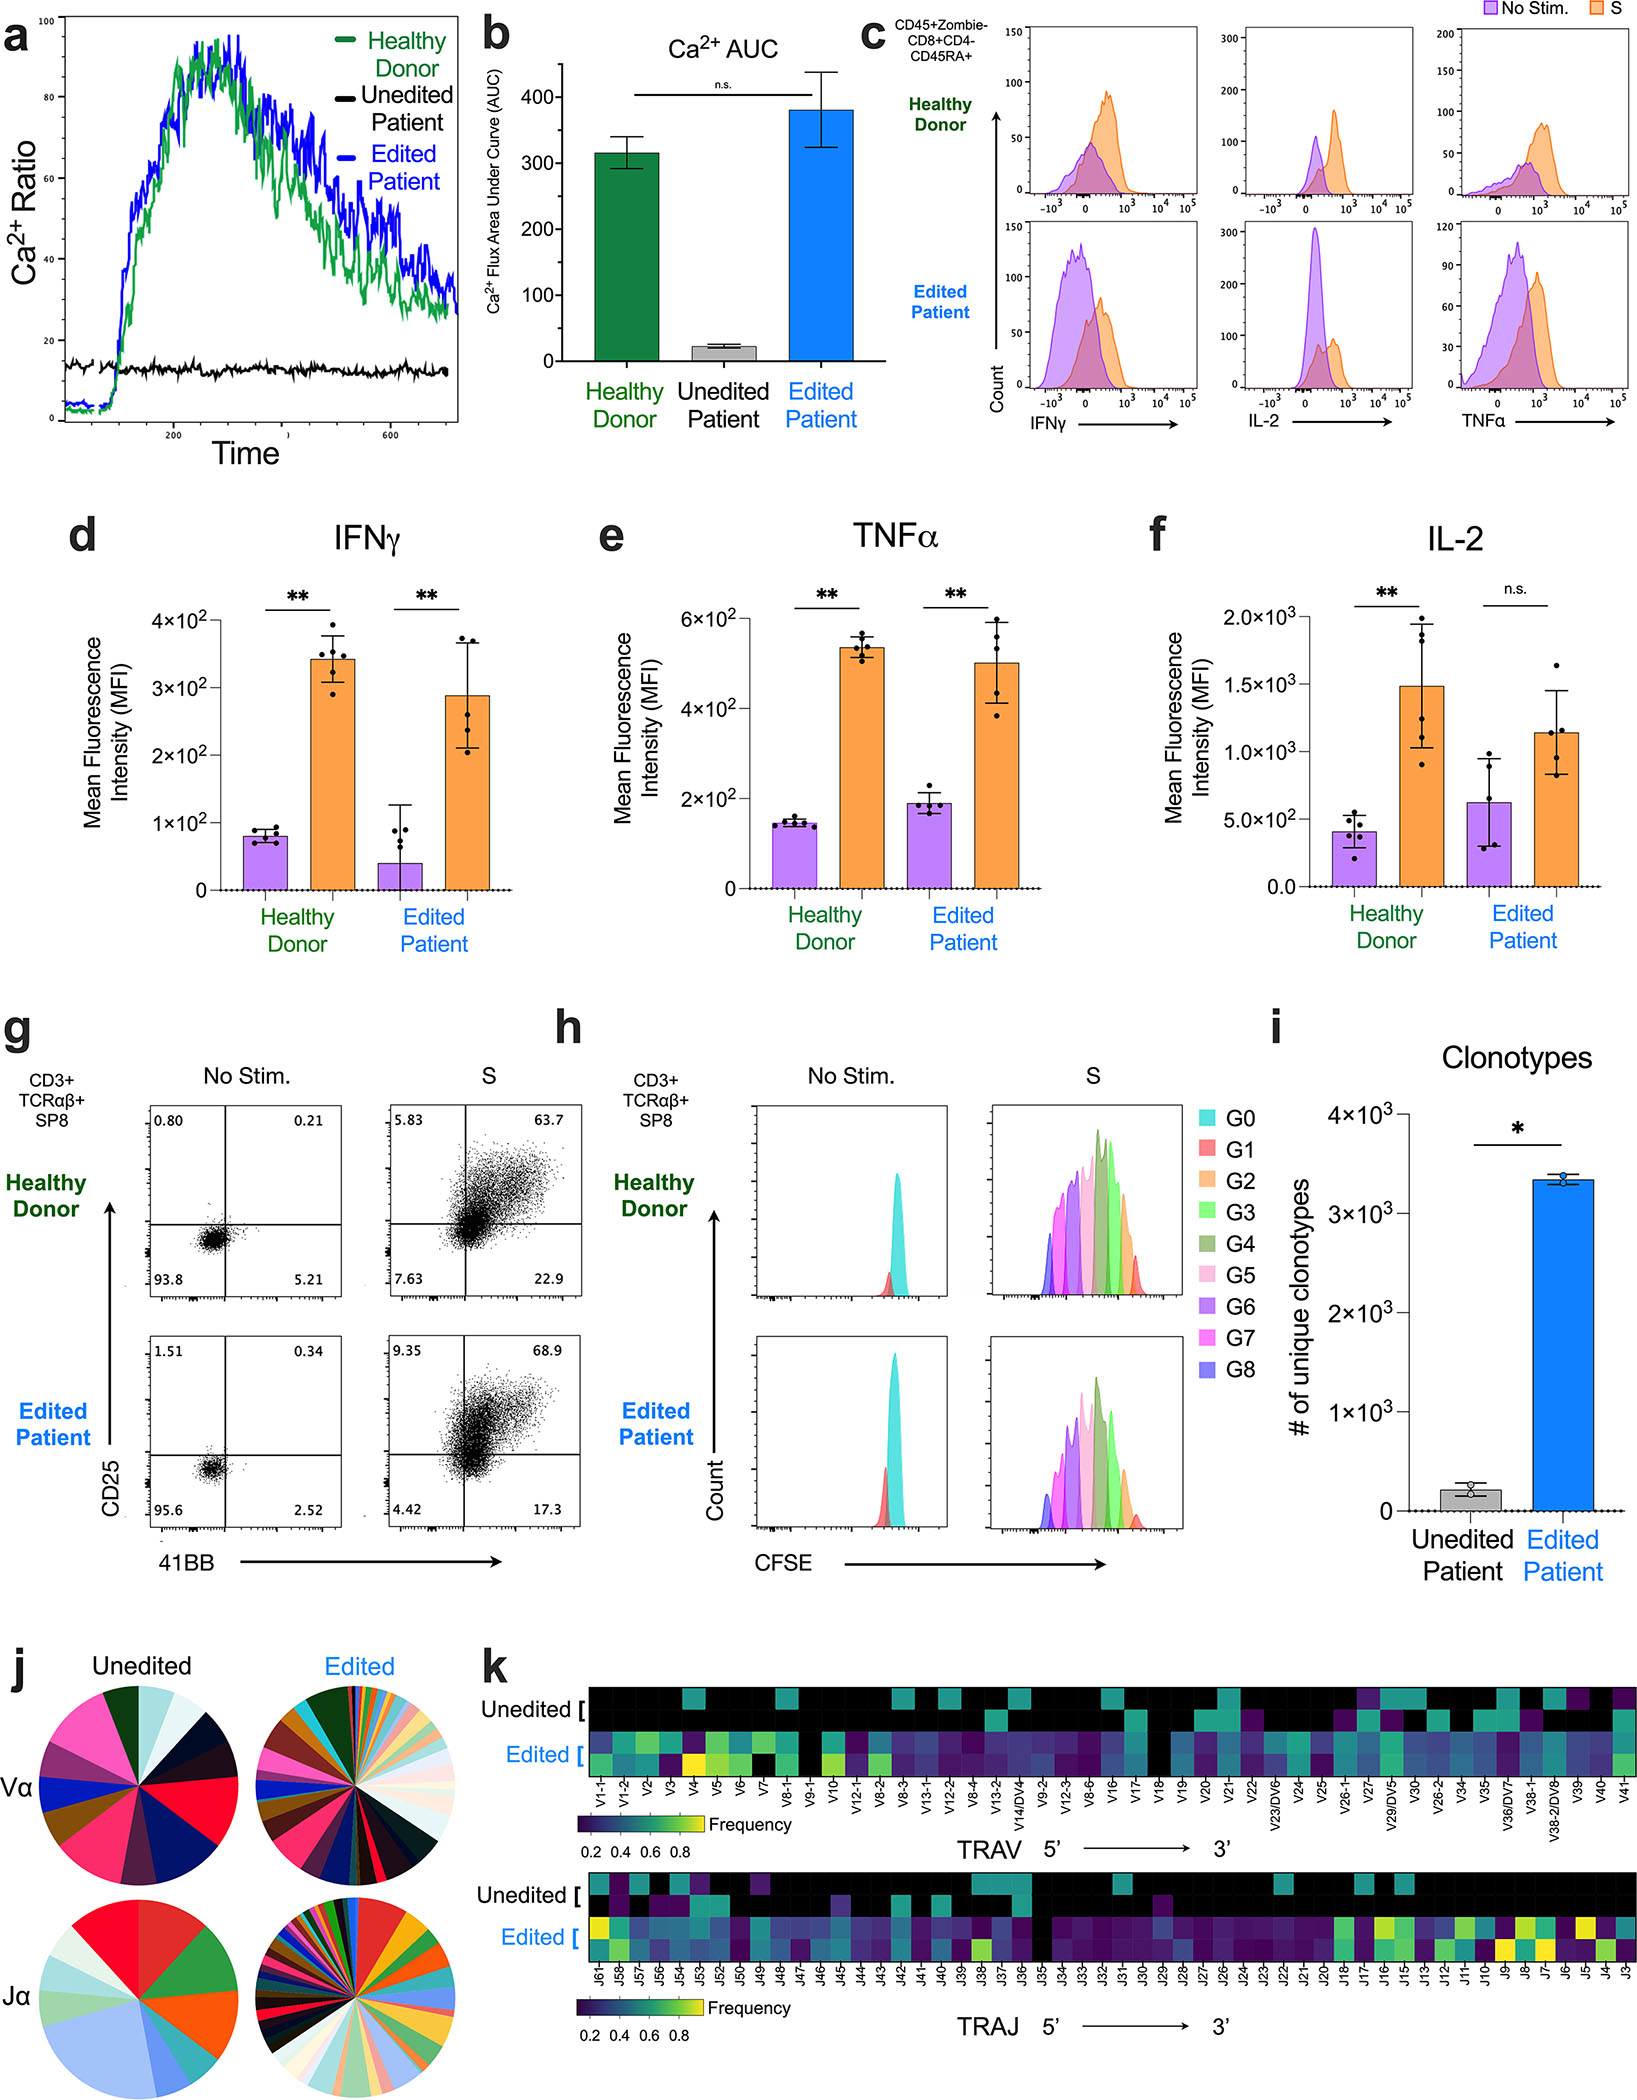
CD3δ SCID is a devastating inborn error of immunity caused by mutations in CD3D, encoding the invariant CD3δ chain of the CD3/TCR complex necessary for normal thymopoiesis. We demonstrate an adenine base editing (ABE) strategy to restore CD3δ in autologous hematopoietic stem and progenitor cells (HSPCs). Delivery of mRNA encoding a laboratory-evolved ABE and guide RNA into a CD3δ SCID patient's HSPCs resulted in a 71.2% ± 7.85% (n = 3) correction of the pathogenic mutation. Edited HSPCs differentiated in artificial thymic organoids produced mature T cells exhibiting diverse TCR repertoires and TCR-dependent functions. Edited human HSPCs transplanted into immunodeficient mice showed 88% reversion of the CD3D defect in human CD34+ cells isolated from mouse bone marrow after 16 weeks, indicating correction of long-term repopulating HSCs. These findings demonstrate the preclinical efficacy of ABE in HSPCs for the treatment of CD3δ SCID, providing a foundation for the development of a one-time treatment for CD3δ SCID patients.

Keywords: CD3D severe combined immune deficiency; CITE-seq; artificial thymic organoid; base editing; hematopoietic stem and progenitor cells.


Conflict of interest statement

Declaration of interests G.M.C. and C.S.S. are founders of Pluto Immunotherapeutics Inc. and serve as consultants to this company. D.R.L. is a consultant and equity holder of Prime Medicine, Beam Therapeutics, Pairwise Plants, and Chroma Medicine, companies that use gene editing or genome engineering.

Figures

Figure 1.
Figure 1.. Adenine Base Editing Efficiently Rescues CD3/TCR Expression and Signaling in a T Cell Line Disease Model
a) Schematic of ABE for CD3δ SCID. b) Plasmids encoding a CD3D-targeting sgRNA and either ABEmax-NRTH, ABE8e-NRTH, ABE8e-NG, ABE8e-xCas9(3.7), or ABE8e-VRER were transfected by electroporation into CD3D(C202T) Jurkat T cells. To assess restoration of CD3 by CRISPR/Cas9 HDR-mediated correction, sgRNA and rCas9 protein (RNP) and ssODN donor were co-electroporated into CD3D(C202T) Jurkat T cells. sgRNAs utilized for BE and HDR approaches were different and designed specifically for their respective use. c-d) Editing efficiencies were measured 5 days after electroporation by high-throughput sequencing (HTS) and restoration of CD3 expression was measured by flow cytometry with an anti-CD3 antibody. e-f) Calcium flux assay and quantified area under the calcium flux curve of treated and untreated CD3D(C202T) Jurkat T cells following stimulation with anti-CD3 and anti-CD28. g) CD3D(C202T) Jurkat T cells treated with RNP + ssODN (CRISPR/Cas9-edited), ABEmax-NRTH and sgRNA, or mock electroporated controls were harvested 24 hours after electroporation for G-banded karyotype analysis. Representative karyotype of one cell edited with Cas9 RNP and ssODN. Representative abnormalities described using the International System for Human Cytogenomic Nomenclature (ISCN). Clonal structural abnormalities inherent to the pseudo-tetraploid Jurkat T cell line (black arrows); “clonal” = at least two cells with the same chromosomal rearrangement. Clonal deletion of 11q23 distal to the on-target editing site (red box). h) Additional clonal structural abnormalities only observed in the CRISPR/Cas9-edited Jurkat T cells. b), d), f) Data shown as mean ± SD of nine replicates from 3 independent experiments. Statistical significance calculated using non-parametric t-test (****p<0.0001); ns, not significant.
Figure 2.
Figure 2.. Characterization of Local Bystander and Genome-Wide Off-Target Editing in CD3D(C202T) Jurkat T cells and CD3δ SCID Patient CD34+ HSPCs
a) Schematic representation of the CD3D target with the on-target A at protospacer position A7 (green) and potential missense bystander edits A18 (purple), A15 (orange), A0 (pink), and A-2 (blue). Resulting amino acid substitutions (red text below). b) Plasmids encoding the CD3D-targeting sgRNA and either ABEmax-NRTH, ABE8e-NRTH, or ABE8e-NG were delivered by electroporation in CD3D(C202T) Jurkat T cells. Editing efficiencies were measured by HTS at on-target and bystander adenines five days after electroporation. c-d) Proviral maps of LVs used to characterize the effects of A0 bystander editing. MNDU3 (Myeloproliferative Sarcoma Virus, Negative Control region deleted Long Terminal Repeat promoter) is used to drive expression of the CD3D cDNA (with or without the A0 mutation). e-i) 14 days after transduction, a flow cytometry and a calcium flux assay were performed. LV vector copy number (VCN) was quantified by droplet digital PCR (ddPCR). j) Venn diagram of potential off-target sites assessed by multiplexed-targeted HTS nominated by CIRCLE-seq (blue), Cas-OFFinder (pink), GUIDE-seq (green), and predicted sites for which off-target editing was observed by HTS (yellow) in CD3δ SCID HSPCs electroporated with ABEmax-NRTH mRNA and sgRNA. k) Bar graphs demonstrate the percentage of sequencing reads containing A•T-to-G•C point mutations within protospacer positions 4–10 at on- and off-target sites in genomic DNA from treated and untreated CD3δ SCID HSPCs (n=3). l) CIRCLE-seq read counts and alignment to the on-target guide sequence for each validated off-target site. m) Genomic locations of validated off-target sites. b and i) Data shown as mean ± SD of 3 independent experiments. Statistical significance was calculated by non-parametric t-test; ns, not significant.
Figure 3.
Figure 3.. Engrafted Healthy Human HSPCs Retain High Levels of Gene Correction in a Humanized Mouse Model
a) Experimental timeline for xenograft studies. b) Proviral map of lentiviral disease target for integration in healthy CD34+ HSPCs. Components of the LV are similar to those described in Fig. 2c–d, with the exception of 20 bp codon optimized regions on N- and C-termini (orange boxes) of the CD3D cDNA to allow for specific targeted DNA amplification of the CD3D cDNA (not the endogenous CD3D gene) for base editing analysis. 16 weeks after infusion, engraftment was measured by percentage of human CD45+ cells in recipient mice c) bone marrow, d) spleen, and e) thymus. Abundance of human CD19+ B cells, CD33+ myeloid, CD34+ HSPCs, CD56+ NK cells, and CD3+ T cells were measured as percentages of the hCD45+ population in transplant recipient f) bone marrow and g) spleen. h) Thymocytes as percentages of the hCD45+ population in recipient mouse thymus. i) CD3D c.202C>T editing efficiency and VCN determined by HTS and ddPCR, respectively, in cells cultured for 14 days after electroporation (pre-transplant) or in whole tissues 16 weeks after transplant. j) HTS of on-target and bystander adenines in the pre-transplant HSPC cell product and bulk tissues post-transplant. k) CD3D c.202C>T editing efficiency in human-derived hematopoietic lineages FACS sorted from mouse bone marrow. n=2 mice that received untreated cells, n=4 mice that received LV-transduced cells, and n=10 mice that received LV-transduced and edited cells. Data shown as mean ± SD; k) one-way ANOVA, c-j) non-parametric t-test; ns, not significant.
Figure 4.
Figure 4.. Base Editing of CD3δ SCID CD34+ HSPCs Rescues T cell Differentiation
a) Workflow of T cell differentiation: HSPCs were isolated from bone marrow of a patient with CD3δ SCID and electroporated with ABEmax-NRTH mRNA and sgRNA localizing to the CD3D c.202C>T mutation. Treated cells were aggregated with MS5-hDLL4 stromal cells and installed on a cell culture insert for ATO differentiation. b) HTS editing efficiencies at target and bystander adenines (see Fig. 2a for descriptions of nomenclature) and indels after 5 days of in vitro culture post-electroporation (‘pre-ATO’) and 12–15 weeks after T cell differentiation (‘post-ATO’), UnEd, unedited. A portion of cells were plated in methylcellulose for a CFU assay. c) Clonal editing outcomes determined by HTS of the CD3D target by analysis of individual day 14 CFUs. Exp #1, n=100 CFUs and Exp #2, n=130 CFUs. Mono, monoallelic; Bi, biallelic. d-h) Kinetics of T cell differentiation in ATOs derived from CD34+ HSPC, d-e) Representative flow cytometry profiles of d) CD3+ and TCRαβ+ expression gated on DAPI-CD45+Lin-(CD56-CD14-)TCRγδ-, and CD4 and CD8α expression in e) CD3+TCRαβ+ cells gated on CD45+Lin-. HD (top), unedited patient (middle), and edited patient (bottom) ATOs (n=6–9 for each time point). Cell counts of f) total cell output, g) CD3+TCRαβ+, and h) SP8 T cells per ATO (n=6–12 per time point).
Figure 5.
Figure 5.. T cell Differentiation from CD3δ SCID HSPCs is Blocked at the DP Stage
a-e) T cell differentiation of HD, unedited patient, and edited patient ATOs, n=6–12 from 4 independent experiments. a) Representative flow cytometry profiles depicting T cell differentiation of DN (green), ISP4 (aqua), and DP-E (blue) populations in cells gated on CD3-TCRαβ- cells at weeks 7 and 9. b) Frequency of DN, ISP4, and DP-E cells in CD45+Lin- cells at week 12. Data shown as mean ± SD. Statistical significance calculated by unpaired nonparametric t-test ***p<0.001. Cell counts of c) DN, d) ISP4, and e) DP-E cells per ATO. f-j) CITE-seq analysis of unedited and edited CD3δ SCID patient ATOs at week 8 (n=4). f) WNN_UMAP visualizations of annotated populations in unedited (left) and edited (right) patient ATOs. Expression of lineage defining g) surface proteins and h) RNA across clusters. i) Frequency of developing T cell (DN, ISP4, DP-E, DP-L, SP8RO, and SP8RA) and other immune cell (CD34+, NK, innate, pDC, γδ T cell, B cell) subsets in unedited (left) or edited (right) samples. j) WNN_UMAP visualization of no TRA or TRB (grey), TRB only (orange), and both TRA and TRB (purple) expression.
Figure 6.
Figure 6.. Edited CD3δ SCID ATO-derived T cells Express Features of Maturation without Evidence of Exhaustion
a) Representative flow cytometry profiles depicting maturation markers (CCR7, CD62L, CD27, CD28, CD45RO, and CD45RA) in cells gated on SP8 T cells - CD3+TCRαβ+CD8α+CD8β+, in week 12 ATOs (n=9, from four independent experiments). b) RNA expression of selected genes (y-axis) across clusters in edited patient ATOs by CITE-seq; Cyt., cytokine. c) Gene Set Enrichment Analysis (GSEA) of differentially expressed genes from GOBP (Gene Ontology Biological Process) and GOCC (Gene Ontology Cellular Compartment) between SP8 T and DN cells from edited ATOs. Dot size represents adjusted p-value (padj; two-sided permutation test). NES, normalized enrichment score; PM, plasma membrane. GSEA plots of representative gene sets d) alpha beta T cell differentiation (p=0.035), and e) TCR complex (p=1.74E-8) in SP8 vs DN T cells from edited ATOs. f) Representative flow cytometry profiles of exhaustion markers in SP8 T cells directly from week 15 HD (n=9) and edited patient ATOs (n=9), and compared to PBMCs (n=3); PBMC were stimulated with (orange) and without (purple) anti-CD3/28 beads and IL2 for 24 hours.
Figure 7.
Figure 7.. Base Editing of CD3δ SCID HSPCs Generates Functional T cells with TCR diversity
a) Calcium flux of cells isolated from HD (green), edited patient (blue), and unedited patient (black) ATOs stimulated with anti-CD3 and anti-CD28. b) Quantified area under the calcium flux curve of HD (green), edited patient (blue), and unedited patient (black) ATO cells. c-f) HD (green) and edited patient (blue) ATOs stimulated with and without anti-CD3/CD28 beads and IL2 for 24 hours (n=6). c) Representative flow cytometry histogram profiling and mean fluorescence intensity (MFI) of d) IFNγ, e) TNFα, and f) IL-2 production in mature SP8s (Zombie-CD45+CD8α+CD4−CD45RA+). Production of IFNγ and TNFα with and without stimulation was statistically significant (p<0.01). Production of IL-2 was not statistically significant (p=0.055). g) Activation (upregulation of CD25 and 4–1BB) and h) proliferation (CFSE dilution) of isolated HD and edited patient ATO-derived SP8 T cells after culture with anti-CD3/CD28 bead and IL-2 for 5 days. Data is representative of three independent experiments. i-k) Single-cell TCR sequencing by CITE-seq of unedited and edited patient ATOs harvested at week 8, n=2 for each arm. Data are representative of two independent experiments. i) Number of unique TCR clonotypes. j) Frequency of individual TRAV (top) and TRAJ (bottom) usage. k) Heatmap visualization of individual TRAV and TRAJ segments displayed in genomic order from 5’ distal -> 3’ proximal ends. Statistical significance was calculated by unpaired non-parametric t-test (**p < 0.01).

Comment in

References

    1. Garcillán B, Fuentes P, Marin A. v., Megino RF, Chacon-Arguedas D, Mazariegos MS, Jiménez-Reinoso A, Muñoz-Ruiz M, Laborda RG, Cárdenas PP, et al. (2021). CD3G or CD3D Knockdown in Mature, but Not Immature, T Lymphocytes Similarly Cripples the Human TCRαβ Complex. Front Cell Dev Biol 9. 10.3389/fcell.2021.608490. - DOI - PMC - PubMed
    1. Dadi HK, Simon AJ, and Roifman CM (2003). Effect of CD3 d Deficiency on Maturation of a / b and g / d T-Cell Lineages in Severe Combined Immunodeficiency. - PubMed
    1. Marcus N, Takada H, Law J, Cowan MJ, Gil J, Regueiro JR, Plaza Lopez De Sabando D, Lopez-Granados E, Dalal J, Friedrich W, et al. (2011). Hematopoietic stem cell transplantation for CD3δ deficiency. Journal of Allergy and Clinical Immunology 128, 1050–1057. 10.1016/j.jaci.2011.05.031. - DOI - PMC - PubMed
    1. Mamcarz E, Zhou S, Lockey T, Abdelsamed H, Cross SJ, Kang G, Ma Z, Condori J, Dowdy J, Triplett B, et al. (2019). Lentiviral Gene Therapy Combined with Low-Dose Busulfan in Infants with SCID-X1. New England Journal of Medicine 380, 1525–1534. 10.1056/nejmoa1815408. - DOI - PMC - PubMed
    1. Kohn DB, Booth C, Shaw KL, Xu-Bayford J, Garabedian E, Trevisan V, Carbonaro-Sarracino DA, Soni K, Terrazas D, Snell K, et al. (2021). Autologous Ex Vivo Lentiviral Gene Therapy for Adenosine Deaminase Deficiency. New England Journal of Medicine 384, 2002–2013. 10.1056/nejmoa2027675. - DOI - PMC - PubMed

Publication types