. 2023 Apr 20;83(8):1216-1236.e12.
doi: 10.1016/j.molcel.2023.02.026. Epub 2023 Mar 20.

Stepwise activities of mSWI/SNF family chromatin remodeling complexes direct T cell activation and exhaustion

Affiliations

Stepwise activities of mSWI/SNF family chromatin remodeling complexes direct T cell activation and exhaustion

Elena Battistello et al. Mol Cell. .

Abstract

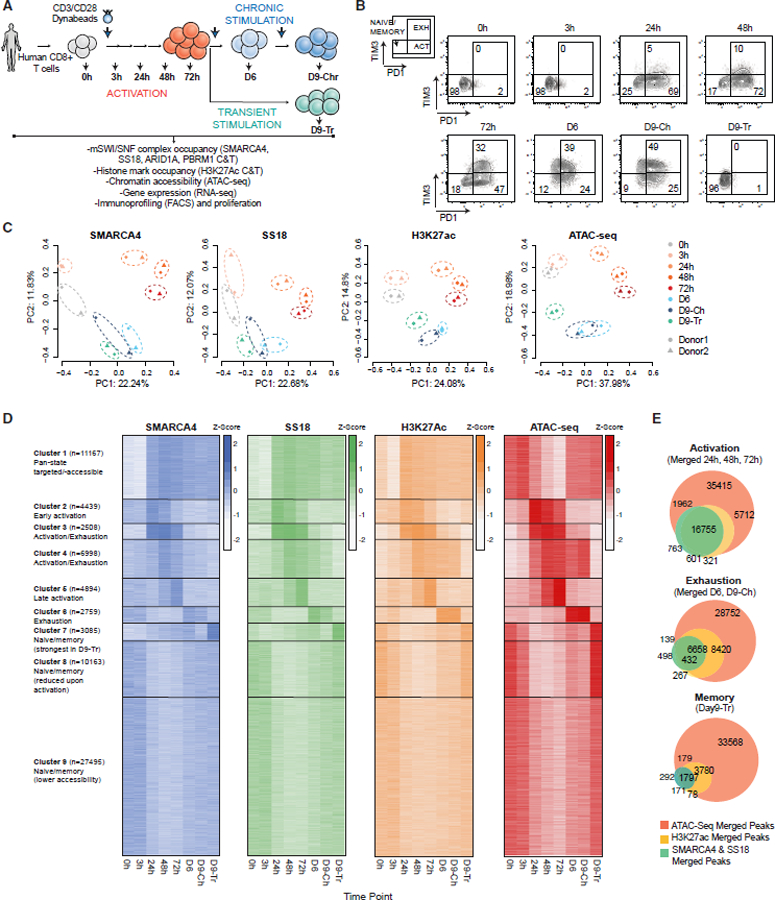
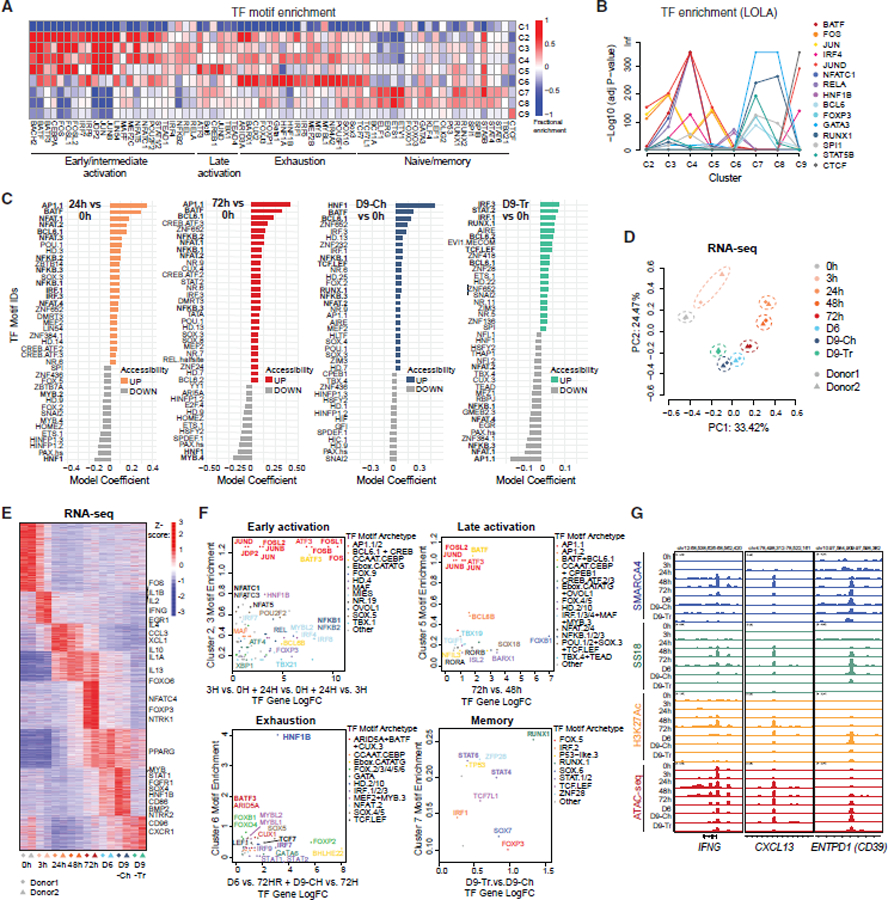
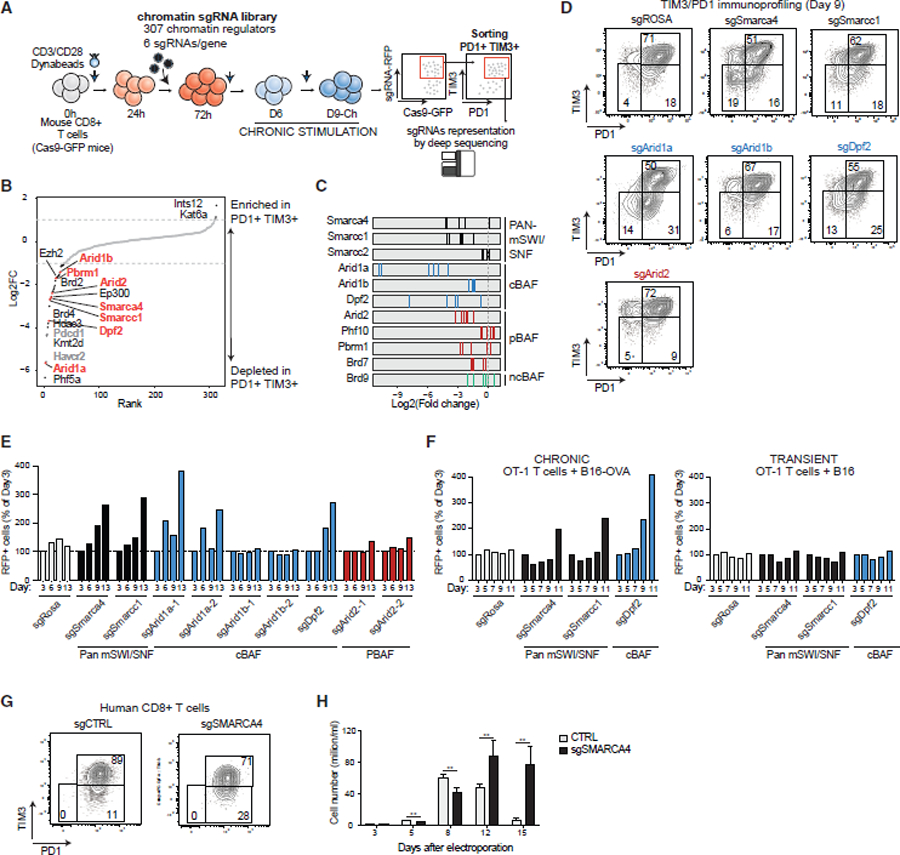
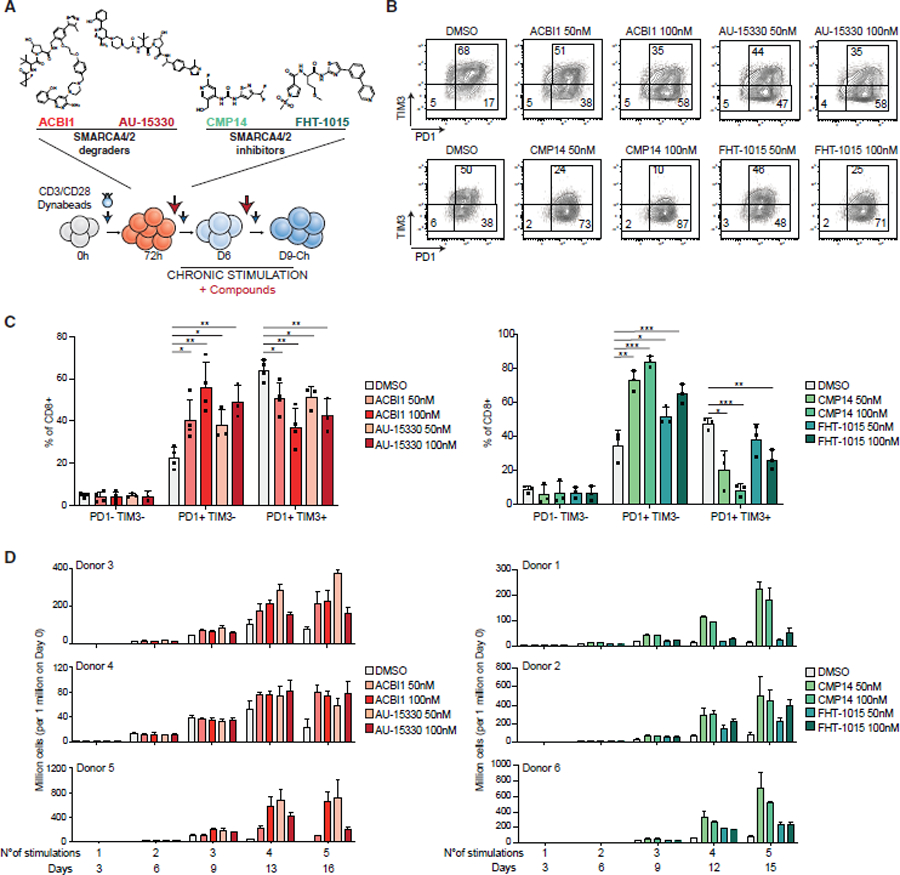
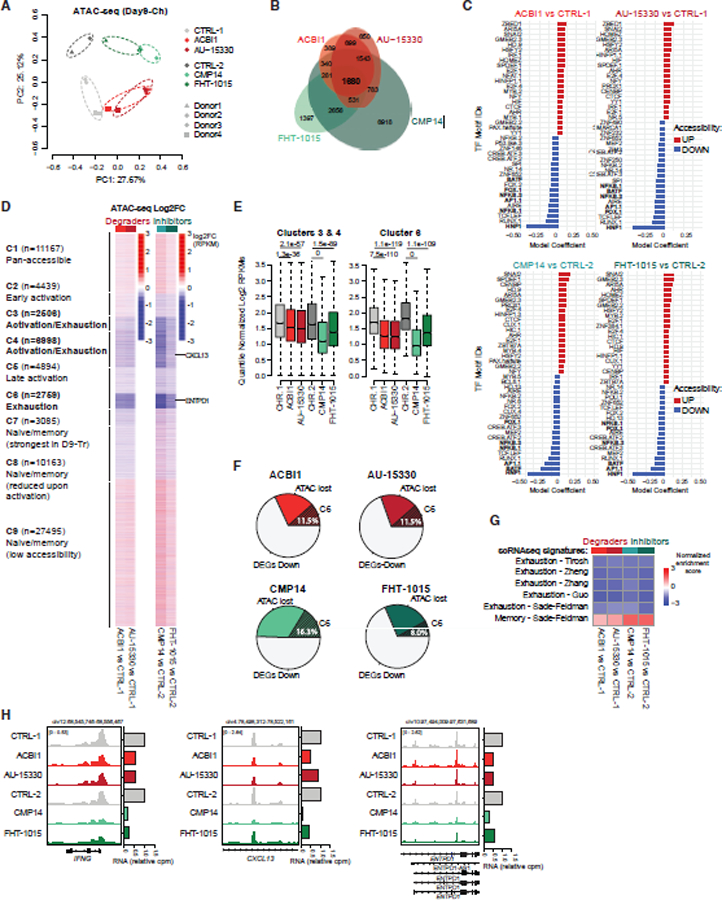
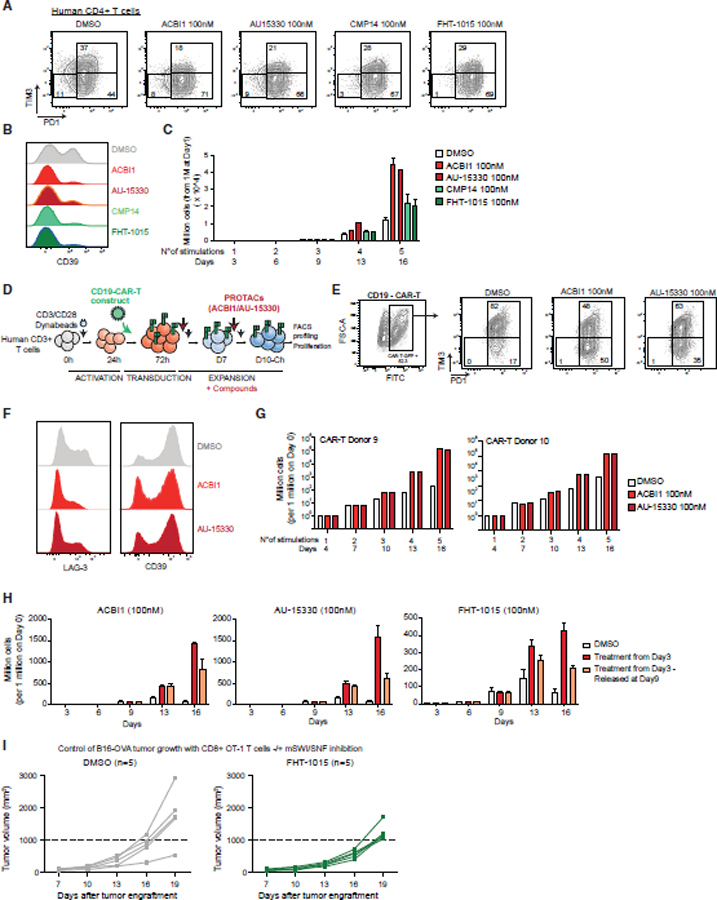
Highly coordinated changes in gene expression underlie T cell activation and exhaustion. However, the mechanisms by which such programs are regulated and how these may be targeted for therapeutic benefit remain poorly understood. Here, we comprehensively profile the genomic occupancy of mSWI/SNF chromatin remodeling complexes throughout acute and chronic T cell stimulation, finding that stepwise changes in localization over transcription factor binding sites direct site-specific chromatin accessibility and gene activation leading to distinct phenotypes. Notably, perturbation of mSWI/SNF complexes using genetic and clinically relevant chemical strategies enhances the persistence of T cells with attenuated exhaustion hallmarks and increased memory features in vitro and in vivo. Finally, pharmacologic mSWI/SNF inhibition improves CAR-T expansion and results in improved anti-tumor control in vivo. These findings reveal the central role of mSWI/SNF complexes in the coordination of T cell activation and exhaustion and nominate small-molecule-based strategies for the improvement of current immunotherapy protocols.

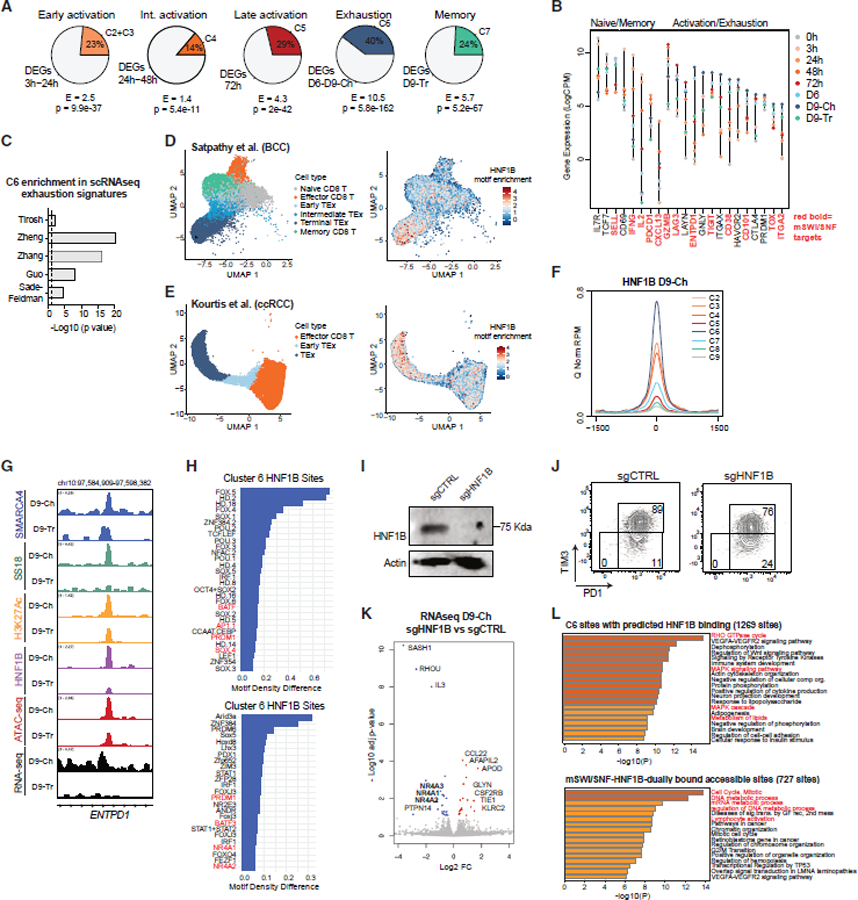
Keywords: ATP-dependent chromatin remodeling; CRISPR screening; CUT&Tag; HNF1B; PROTACs; SWI/SNF; T cells; immunotherapy; small-molecule inhibitors; transcription factors.


Conflict of interest statement

Declaration of interests C.K. is the scientific founder, scientific advisor to the board of directors, scientific advisory board member, shareholder, and consultant for Foghorn Therapeutics, Inc. (Cambridge, MA). C.K. is also a member of the scientific advisory board and is a shareholder of Nested Therapeutics and Nereid Therapeutics, serves on the scientific advisory board for Fibrogen, Inc. and on the Molecular Cell editorial board, and is a consultant for Cell Signaling Technologies and Google Ventures. I.A. is a scientific consultant for Foresite Labs and receives research funding from AstraZeneca Inc. F.P. is an inventor on patents related to adoptive cell therapies, held by MSKCC (some licensed to Takeda), serves as a consultant for AstraZeneca, and receives research support from Lonza and NGMBio. A.T. is a scientific advisor to Intelligencia AI.

Figures

Figure 1.
Figure 1.. Stepwise changes in mSWI/SNF complex targeting and chromatin accessibility during CD8+ T cell activation and exhaustion
(A) Schematic for CD3/CD28 bead-based stimulation of human CD8+ T cells. (B) FACS-based profiling of PD1 and TIM3 markers indicating naive/memory, activated, and exhausted populations. (C) PCA for mSWI/SNF subunit and H3K27Ac CUT&Tag and ATAC-seq profiles across the time course (donors 1 and 2, see KRT for donor information). (D) K-means clustering for SMARCA4, SS18, H3K37Ac, and ATAC-seq performed over merged SMARCA4, SS18, H3K27ac, and ATAC-seq peaks; heatmap intensity depicts quantile-normalized log2-transformed RPKM values transformed into Z scores. (E) Venn diagrams showing the overlap between SMARCA4/SS18 merged, H3K27Ac CUT&Tag peaks with ATAC-seq peaks across time points shown. See also Figures S1 and S2.
Figure 2.
Figure 2.. tate-specific transcription factor motif enrichment of mSWI/SNF complex occupancy and activity during T cell activation and exhaustion
(A) Fractional motif enrichment in clusters C1–C9 (relative to all sites). (B) LOLA enrichment of 15 selected TFs across C2–C9. (C) Differential motif accessibility between time points indicated (top 40 coefficients of logistic regression models). (D) PCA performed on RNA-seq datasets from T cells isolated from 2 independent donors at each time point. (E) Z scored heatmap reflecting the top 25% most variable genes across the time course, partitioned into 8 groups by K-means clustering with selected genes labeled. (F) Plots representing state (cluster(s)-specific) TF fractional motif enrichment (y axis) and gene expression (x axis). (G) Representative SMARCA4, SS18, H3K27ac C&T, and ATAC-seq tracks over the IFNG, CXCL13, and ENTPD1 loci. See also Figure S3.
Figure 3.
Figure 3.. Exhaustion-associated gene expression and chromatin targeting is partially mediated by the HNF1B transcription factor
(A) Pie charts representing fractions of the top 10% differentially expressed genes near sites within clusters indicated. (B) Lollipop plots representing the gene expression (LogCPM) of marker genes for the different states throughout the time course with mSWI/SNF-bound genes indicated. (C) Enrichment of C6-associated genes across exhaustion signatures from published scRNA-seq datasets. (D) UMAP projections of 12,643 CD8+ T cells from basal cell carcinoma (BCC) tumor biopsies, clustered by phenotype (left) or colored by HNF1B motif enrichment (right). (E) UMAP projection of 13,613 CD8+ T cells from clear cell renal cell carcinoma (ccRCC) tumor biopsies, clustered by phenotype (left) or colored by HNF1B motif enrichment (right). (F) Enrichment of HNF1B (CUT&Tag performed on Day9-Ch T cells) across clusters. (G) Representative tracks over the ENTPD1 locus. (H) Motif enrichment over HNF1B target sites in (top) cluster 6 HNF1B target sites and (bottom) all HNF1B target sites. (I) Western blot for HNF1B and beta-actin in Day9-Ch sgCTRL and sgHNF1B T cells (donor 7). (J) PD1 and TIM3 immunoprofiling on sgCTRL and sgHNF1B T cells at Day9-Ch. (G) Volcano plot depicting differential gene expression (RNA-seq) in sgCTRL and sgHNF1B T cells. (H) Metascape analysis performed over (top) C6 sites with predicted HNF1B binding (>2 motifs) and (bottom) C6 sites with CUT&Tag HNF1B binding, mSWI/SNF occupancy and accessibility. See also Figure S3.
Figure 4.
Figure 4.. Chromatin-focused CRISPR-Cas9 screens identify cBAF components as regulators of T cell exhaustion
(A) Schematic for CD8+ PD1+/TIM3+ T cell screening using a custom sgRNA library of chromatin regulators. (B) Rank plot depicting log2FC scores (average of n = 6 guides) targeting chromatin regulator genes and negative/positive controls. Depleted genes are highlighted in black; positive controls are highlighted in gray; mSWI/SNF complex genes are highlighted in orange. (C) Log2FC values for n = 6 independent guides in PD1+TIM3+ cells. (D) FACS plots depicting PD1+/TIM3+ T cell populations in control and mSWI/SNF subunit KO conditions. (E) Bar graph depicting RFP+ cells (% cells of day 3) for control, pan-mSWI/SNF, cBAF, and PBAF genes. (F) Bar graph depicting RFP+ cells (% cells of day 3) for chronic (+B16+OVA) and transient (+B16) stimulation of OT-1 T cells in each sgRNA condition. (G) FACS plots depicting PD1+/TIM3+ T cell populations in control and sgSRMARCA4 KO conditions in human CD8+ T cells. Donor 7 was used for this experiment, which was conducted together with the experiment in Figure 3J, thus the same control was used. (H) Bar graph depicting cell proliferation of human sgCTRL or sgSMARCA4 CD8+ T cells. Error bars represent mean ± SD of 3 technical replicates. **p < 0.01. See also Figure S4.
Figure 5.
Figure 5.. Pharmacologic disruption of mSWI/SNF complexes attenuates human T cell exhaustion
(A) Schematic for inhibitor and degrader experiments with compounds added at day 3 and refreshed (with stimulation) every 3 days. (B) FACS plots depicting PD1/TIM3 populations in CD8+ T cells at day 9 treated with 50 nM and 100 nM of SMARCA4/2 degraders (donor 3) and inhibitors (donor 1). (C) Bar graph depicting % of CD8+ T cells in PD1/TIM3, PD1+TIM3, and PD1+TIM3+ populations in DMSO, ACBI1, and AU-15330 (Left) or DMSO, CMP14 and FHT-1015 (right) conditions. Error bars represent mean ± SD of 3 or 4 independent CD8+ T cell donors. Statistical analysis was performed using an unpaired t test. (D) Bar graphs depicting cell number upon treatment with ACBI1/AU-15330 (left, donors 3, 4, and 5) or CMP14/FHT-1015 (right, donors 1, 2, and 6). See KRT for donor information. Error bars represent mean ± SD of 3 technical replicates per donor. *p < 0.05, **p < 0.01, ***p < 0.001, and ****p < 0.0001. See also Figures S5 and S6.
Figure 6.
Figure 6.. mSWI/SNF pharmacological disruption alters chromatin accessibility and TFs recruitment at key T cell activation and exhaustion sites
(A) PCA of ATAC-seq profiles of control (CTRL) and ACBI1, AU-15330, CMP14, or FHT-1015-treated human CD8+ T cells (100 nM), at day 9. CTRL-1 and CTRL-2 are the controls for the ACBI1/AU-15330 (donors 3 and 4) and CMP14/FHT-1015 (donors 1 and 2) experiments, respectively. (B) Venn diagram showing the overlap in sites with decreased accessibility (logFC < −1) upon treatment with ACBI1, AU-15330, CMP14, or FHT-1015 (100 nM). (C) Top 40 coefficients of logistic regression models fitting motif counts across all sites to changes in accessibility for indicated comparisons. (D) Heatmap showing the log2 fold-change of accessibility upon ACBI1, AU-15330, CMP14, or FHT-1015 treatment compared with control in the 9 clusters identified in Figure 1. (E) Quantification of chromatin accessibility (quantile-normalized log2 RPKM) at sites within clusters 3 and 4 and cluster 6. CTRL-1 and CTRL-2 are the controls for the ACBI1/AU-15330 and CMP14/FHT-1015 experiments, respectively. P values were computed using standard t tests. (F) Pie charts representing percentages of downregulated genes after treatment near cluster 6 (C6) sites with strong decreases in accessibility (log2FC < −1). (G) Gene set enrichment analysis (GSEA) analysis of exhaustion and memory signatures derived from scRNA-seq datasets in the selected comparisons. (H) Representative SMARCA4, SS18, H3K27ac C&T, and ATAC-seq tracks over the IFNG, CXCL13, and ENTPD1 loci. See also Figure S7.
Figure 7.
Figure 7.. mSWI/SNF targeting improves T cell-based cancer immunotherapy approaches
(A) FACS plots depicting PD1/TIM3 populations in DMSO, ACBI1, AU-15330, CMP14, and FHT-1015 conditions (100 nM), at day 9, for one human CD4+ T cell donor (donor 8). (B) FACS plot depicting the profiling of CD39 in human CD4+ T cells treated with DMSO, ACBI1, AU-15330, CMP14, or FHT-1015 (100 nM), at day 9. (C) Bar graph depicting human CD4+ T cell number upon treatment with DMSO, ACBI1, AU-15330, CMP14, or FHT-1015 (100 nM). Error bars represent the mean ± SD of 3 technical replicates of one donor. (D) Schematic for CD19-CAR-T cell generation, stimulation, and treatments. (E) FACS plots depicting CD19-CAR-T-GFP cells identification and PD1/TIM3 populations, in cells treated with ACBI1 or AU-15330 (donors 9 and 10). (F) FACS histograms of LAG-3 and CD39 expression in CAR-T cells treated with DMSO, ACBI1, or AU-15330. (G) Bar graphs depicting CAR-T cell number upon treatment with DMSO, ACBI1, or AU-15330 (100 nM). Error bars represent the mean for each donor. (H) Bar graphs depicting cell number upon treatment with ACBI1, AU-15330, or FHT-1015 (all 100 nM) at day 3 onward or at day 3 with treatment washout at day 9. Error bars represent mean ± SD of 3 technical replicates of one donor. (I) In vivo B16 melanoma tumor growth curves in mice injected with DMSO or FHT-1015-treated CD8+ OT-1 T cells. Two-way ANOVA generated p value for comparison between the two groups’ means at day 19: p < 0.05. See also Figure S7.

References

    1. Kaech SM, and Cui W (2012). Transcriptional control of effector and memory CD8+ T cell differentiation. Nat. Rev. Immunol 12, 749–761. 10.1038/nri3307. - DOI - PMC - PubMed
    1. Schietinger A, Philip M, Krisnawan VE, Chiu EY, Delrow JJ, Basom RS, Lauer P, Brockstedt DG, Knoblaugh SE, Hämmerling GJ, et al. (2016). Tumor-specific T cell dysfunction is a dynamic antigen-driven differentiation program initiated early during tumorigenesis. Immunity 45, 389–401. 10.1016/j.immuni.2016.07.011. - DOI - PMC - PubMed
    1. Seo W, Jerin C, and Nishikawa H (2021). Transcriptional regulatory network for the establishment of CD8+ T cell exhaustion. Exp. Mol. Med 53, 202–209. 10.1038/s12276-021-00568-0. - DOI - PMC - PubMed
    1. Zhang N, and Bevan MJ (2011). CD8+ T cells: foot soldiers of the immune system. Immunity 35, 161–168. 10.1016/j.immuni.2011.07.010. - DOI - PMC - PubMed
    1. Chang C-H, Qiu J, O’Sullivan D, Buck MD, Noguchi T, Curtis JD, Chen Q, Gindin M, Gubin MM, van der Windt GJW, et al. (2015). Metabolic competition in the tumor microenvironment is a driver of cancer progression. Cell 162, 1229–1241. 10.1016/j.cell.2015.08.016. - DOI - PMC - PubMed

Publication types

MeSH terms