. 2023 May:130 Suppl 1:S34-S42.
doi: 10.1016/j.ijid.2023.03.021. Epub 2023 Mar 21.

Characterization of the immune impairment of patients with tuberculosis and COVID-19 coinfection

Affiliations

Characterization of the immune impairment of patients with tuberculosis and COVID-19 coinfection

Saeid Najafi-Fard et al. Int J Infect Dis. 2023 May.

Abstract

Objectives: To characterize the plasma immune profile of patients with tuberculosis (TB)-COVID-19 compared with COVID-19, TB, or healthy controls and to evaluate in vitro the specific responses to SARS-CoV-2 and Mycobacterium tuberculosis (Mtb)-antigens.

Methods: We enrolled 119 subjects: 14 TB-COVID-19, 47 COVID-19, 38 TB, and 20 controls. The plasmatic levels of 27 immune factors were measured at baseline using a multiplex assay. The specific response to SARS-CoV-2 and Mtb antigens was evaluated using a home-made whole blood platform and QuantiFERON-Plus tubes, respectively.

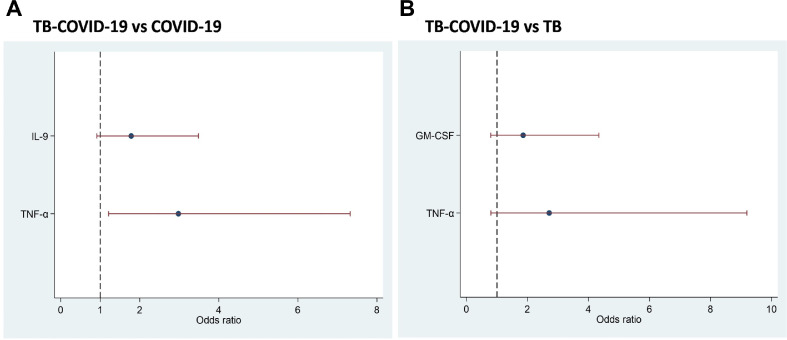
Results: We found an immune signature (tumor necrosis factor [TNF]-α, macrophage inflammatory protein-1β, and interleukin [IL]-9) associated with TB-COVID-19 coinfection compared with COVID-19 (P <0.05), and TNF-α showed the highest discriminant power. We also found another signature (TNF-α, IL-1β, IL-17A, IL-5, fibroblast growth factor-basic, and granulocyte macrophage colony-stimulating factor [GM-CSF]) in coinfected patients compared with patients with TB (P <0.05), and among them, TNF-α and granulocyte macrophage colony-stimulating factor showed a non-negligible discriminating ability. Moreover, coinfected patients showed a significantly reduced SARS-CoV-2-specific response compared with COVID-19 for several pro-inflammatory cytokines/chemokines, anti-inflammatory cytokines, and growth factors (P ≤0.05). Furthermore, coinfection negatively affected the Mtb-specific response (P ≤0.05).

Conclusion: We found immune signatures associated with TB-COVID-19 coinfection and observed a major impairment of SARS-CoV-2-specific and, to a lesser extent, the Mtb-specific immune responses. These findings further advance our knowledge of the immunopathology of TB-COVID-19 coinfection.

Keywords: COVID-19; Coinfection; Immune response; M. tuberculosis; SARS-CoV-2; Tuberculosis.


Conflict of interest statement

Declaration of competing interest AS is a consultant for Gritstone, Flow Pharma, Merck, Epitogenesis, Gilead, and Avalia. DG has been a member of the advisory board of Biomerieux and Eli-Lilly and received fees for educational training or consultancy by Biogen, Cellgene, Diasorin, Janssen, QIAGEN, and Quidel. The remaining authors have no competing interests to declare.

Figures

Figure 1
Figure 1
The baseline (unstimulated) plasma level of immune factors found significantly elevated in patients with TB-COVID-19 coinfection compared with either COVID-19 or TB. (a) Significantly elevated baseline levels of TNF-α, MIP-1β, and IL-9 in TB-COVID-19 coinfected compared with patients with COVID-19. (b) Significantly elevated baseline levels of TNF-α, IL-1β, IL-17A, IL-5, FGF-basic, and GM-CSF in TB-COVID-19 coinfected compared with patients with COVID-19. The histograms represent median values of the immune factors expressed in pg/mL. Mann-Whitney test was applied for statistical analysis and a P-value ≤ 0.05 was considered significant. Abbreviations: FGF, fibroblast growth factor; GM-CSF, granulocyte monocyte-colony-stimulating factor; IL, interleukin; MIP, macrophage inflammatory protein; TB, tuberculosis; TNF, tumor necrosis factor.
Figure 2
Figure 2
Immune signature of TB-COVID-19 vs COVID-19 or vs TB. OR and their 95% CI after stepwise regression models on log2(x+1) transformed immune factors are reported. (a) Immune factors in the final model for TB-COVID-19 vs COVID-19: IL-9 (OR: 1.78, 95% CI: 0.91-3.48, P = 0.091) and TNF-α (OR: 2.98, 95% CI: 1.21-7.32, P = 0.018). (b) Immune factors in the final model for TB-COVID-19 vs TB: GM-CSF (OR: 1.86, 95% CI: 0.80-4.34, P = 0.153) and TNF-α (OR: 2.71, 95% CI: 0.80-9.12, P = 0.109). Abbreviations: CI, confidence interval; GM-CSF, granulocyte monocyte-colony-stimulating factor; IL, interleukin; OR, odds ratios; TB, tuberculosis; TNF, tumor necrosis factor.
Figure 3
Figure 3
Immune impairment of SARS-CoV-2 specific immune response in patients with TB-COVID-19 coinfection compared with patients with COVID-19. Significantly reduced SARS-CoV-2 specific immune response in patients with TB-COVID-19 coinfection compared with patients with COVID-19 for pro-inflammatory cytokine (IFN-γ), chemokines (IP-10, MCP-1, MIP-1α, MIP-1β), anti-inflammatory cytokines (IL-1 receptor antagonist and IL-10), growth factors (FGF, G-CSF) and an almost significant reduced response for anti-inflammatory cytokines (IL-4 and IL-13). Histograms represent median values of the immune factors expressed in pg/ml. Mann-Whitney test was applied for statistical analysis and a P-value ≤ 0.05 was considered significant. Abbreviations: FGF, fibroblast growth factor; G-CSF: granulocyte colony-stimulating factor; IFN, interferon; IL, interleukin; IP, IFN-γ inducible protein; MCP: monocyte chemoattractant protein; MIP, macrophage inflammatory protein; TB, tuberculosis; TNF, tumor necrosis factor.
Figure 4
Figure 4
Specific response to QFT-Plus antigens (TB1 and TB2) in patients with TB compared with patients with TB-COVID-19 coinfection. (a) Significantly reduced specific response to TB1 in TB-COVID-19 coinfected compared with patients with TB for IFN-γ, IP-10, IL-9, and IL-15. (b) Significantly reduced specific response to TB2 in TB-COVID-19 coinfected compared with patients with TB for IFN-γ, IP-10, IL-1β, and MIP-1β. Histograms represent median values of the immune factors expressed in pg/ml. Mann-Whitney test was applied for statistical analysis and a P-value ≤ 0.05 was considered significant. Abbreviations: IFN, interferon; IL, interleukin; IP, IFN-γ inducible protein; MIP, macrophage inflammatory protein; QFT, Quantiferon; TB, tuberculosis.

References

    1. World Health Organization. Global Tuberculosis Report 2022, https://www.who.int/teams/global-tuberculosis-programme/tb-reports/globa...; 2022 [accessed 27 January 2023].
    1. TB/COVID-19 Global Study Group Tuberculosis and COVID-19 co-infection: description of the global cohort. Eur Respir J. 2022;59 doi: 10.1183/13993003.02538-2021. - DOI - PMC - PubMed
    1. World Health Organization . World Health Organization; Geneva: 2020. Clinical management of COVID-19: interim guidance, 27 May 2020.
    1. Aiello A, Grossi A, Meschi S, Meledandri M, Vanini V, Petrone L, et al. Coordinated innate and T-cell immune responses in mild COVID-19 patients from household contacts of COVID-19 cases during the first pandemic wave. Front Immunol. 2022;13 doi: 10.3389/fimmu.2022.920227. - DOI - PMC - PubMed
    1. Del Valle DM, Kim-Schulze S, Huang H-H, Beckmann ND, Nirenberg S, Wang B, et al. An inflammatory cytokine signature predicts COVID-19 severity and survival. Nat Med. 2020;26:1636–1643. doi: 10.1038/s41591-020-1051-9. - DOI - PMC - PubMed

Substances