. 2023 Mar 21;14(1):1567.
doi: 10.1038/s41467-023-37004-y.

Pan-genome inversion index reveals evolutionary insights into the subpopulation structure of Asian rice

Affiliations

Pan-genome inversion index reveals evolutionary insights into the subpopulation structure of Asian rice

Yong Zhou et al. Nat Commun. .

Abstract

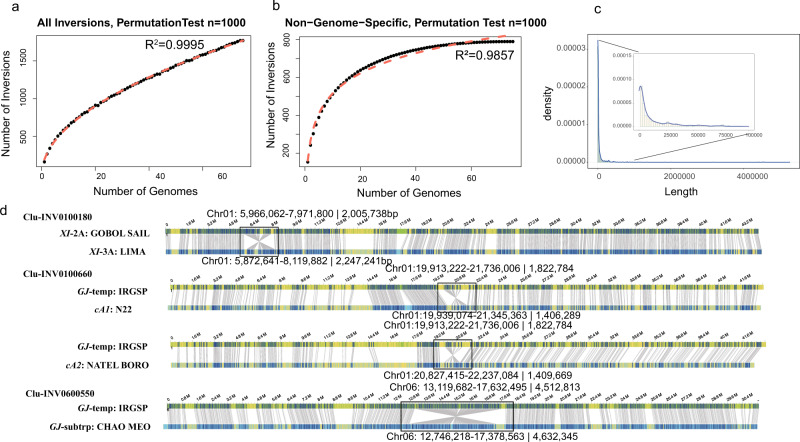
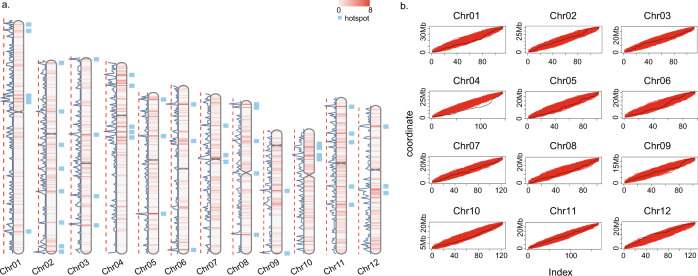
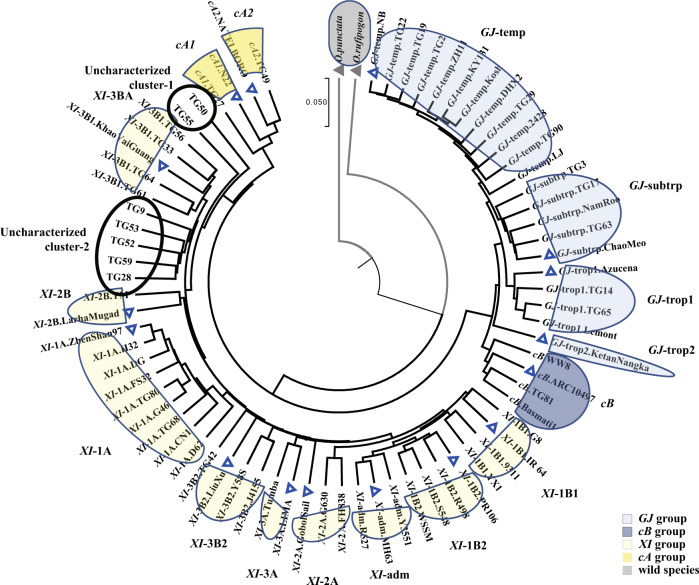
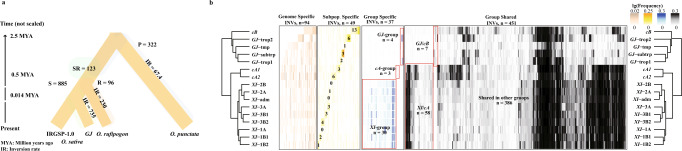
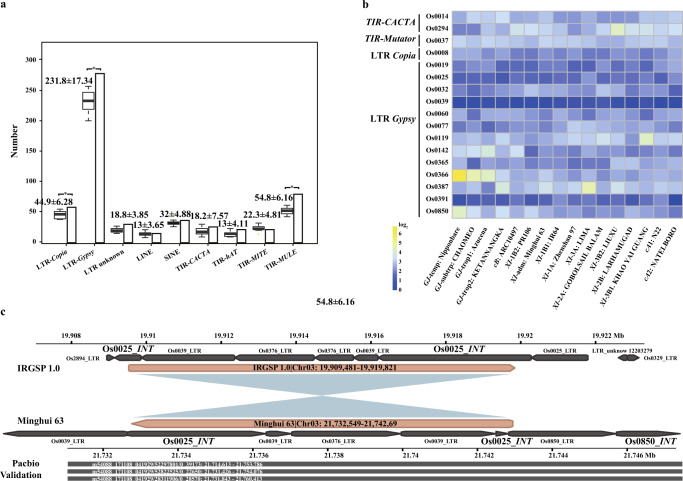
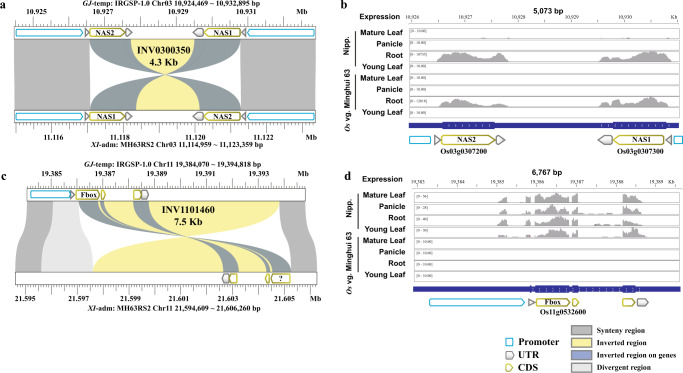
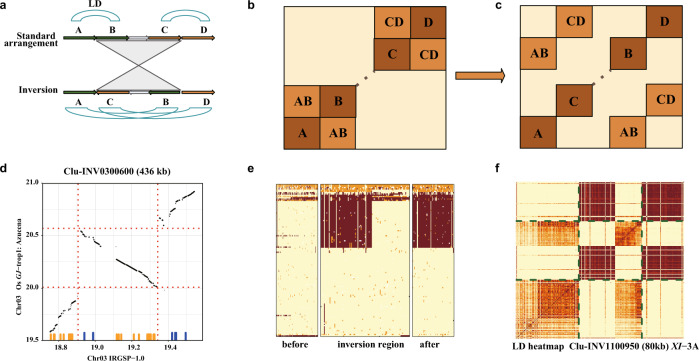
Understanding and exploiting genetic diversity is a key factor for the productive and stable production of rice. Here, we utilize 73 high-quality genomes that encompass the subpopulation structure of Asian rice (Oryza sativa), plus the genomes of two wild relatives (O. rufipogon and O. punctata), to build a pan-genome inversion index of 1769 non-redundant inversions that span an average of ~29% of the O. sativa cv. Nipponbare reference genome sequence. Using this index, we estimate an inversion rate of ~700 inversions per million years in Asian rice, which is 16 to 50 times higher than previously estimated for plants. Detailed analyses of these inversions show evidence of their effects on gene expression, recombination rate, and linkage disequilibrium. Our study uncovers the prevalence and scale of large inversions (≥100 bp) across the pan-genome of Asian rice and hints at their largely unexplored role in functional biology and crop performance.


Conflict of interest statement

The authors declare no competing interests.

Figures

Fig. 1
Fig. 1. Rice inversion index summary.
a, b Resampling permutation test to identify the relationship between the number of genomes and all inversions and shared (non-genome specific) inversions, respectively; c Density of inversion lengths; d Bionano validation of inversions larger than 1 Mb, i.e., Clu-INV0100180, Clu-INV0100660, and Clu-INV0600550. In each panel, the top line shows the optical map used as a reference, the bottom line shows the genome assembly of the variety with the inversion. Gray lines connect restriction sites that are aligned (blue regions), while yellow segments show unaligned regions. Black boxes highlight the position each inversion. Source data are provided as a Source Data file.
Fig. 2
Fig. 2. Genome-wide inversion distribution.
a Chromosome distribution of the pan-genome inversion index, and inversion hotspots. Chromosome heatmaps in the middle along the chromosome represent the density of inversions. The line on the left of each chromosome represents the number of inversions per 200 Kb window. The red dotted line cut off is the top 2% number of inversions in per 200 Kb window. The blue boxes on the right of each chromosome represents the inversion hotspot regions. b The Kolmogorov–Smirnov (KS) test for inversion uniformity distribution across the 12 rice chromosomes. The black line is actual inversion distribution, and the red line is the 10,000th uniformly distributed simulation. Source data are provided as a Source Data file.
Fig. 3
Fig. 3. Phylogenetic tree of 75 high-quality rice genomes using the pan-genome inversion index.
Phylogenetic relationships of the 75 high-quality genomes used to create the pan-genome inversion index, inferred using the UPGMA method (unweighted pair group method with arithmetic mean). The tree is drawn to scale, with branch lengths in the same units as those of the evolutionary distances used to infer the phylogenetic tree. Evolutionary analyses were conducted in MEGA7. Two wild relatives (O. rufipogon and O. punctata) were heighted with light gray arc. Subpopulations from GJ, cB, XI, and cA groups were highlighted with light blue, dark blue, light yellow and dark yellow, respectively. Two uncharacterized XI subpopulations are shown with a black circle. The distance matrix of SNP and INV polymorphisms was significantly correlated (Mantel test, simulation with n = 999,999, r = 0.79, p = 1e−6). Source data are provided as a Source Data file.
Fig. 4
Fig. 4. Species-specific, population-specific and shared inversion analysis of the pan-genome inversion index of rice.
a A model showing species specific inversions and inversion rates in Asian rice and two wild relatives (O. punctata and O. rufipogon). b Frequency of genome-specific, subpopulation specific, group specific and group shared inversions across the population structure of Asian rice (n = 631). Source data are provided as a Source Data file.
Fig. 5
Fig. 5. Transposable element analysis of the pan-genome inversions index of rice.
a The amount (y-axis) of different transposable element (TE) families (x-axis) show that three TE families (i.e., LTR-RT Ty1-copia, Ty3-gypsy and DNA-TE MULE) were observed in higher frequencies at the breakpoints of the pan-genome inversion index than the resampled control tests. Box- and bar-plots show the frequencies of TEs observed at the breakpoints of random resampled regions (n = 10 biologically independent resamples) and the pan-genome inversion index, respectively. Each boxplot presents the minimum, first quartile, median, third quartile, and maximum value, and along with mean ± SD (Standard Deviation) are shown. b Enrichment/depletion of 17 TEs present at the inversion breakpoints with more than 10 copies. c Details of Ty3-gypsy Os0025 presence at inversion breakpoints, with support from PacBio long reads. Os0025_LTR (long-terminal repeat), and Os0025_INT (integrase). Source data are provided as a Source Data file.
Fig. 6
Fig. 6. Transcript abundance of genes located at inversion breakpoints.
a Two copies of the OsNAS gene lie at the ends of an inversion in the MH63 (XI-adm) genome. This inversion disrupted the 5’ UTR regions of two OsNAS genes (NAS1 and NAS2); b OsNAS transcript abundance in root tissue; c The coding sequence (CDS) of a Fbox gene was disrupted by an inversion in the MH63 (XI-adm) genome; d Fbox transcript abundance was suppressed in all tissues tested in the MH63 (XI-adm) genome.
Fig. 7
Fig. 7. Population linkage disequilibrium analysis of large inversions.
A schematic diagram of linkage disequilibrium (LD) block disruption arising from the presence of an inversion, as shown in A and B. a Cartoon view of an inversion with breakpoints disrupting two LD blocks; b Expected features of the corresponding LD heat map; c Example of SNP blocks in high LD that are disrupted by an inversion; d The panel shows alignments, with the inversion marked by dotted lines. Small vertical lines above the horizontal axis mark the location of SNPs constituting a disrupted LD block. Orange and blue colors delineate two LD blocks that are contiguous in the of GJ-trop1 population, but appear as split when aligned to the IRGSP RefSeq (GJ-temp). Disruption of Azucena (GJ-trop1) haplotype blocks along the IRGSP RefSeq in the region of INV030410, as shown in e and f; e Genotype heat map of the GJ-trop1 subpopulation (samples in rows, SNPs in columns; light yellow: reference call, orange: heterozygous, brown: homozygous variant); f LD heat map of the same subpopulation. Dotted lines show the inversion region. Darker colors show larger r2. Note that the scaling of X-axis in the genotype heat map is not uniform, allotting half of X-axis space to the inverted region. Source data are provided as a Source Data file.

References

    1. Hossain M, Fischer K. Rice research for food security and sustainable agricultural development in Asia: achievements and future challenges. GeoJournal. 1995;35:286–298. doi: 10.1007/BF00989136. - DOI
    1. Wing RA, Purugganan MD, Zhang Q. The rice genome revolution: from an ancient grain to Green Super Rice. Nat. Rev. Genet. 2018;19:505–517. doi: 10.1038/s41576-018-0024-z. - DOI - PubMed
    1. Vollset SE, et al. Fertility, mortality, migration, and population scenarios for 195 countries and territories from 2017 to 2100: a forecasting analysis for the Global Burden of Disease Study. Lancet. 2020;396:1285–1306. doi: 10.1016/S0140-6736(20)30677-2. - DOI - PMC - PubMed
    1. Sturtevant AH. A case of rearrangement of genes in Drosophila. Proc. Natl Acad. Sci. USA. 1921;7:235. doi: 10.1073/pnas.7.8.235. - DOI - PMC - PubMed
    1. Volkert FC, Broach JR. Site-specific recombination promotes plasmid amplification in yeast. Cell. 1986;46:541–550. doi: 10.1016/0092-8674(86)90879-2. - DOI - PubMed

Publication types