. 2023 Mar 21;14(1):1570.
doi: 10.1038/s41467-023-37126-3.

Benchmarking integration of single-cell differential expression

Affiliations

Benchmarking integration of single-cell differential expression

Hai C T Nguyen et al. Nat Commun. .

Abstract

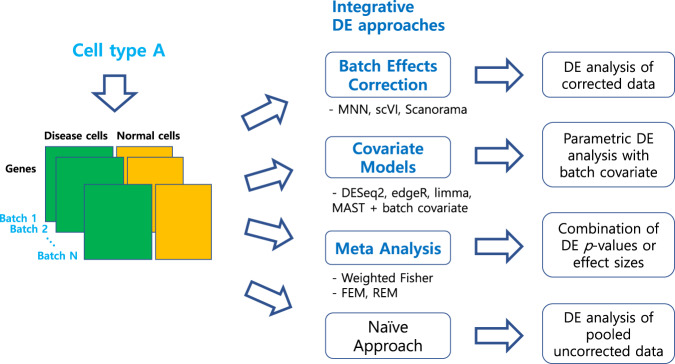
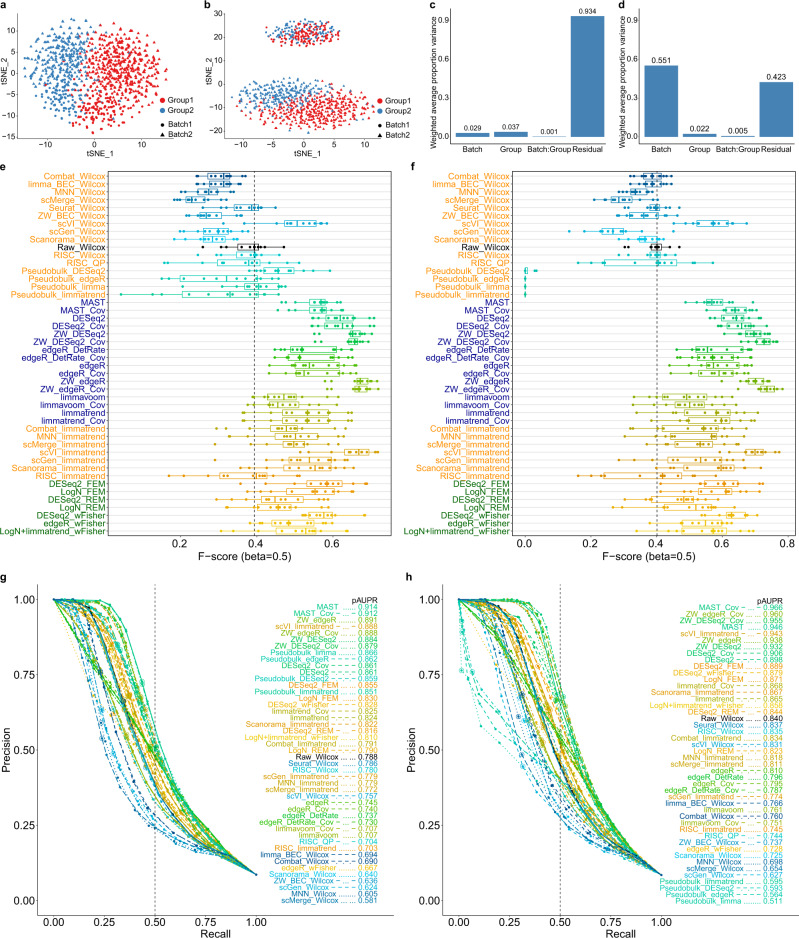
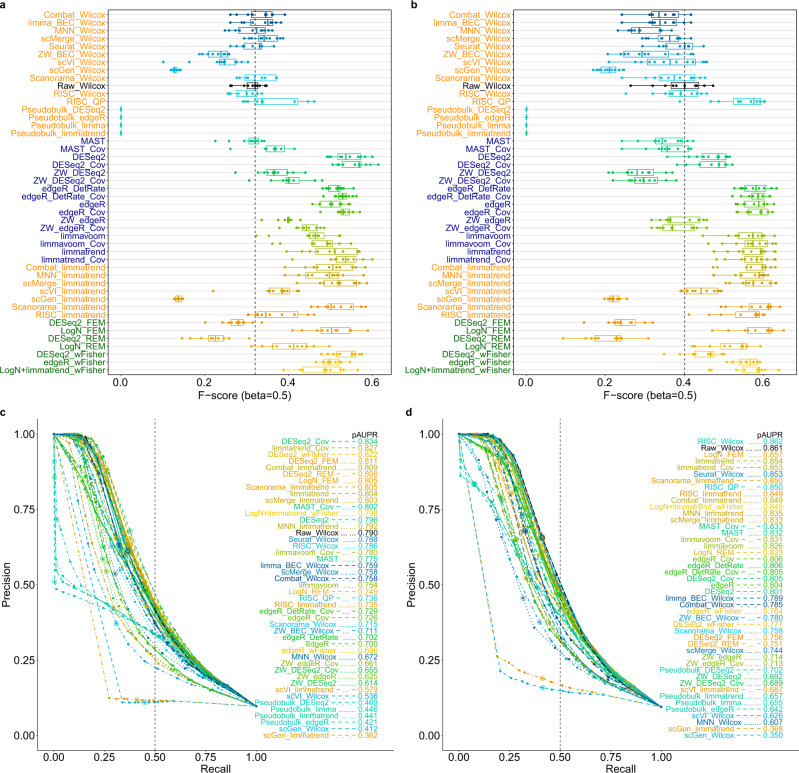
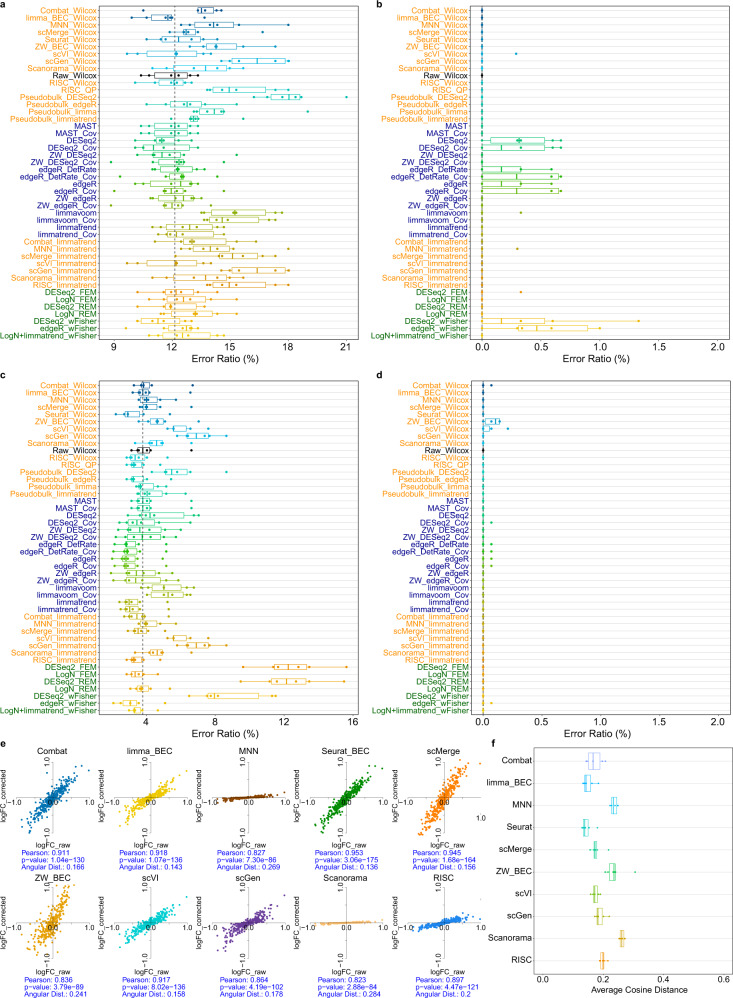
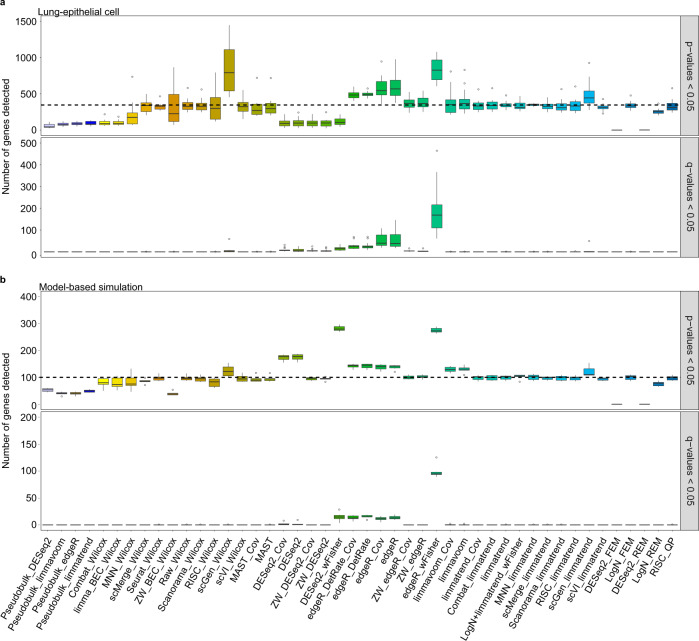
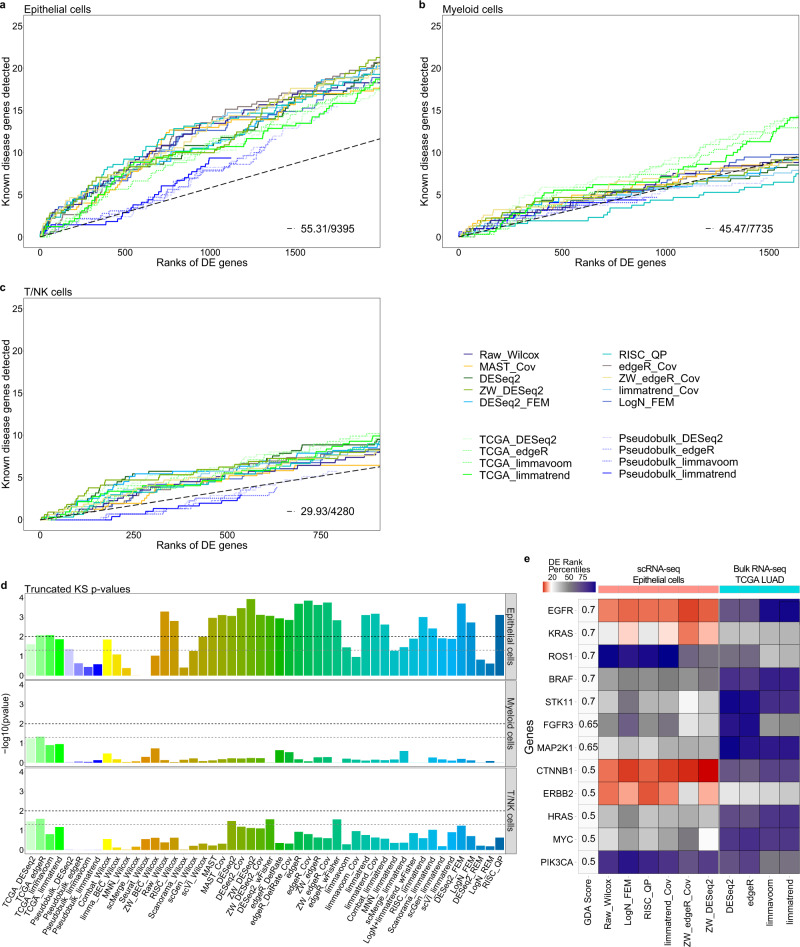
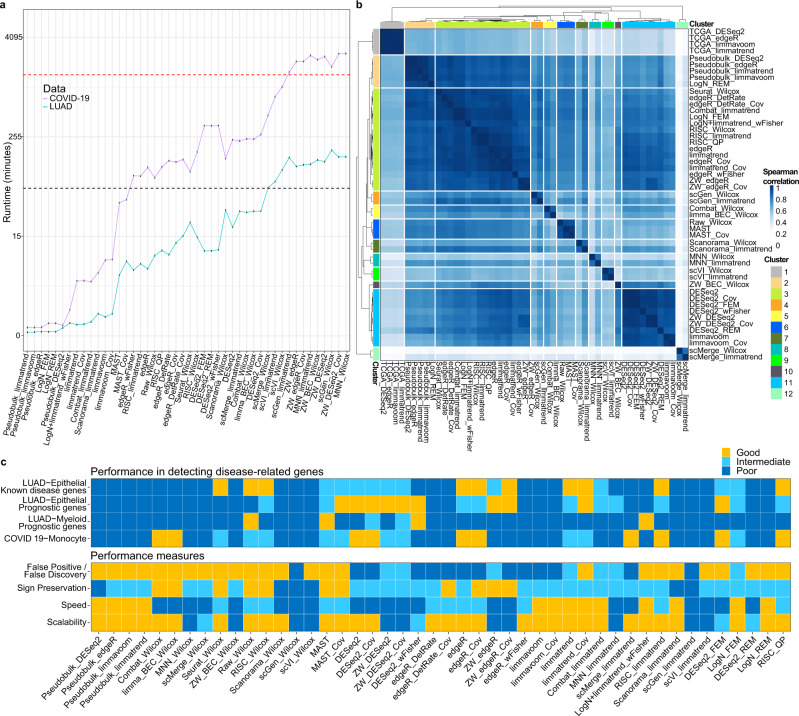
Integration of single-cell RNA sequencing data between different samples has been a major challenge for analyzing cell populations. However, strategies to integrate differential expression analysis of single-cell data remain underinvestigated. Here, we benchmark 46 workflows for differential expression analysis of single-cell data with multiple batches. We show that batch effects, sequencing depth and data sparsity substantially impact their performances. Notably, we find that the use of batch-corrected data rarely improves the analysis for sparse data, whereas batch covariate modeling improves the analysis for substantial batch effects. We show that for low depth data, single-cell techniques based on zero-inflation model deteriorate the performance, whereas the analysis of uncorrected data using limmatrend, Wilcoxon test and fixed effects model performs well. We suggest several high-performance methods under different conditions based on various simulation and real data analyses. Additionally, we demonstrate that differential expression analysis for a specific cell type outperforms that of large-scale bulk sample data in prioritizing disease-related genes.


Conflict of interest statement

The authors declare no competing interests.

Figures

Fig. 1
Fig. 1. An overview of our benchmark study for differential expression (DE) analysis of scRNA-seq data with multiple batches.
In total, 46 workflows from three integrative strategies and the naïve approach were tested.
Fig. 2
Fig. 2. Model-based simulation results for moderate depths (two batches; zero rate >80%).
Scatter plots (tSNE) of two batches for a small and b large batch effects. Principal variance component analysis results representing c small and d large batch effects. F0.5-scores for 46 differential expression (DE) workflows for e small and f large batch effects. Results for six cell proportion scenarios (12 instances in total: six for upregulated genes and six for downregulated genes) are represented as boxplots; the lower, center and upper bars represent the 25th, 50th and 75th percentiles, respectively, and the whiskers represent ± 1.5 × interquartile range. The vertical dotted lines (black) indicate the median F0.5-score of Wilcoxon test (Raw_Wilcox). Precision-recall curves for g small and h large batch effects. The partial areas under the curve for recall rate <0.5 (pAUPRs) are computed and sorted in descending order in the legends. The vertical dotted lines (black) indicate the recall rate of 0.5. The precision-recall pairs that correspond to q-value = 0.05 in each DE workflow are circled. n = 1050 cells were used for each test case.
Fig. 3
Fig. 3. Model-based simulation results for low depths (depth-10 and depth-4; zero rate >80%).
F0.5-scores for 46 differential expression (DE) workflows for (a) depth-10 and (b) depth-4. Results for six cell proportion scenarios (12 instances in total: six for upregulated genes and six for downregulated genes) are represented as boxplots; the lower, center and upper bars represent the 25th, 50th and 75th percentiles, respectively, and the whiskers represent ± 1.5 × interquartile range. The vertical dotted lines (black) indicate the median F0.5-score of Wilcoxon test (Raw_Wilcox). Precision-recall curves for c depth-10 and d depth-4. The partial areas under the curve for recall rate <0.5 (pAUPRs) are computed and sorted in descending order in the legends. The vertical dotted lines (black) indicate the recall rate of 0.5. The precision-recall pairs that correspond to q-value = 0.05 in each DE workflow are circled. n = 1000 cells were used for each test case.
Fig. 4
Fig. 4. Distortion analysis for differential expression (DE) workflows.
a Proportion of DE genes that altered their signs by each DE workflow (error ratios) for model-based simulation (two batches; large batch effects; depth-77). b Error ratios for the model-based simulation for only significantly detected DE genes (q-value <0.05). The vertical dotted lines (black) indicate the median error ratio of Wilcoxon test (Raw_Wilcox). c Error ratios for pancreatic alpha-cell (model-free) simulation data. d Error ratios for the pancreatic alpha-cell data for only significantly detected DE genes. e A scatterplot of the logFC values for the model-based simulation data with a moderate depth (depth-77) before (logFC_raw) and after (logFC_corrected) applying batch-effect correction (BEC) methods: Combat, limma (limma_BEC), MNNCorrect, Seurat_BEC, scMerge, ZINB-WaVE (ZW_BEC), scVI, scGen, Scanorama and RISC. Pearson correlation, its p-value and the angular cosine distance (Angular Dist) of scatter plot are shown for each BEC method. f The distortion levels for the moderate depth data as measured by the angular cosine distance from the logFC scatterplot for six cell proportion scenarios. The lower, center and upper bars of each boxplot represent the 25th, 50th and 75th percentiles, respectively, and the whiskers represent ± 1.5 × interquartile range. n = 1050 cells were used in a, b, e, f, and n = 900 cells were used in c and d.
Fig. 5
Fig. 5. Comparison of false positive controls (p-value <0.05) and false discovery controls (q-value <0.05) between differential expression workflows (gene filtering: zero rate > 0.95).
Test results for a seven batches of normal lung epithelial cells and b seven batches of model-based simulation data are shown as boxplots; the lower, center, and upper bars represent the 25th, 50th and 75th percentiles, respectively, and the whiskers represent ± 1.5 × interquartile range. Black dashes indicate the five percent of all genes tested. n = 2331 and 2400 cells were used from normal lung epithelial cells and model-based simulation.
Fig. 6
Fig. 6. Comparison of predictive powers for lung adenocarcinoma (LUAD) genes between differential expression (DE) workflows for scRNA-seq and bulk RNA-seq data.
Cumulative disease gene scores (GDA scores) for known disease genes up to top 20% DE gene ranks are shown for three cell types: a epithelial cells, b myeloid cells and c T/NK cells. X-axis represents the DE gene ranks in each DE analysis. Y-axis represents the cumulative score of known disease genes captured within top-k gene ranks by each DE analysis. The black-dashed slopes represent the expected cumulative scores of known disease genes for random gene ranks. Ten and four methods are selected for analyzing scRNA-seq and bulk/pseudobulk data, respectively. d p-values of truncated Komogorov-Smirnov (KS) test for DE analyses of scRNA-seq and TCGA RNA-seq data are shown for the three cell types. Black and gray dashes represent the two significance cutoffs p-values = 0.01 and = 0.05, respectively. e Rank percentiles of the 12 known LUAD genes with GDA score no less than 0.5 are visualized for six DE workflows applied to LUAD epithelial cells and four bulk sample DE methods applied to TCGA LUAD data. n = 7728, 17348, and 15293 cells were used for the analysis of epithelial, myeloid, and T/NK scRNA-seq data, respectively.
Fig. 7
Fig. 7. Comparison of runtimes, similarity of differential expression (DE) workflows and other measures.
a CPU times (log-scale) of DE workflows taken for analyzing lung adenocarcinoma (LUAD) epithelial cell (n = 7728) and COVID-19 monocyte (n = 100361) scRNA-seq data, each containing 10278 and 7242 genes, respectively. b Clustering heatmap of 46 DE workflows for LUAD epithelial cell data and four DE methods for TCGA LUAD data. The Spearman rank correlation of DE genes were used as the similarity measure. c Comparison of the capability of prioritizing disease-related genes between 46 DE workflows and their performance classified in terms of false positive/discovery controls, sign preservation of DE genes, speed, and scalability.

References

    1. Park J, et al. Single-cell transcriptomics of the mouse kidney reveals potential cellular targets of kidney disease. Science. 2018;360:758–763. doi: 10.1126/science.aar2131. - DOI - PMC - PubMed
    1. Lambrechts D, et al. Phenotype molding of stromal cells in the lung tumor microenvironment. Nat. Med. 2018;24:1277–1289. doi: 10.1038/s41591-018-0096-5. - DOI - PubMed
    1. Tran HTN, et al. A benchmark of batch-effect correction methods for single-cell RNA sequencing data. Genome Biol. 2020;21:12. doi: 10.1186/s13059-019-1850-9. - DOI - PMC - PubMed
    1. Luecken MD, et al. Benchmarking atlas-level data integration in single-cell genomics. Nat. Methods. 2022;19:41–50. doi: 10.1038/s41592-021-01336-8. - DOI - PMC - PubMed
    1. McDavid A, et al. Data exploration, quality control and testing in single-cell qPCR-based gene expression experiments. Bioinformatics. 2013;29:461–467. doi: 10.1093/bioinformatics/bts714. - DOI - PMC - PubMed

Publication types