. 2023 Mar 21;13(1):4623.
doi: 10.1038/s41598-023-31111-y.

Non-invasive measurements of ictal and interictal epileptiform activity using optically pumped magnetometers

Affiliations

Non-invasive measurements of ictal and interictal epileptiform activity using optically pumped magnetometers

Arjan Hillebrand et al. Sci Rep. .

Abstract

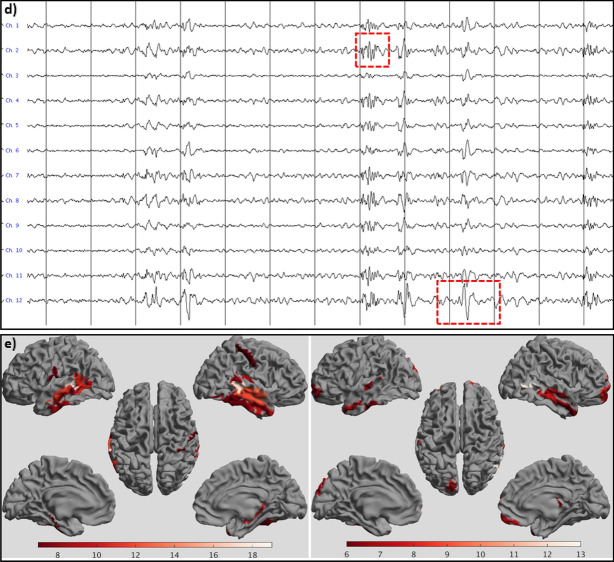
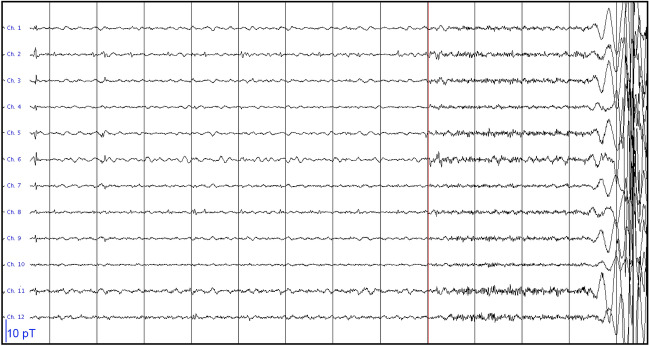
Magneto- and electroencephalography (MEG/EEG) are important techniques for the diagnosis and pre-surgical evaluation of epilepsy. Yet, in current cryogen-based MEG systems the sensors are offset from the scalp, which limits the signal-to-noise ratio (SNR) and thereby the sensitivity to activity from deep structures such as the hippocampus. This effect is amplified in children, for whom adult-sized fixed-helmet systems are typically too big. Moreover, ictal recordings with fixed-helmet systems are problematic because of limited movement tolerance and/or logistical considerations. Optically Pumped Magnetometers (OPMs) can be placed directly on the scalp, thereby improving SNR and enabling recordings during seizures. We aimed to demonstrate the performance of OPMs in a clinical population. Seven patients with challenging cases of epilepsy underwent MEG recordings using a 12-channel OPM-system and a 306-channel cryogen-based whole-head system: three adults with known deep or weak (low SNR) sources of interictal epileptiform discharges (IEDs), along with three children with focal epilepsy and one adult with frequent seizures. The consistency of the recorded IEDs across the two systems was assessed. In one patient the OPMs detected IEDs that were not found with the SQUID-system, and in two patients no IEDs were found with either system. For the other patients the OPM data were remarkably consistent with the data from the cryogenic system, noting that these were recorded in different sessions, with comparable SNRs and IED-yields overall. Importantly, the wearability of OPMs enabled the recording of seizure activity in a patient with hyperkinetic movements during the seizure. The observed ictal onset and semiology were in agreement with previous video- and stereo-EEG recordings. The relatively affordable technology, in combination with reduced running and maintenance costs, means that OPM-based MEG could be used more widely than current MEG systems, and may become an affordable alternative to scalp EEG, with the potential benefits of increased spatial accuracy, reduced sensitivity to volume conduction/field spread, and increased sensitivity to deep sources. Wearable MEG thus provides an unprecedented opportunity for epilepsy, and given its patient-friendliness, we envisage that it will not only be used for presurgical evaluation of epilepsy patients, but also for diagnosis after a first seizure.


Conflict of interest statement

M.J.B. is a director of Cerca Magnetics Limited, a spin-out company whose aim is to commercialise aspects of OPM-MEG technology. Cerca products include bi-planar coils such as those used in this work. N.H., M.J.B. and R.B. hold founding equity in Cerca Magnetics Limited, and N.H. and R.B. sit on the scientific advisory board. All other authors have no conflict of interest.

Figures

Figure 1
Figure 1
System setup. The whole OPM-system was placed in a magnetically shielded room, together with the SQUID-based system. The cold-head, which is part of the helium liquefier of the SQUID-system, caused static fields with a magnitude of ~ 300 nT. Compensation coils around the cold-head reduced these fields to ~ 30 nT. Field-nulling coils were wound on five large planes placed either side of the participant, different coloured wirepaths show coils designed to produce different field components (shown deliberately offset here; see also Fig. S1). Two fluxgates, placed near the location of where the patient’s head will be during the recordings, were used to record the remnant (static) background fields, and the user manually adjusted the current through the field-nulling coils in order to bring the remnant field level down to ~ 1 nT. During the patient-recordings, the low-pass (< 3 Hz) filtered signals from the OPMs themselves were used to dynamically compensate for temporal variations in the remnant fields, so that the field experienced by the OPMs in a typical recording remained below 0.4 nT.
Figure 2
Figure 2
Performance of static and dynamic nulling, and homogenous field correction. Before the patient recordings, the dynamic nulling performance was quantified with a 5-min empty-room recording with the OPMs in the patient-helmet (here: patient #5). Panel (a) shows the data for all 12 channels with only compensation of the static remnant magnetic field (using internal and external coils). Note that the remnant fields did not remain below 1 nT throughout the recording due to fluctuations in the environmental magnetic fields. However, when dynamic nulling was applied (b), the change in field could be kept below 0.3 nT. The shielding factor (panel c; computed as the power spectral density for the dynamic nulling divided by the power spectral density for the static nulling; see also Fig. S3) was above 1 for frequencies below 0.7 Hz, with a maximum of 12 for 0.1 Hz, and approximately 1 above 2.5 Hz. In between 0.7 and 2.5 Hz the shielding factor was smaller than 1, which is due to noise that is introduced by the choice of the PID-controller’s gains. The inset shows the field magnitude (L2-norm) of the field for the 12 channels (By- and Bz-direction separately) averaged over time (with error-bars showing the standard deviation) with static (blue) and dynamic (red) nulling applied, showing that dynamic nulling decreased the field magnitude with a factor 30. The field magnitude averaged over the empty-room recordings for the 7 patients was 0.09 and 0.11 nT for By and Bz, respectively (not shown), with the maximum absolute field in a channel never exceeding 0.7 nT. Panel (d) shows how Homogenous Field Correction further removes noise from the recorded data (recording 1 from patient #5). The black line denotes the HFC shielding factor (in dB) averaged over all channels (coloured lines).
Figure 3
Figure 3
Helmet design for patient #4 and field patterns recorded with SQUIDs and OPMs. (a) Field pattern produced by IED (green arrow indicates the source-reconstructed equivalent current dipole) in the previously recorded clinical MEG, originating from, and in agreement with, a right central focal cortical dysplasia. (b) 3D-helmet model, including removable front and OPM-holders. (c) 3D-printed helmet. (d) Digitised helmet points (red dots) aligned with helmet-model, and co-registered to the anatomy (head surface from MRI). (e) Magnetometer field pattern for an IED (at the time point of maximum SNR) recorded with the SQUID-based system (left), as well as field pattern for an IED recorded with the OPMs, projected onto the SQUID-sensor layout (using inverse/forward projection with minimum norm,). Note the good agreement between the IED field patterns, despite the limited sampling with the OPMs, suggesting that both systems recorded similar phenomena. Also note the agreement with the previously recorded IED (panel a) (see also Fig. S5).
Figure 4
Figure 4
Examples of epileptiform activity for patient #1. IEDs were recorded with SQUIDs (a,b) and OPMs (c,d) at sensor-level (a,c) and source-level (b,d,e). (a) 13.653 s of data for a selection of gradiometers over the left (upper half) and right (bottom half) temporal lobes. The grey vertical lines mark 1 s of data, filtered between 3–48 Hz. Note the presence of (many) IEDs over both hemispheres, with some examples highlighted. (b) Virtual electrodes for a selection of the left (upper half) and right (lower half) temporal ROIs of the BNA atlas. (c) Comparable signals were recorded with the six OPMs, placed over the left temporal lobe in this case (recorded earlier in the day). Alternating channels show recording in the OPMs’ By and Bz direction. As for the SQUID data, some of the spike-waves and polyspikes are highlighted. (d) Virtual electrode data for the same data segment (selection of left temporal BNA ROIs). (e) Number of times a region showed the maximum SNR (over all 246 ROIs) for the events that had been identified at sensor-level (total over all datasets) for SQUID (left) and OPM data (right). Results are displayed, with an arbitrary threshold, as a color-coded map on the parcellated template brain, viewed from, in clockwise order, the left, top, right, right midline, and left midline. Note that for both systems the regions in the temporal lobes most frequently had the maximum SNR for the identified IEDs, consistent with sEEG, EEG, and earlier clinical MEG findings (see Table S1).
Figure 4
Figure 4
Examples of epileptiform activity for patient #1. IEDs were recorded with SQUIDs (a,b) and OPMs (c,d) at sensor-level (a,c) and source-level (b,d,e). (a) 13.653 s of data for a selection of gradiometers over the left (upper half) and right (bottom half) temporal lobes. The grey vertical lines mark 1 s of data, filtered between 3–48 Hz. Note the presence of (many) IEDs over both hemispheres, with some examples highlighted. (b) Virtual electrodes for a selection of the left (upper half) and right (lower half) temporal ROIs of the BNA atlas. (c) Comparable signals were recorded with the six OPMs, placed over the left temporal lobe in this case (recorded earlier in the day). Alternating channels show recording in the OPMs’ By and Bz direction. As for the SQUID data, some of the spike-waves and polyspikes are highlighted. (d) Virtual electrode data for the same data segment (selection of left temporal BNA ROIs). (e) Number of times a region showed the maximum SNR (over all 246 ROIs) for the events that had been identified at sensor-level (total over all datasets) for SQUID (left) and OPM data (right). Results are displayed, with an arbitrary threshold, as a color-coded map on the parcellated template brain, viewed from, in clockwise order, the left, top, right, right midline, and left midline. Note that for both systems the regions in the temporal lobes most frequently had the maximum SNR for the identified IEDs, consistent with sEEG, EEG, and earlier clinical MEG findings (see Table S1).
Figure 5
Figure 5
Ictal onset for patient #7. The first and last 6 channels are from the 3 OPMs over the right and left anterior temporal lobe, respectively, with alternating channels recording in the OPMs’ By and Bz direction (which is, in this case, in the anterior–posterior direction and approximately perpendicular to the scalp (inwards), respectively). The grey vertical lines mark 1 s of data, that were filtered between 3–48 Hz. Note the increase in fast activity, simultaneously over both hemispheres, after about 9 secs, marking the start of the seizure (red vertical line). This is followed by artefacts due to movement during the seizure. Although it cannot be ruled-out that the fast activity during the 3 secs before the bodily movements was due to muscle activity, we believe that this is unlikely as the clinical onset of the seizure (blinking) started ~ 2 s after the onset of the fast activity (see Supplemental Material), and no other movements were discernible during that period (compare also with video-EEG recording in Supplemental Material).

References

    1. Colon AJ, Ossenblok P, Nieuwenhuis L, Stam KJ, Boon P. Use of routine MEG in the primary diagnostic process of epilepsy. J. Clin. Neurophysiol. 2009;26:326–332. doi: 10.1097/WNP.0b013e3181baabef. - DOI - PubMed
    1. Rampp S, et al. Magnetoencephalography for epileptic focus localization in a series of 1000 cases. Brain. 2019;142:3059–3071. doi: 10.1093/brain/awz231. - DOI - PubMed
    1. Nissen IA, Stam CJ, Citroen J, Reijneveld JC, Hillebrand A. Preoperative evaluation using magnetoencephalography: Experience in 382 epilepsy patients. Epilepsy Res. 2016;124:23–33. doi: 10.1016/j.eplepsyres.2016.05.002. - DOI - PubMed
    1. Lüders HO, Najm I, Nair D, Widdess-Walsh P, Bingman W. The epileptogenic zone: General principles. Epileptic Disord. 2006;8(Suppl 2):S1–S9. - PubMed
    1. Shah AK, Mittal S. Invasive electroencephalography monitoring: Indications and presurgical planning. Ann. Indian Acad. Neurol. 2014;17:S89–S94. doi: 10.4103/0972-2327.128668. - DOI - PMC - PubMed

Publication types