. 2023 Mar 21;13(1):4647.
doi: 10.1038/s41598-023-30256-0.

Chlorin e6-associated photodynamic therapy enhances abscopal antitumor effects via inhibition of PD-1/PD-L1 immune checkpoint

Affiliations

Chlorin e6-associated photodynamic therapy enhances abscopal antitumor effects via inhibition of PD-1/PD-L1 immune checkpoint

Pallavi Gurung et al. Sci Rep. .

Erratum in

Abstract

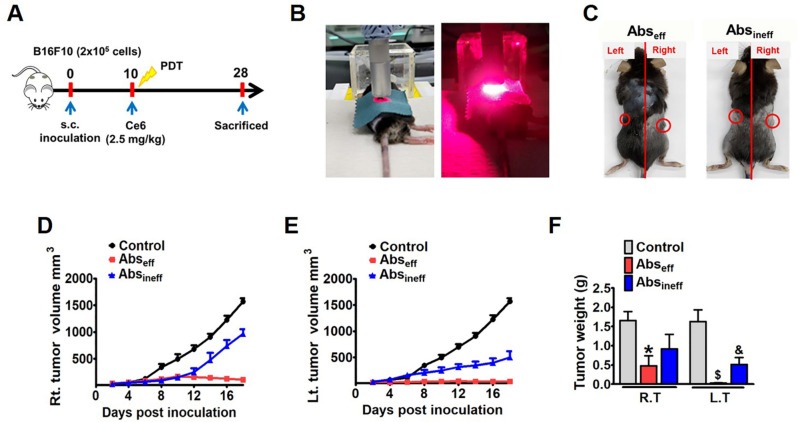
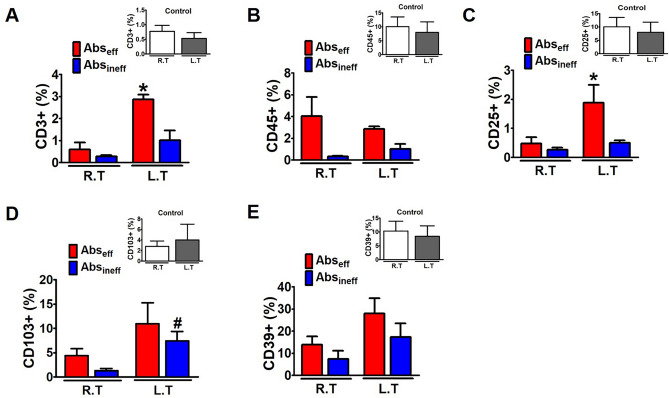
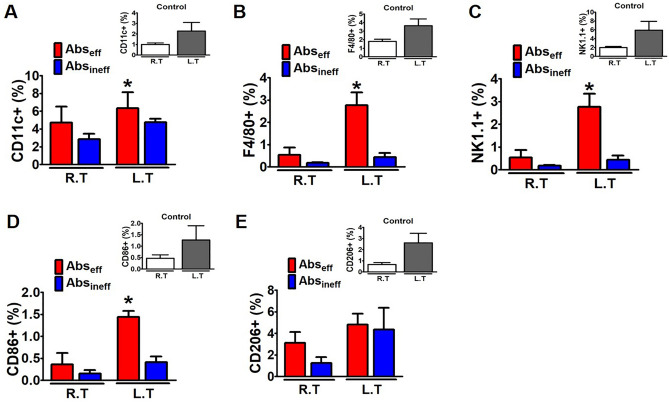
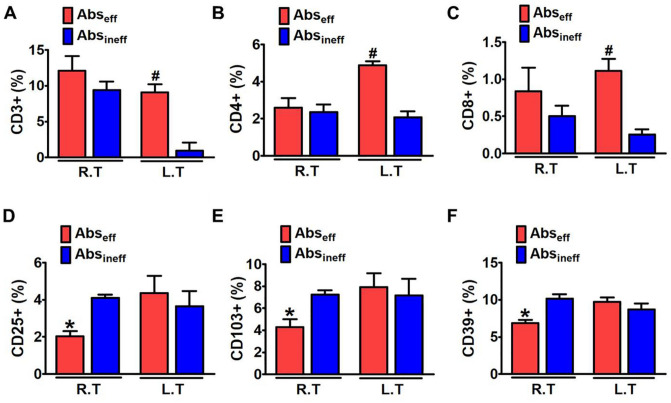
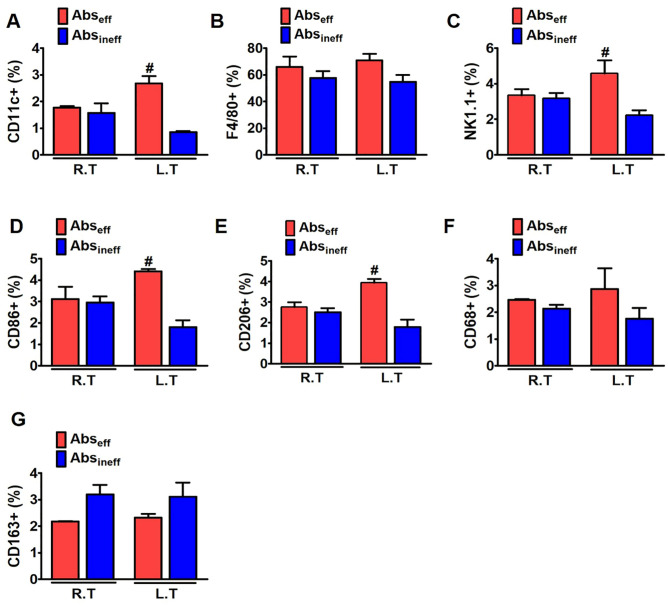
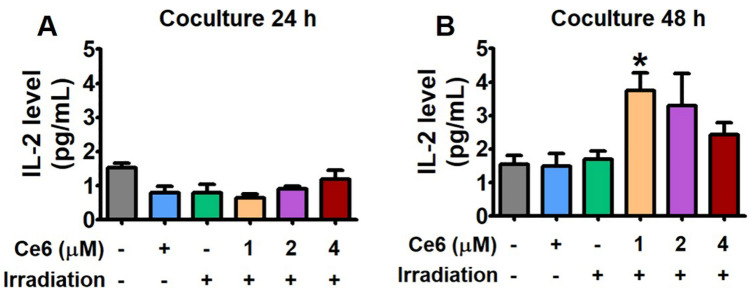
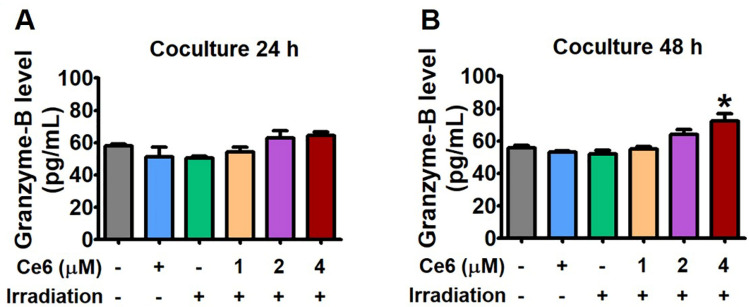
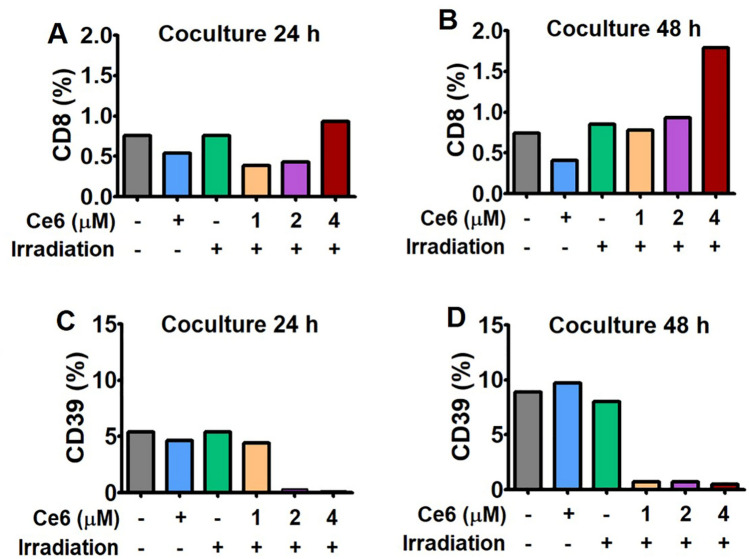
We hypothesized that photodynamic therapy (PDT) with Chlorin e6 (Ce6) enhances antitumor abscopal effects via inhibition of the programmed cell death-1/programmed death-ligand 1 (PD-1/PD-L1) immune checkpoint. By using syngeneic melanoma and pancreatic tumor mouse models, we studied the Ce6-PDT-induced immune responses in local and distant tumor microenvironments. In addition, the Ce6-PDT's target in the PD-1/PD-L1 interaction was analyzed in MC38-hPD-L1 colon cancer and PD-1 expressing Jurkat T cell coculture. The tumors in the irradiated and non-irradiated sites in the abscopal effective (Abseff) group of both mouse models were regressed, proving the abscopal effect. The immunogenic effect in the Abseff group was associated with an expansion of T cell and other immune cells infiltration without changes in the CD39+ population in either the right or left tumors compared to control group. Furthermore, the abscopal ineffective (Absineff) group demonstrated lesser increase of T cells, decreased immune cell infiltration, and increased CD39-expressing Treg cells without suppression of tumor growth. In the coculture with PD-1-expressing Jurkat T cell, Ce6-PDT efficiently suppressed the PD-1/PD-L1 interactions by increasing the proliferation and cytotoxic activity of CD8+ T cells while decreasing CD39-expressing Treg cells in a dose-dependent manner. Likewise, the inhibition of PD-1/PD-L1 interactions was also correlated with the increased production of IL-2 and Granzyme B. Our findings imply that Ce6-PDT is a promising immunotherapy with the potential to improve the abscopal effect.


Conflict of interest statement

The authors declare no competing interests.

Figures

Figure 1
Figure 1
Abscopal antitumor effects in the melanoma mouse model. (A) Experimental scheme, (B) C57BL/6 mice were inoculated with B16F10 cells, received an intravenous injection of Ce6 (2.5 mg/kg) followed by irradiation using a diode laser (λ = 660 nm) at a rate of 100 J/cm2 for 8 min 20 s. (C) Mice were divided into Abseff and Absineff groups on the basis of the abscopal effect with Ce6-PDT. (D) Right tumor (RT) volume, (E) left tumor (LT) volume, (F) right and left tumor weight in the control, Abseff and Absineff groups respectively. Data are from an experiment representative with n = 3 in the control, n = 3 in the effective, and n = 4 in the ineffective group. *P < 0.05 compared to right control tumor.  #P < 0.05 compared to right tumor of the abscopal effective group, $P < 0.05 compared to left control tumor, and &P < 0.05 compared to left tumor of the abscopal effective group (by one-way ANOVA with Tukey's post hoc test for multiple comparisons).
Figure 2
Figure 2
Abscopal antitumor effects in the pancreatic tumor mouse model. Panc02 cells of 5 × 105 cell density were injected in the right and left flanks of mice. On the 12th day, Ce6 (2.5 mg/kg) was injected intravenously and after 3 h followed by irradiation using a diode laser (λ = 660 nm) at a rate of 100 J/cm2 for 8 min 20 s. (A) The experimental scheme, (B) right tumor volume (RT), (C) left tumor (LT) volume, (D) tumor weight and (E) spleen weight in the control, Abseff, and Absineff groups. Data are from an experiment representative with n = 3 in the control, n = 4 in the effective, and n = 4 in the ineffective group. *P < 0.05 compared to right control tumor. #P < 0.05 compared to right tumor of the abscopal effective group, $P < 0.05 compared to left control tumor, and &P < 0.05 compared to left tumor of the abscopal effective group (by one-way ANOVA with Tukey's post hoc test for multiple comparisons).
Figure 3
Figure 3
Enhanced accumulation and activation of T cells by Ce6-PDT in the melanoma mouse tumors. (A-E) Flow cytometry analysis to count and estimate the intratumoral fraction of (A) CD3+, (B) CD45+, (C) CD25+, (D) CD103+, and (E) CD39+ T cells, isolated from the irradiated right and non-irradiated left tumors in control, Abseff and Absineff group. After 28 days of tumor cell injection, T cells in tumor tissues were isolated from B16F10 tumor-bearing mice. Data are from an experiment representative with n = 3 in the control, n = 3 in the abscopal effective, and n = 4 in the abscopal ineffective group. *p < 0.05 compared to irradiated right tumors in abscopal effective group. #p < 0.05 compared to irradiated right tumors in abscopal ineffective group (by one-way ANOVA with Tukey's post hoc test for multiple comparisons).
Figure 4
Figure 4
Flow cytometric analysis of the immune cell in the irradiated and non-irradiated tumor of melanoma mouse tumors. Percentages of (A) CD11c+, (B) F4/80+, (C) NK1.1+ (D) CD86+, and (E) CD 206+ in irradiated and non-irradiated tumor in control, Abseff group, and Abseff group. Data are from an experiment representative with n = 3 in the control, n = 3 in the effective, and n = 4 in the ineffective group. *p < 0.05 compared to irradiated right tumors in abscopal effective group. #p < 0.05 compared to irradiated right tumors in abscopal ineffective group (by one-way ANOVA with Tukey's post hoc test for multiple comparisons).
Figure 5
Figure 5
Enhanced accumulation and activation of T cells by Ce6-PDT in the pancreatic mouse tumors. (A-E) Flow cytometry analysis to count and estimate the intratumoral fraction of (A) CD3+, (B) CD4+, (C) CD8+, (D) CD25+ (E) CD103+, and (F) CD39+ T cells, isolated from the irradiated right and non-irradiated left tumor in Abseff group and Absineff group. After 28 days of tumor cell injection, T cells within tumors were isolated from Panc02 pancreatic cancer bearing mice. Data are from an experiment representative of three mice in the effective and four mice in the ineffective group. *P < 0.05 compared to right tumor. #P < 0.05 compared to left tumor (by one-way ANOVA with Tukey's post hoc test for multiple comparisons).
Figure 6
Figure 6
Flow cytometric analysis of the immune cells in the irradiated and non-irradiated tumor of pancreatic mouse tumors. Percentages of (A) CD11c+, (B) F4/80+, (C) NK1.1+ (D) CD86+ (E) CD 206+ (F) CD68+, and (E) CD163+ in (A) 24 and (B) 48 h from the irradiated and non-irradiated pancreatic tumor in the Abseff group and Absineff group. Data are from an experiment representative of three mice in the effective and four mice in the ineffective group. *P < 0.05 compared to right tumor #P < 0.05 compared to left tumor (by one-way ANOVA with Tukey's post hoc test for multiple comparisons).
Figure 7
Figure 7
Effect of Ce6-PDT on IL-2 cytokine release in Jurkat T cells and MC38 colon cancer cells coculture model. Cell culture media was analyzed to measure IL-2 level by cytokine ELISA in (A) 24 and (B) 48 h. The concentration of Ce6 only is 4 μΜ. Data are presented as mean ± S.E. of three representative independent experiments. *P < 0.05 compared to vehicle-treated control. (by one-way ANOVA with Tukey's post hoc test for multiple comparisons).
Figure 8
Figure 8
Inhibition of PD-1/PD-L1 checkpoint by Ce6-PDT and increased granzyme B production. Cell culture media was analyzed to measure granzyme level by cytokine ELISA in (A) 24 and (B) 48 h. The concentration of Ce6 only is 4 μΜ. Data are presented as mean ± S.E. of three representative independent experiments. *P < 0.05 compared to vehicle-treated control. (by one-way ANOVA with Tukey's post hoc test for multiple comparisons).
Figure 9
Figure 9
Augmentation of cytotoxic T cells and deduction of CD39+ Treg cells through the blockage of PD-1/PD-L1 interaction by Ce6-PDT. PD-L1 aAPC/CHO-K1 cells were plated and incubated at 37 °C for 20 h prior to the addition of PD-1 effector cells. Cells were treated with an increasing concentrations of Ce6 (1–4 µM) followed by PDT. The concentration of Ce6 only is 4 μΜ. PD-1/PD-L1 immune check-point blockage by Ce6-PDT was analyzed to measure the CD8+ T cells and CD39+ T cells (A), (C) in 24 h and (B), (D) in 48 h of coculture respectively. Data are presented as the means only.

References

    1. Gunaydin G, Gedik ME, Ayan S. Photodynamic therapy for the treatment and diagnosis of cancer–a review of the current clinical status. Front. Chem. 2021;608:79. - PMC - PubMed
    1. Tang W, et al. Red blood cell-facilitated photodynamic therapy for cancer treatment. Adv. Func. Mater. 2016;26:1757–1768. doi: 10.1002/adfm.201504803. - DOI - PMC - PubMed
    1. Shen Z, et al. Strategies to improve photodynamic therapy efficacy by relieving the tumor hypoxia environment. NPG Asia Mater. 2021;13:1–19. doi: 10.1038/s41427-021-00303-1. - DOI
    1. Agostinis P, et al. Photodynamic therapy of cancer: An update. CA Cancer J. Clin. 2011;61:250–281. doi: 10.3322/caac.20114. - DOI - PMC - PubMed
    1. Mroz P, Hamblin MR. The immunosuppressive side of PDT. Photochem. Photobiol. Sci. 2011;10:751–758. doi: 10.1039/c0pp00345j. - DOI - PMC - PubMed

Publication types