. 2023 Mar 21;13(1):4641.
doi: 10.1038/s41598-023-31779-2.

Distributed dynamic strain sensing of very long period and long period events on telecom fiber-optic cables at Vulcano, Italy

Affiliations

Distributed dynamic strain sensing of very long period and long period events on telecom fiber-optic cables at Vulcano, Italy

Gilda Currenti et al. Sci Rep. .

Abstract

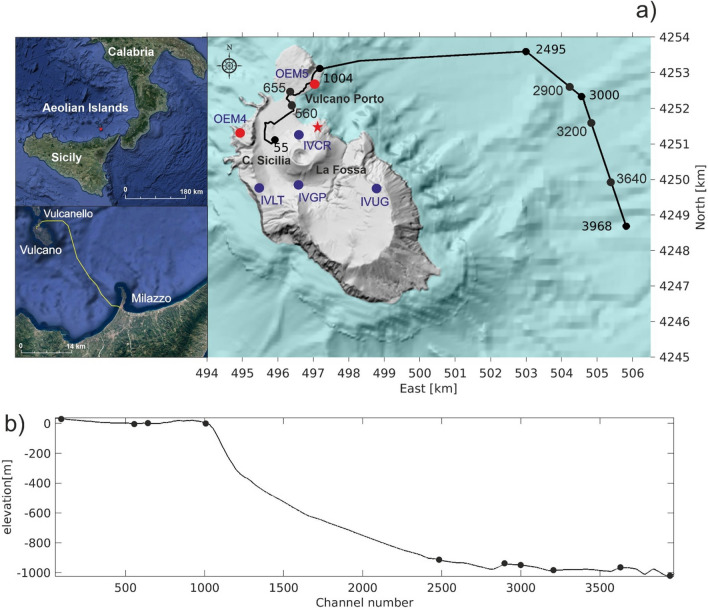
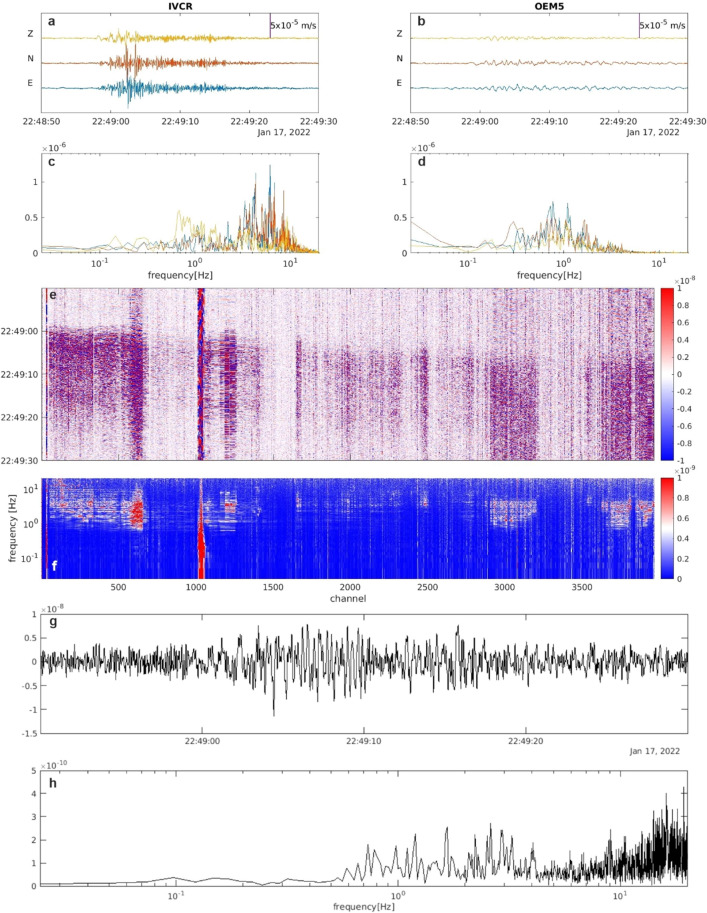
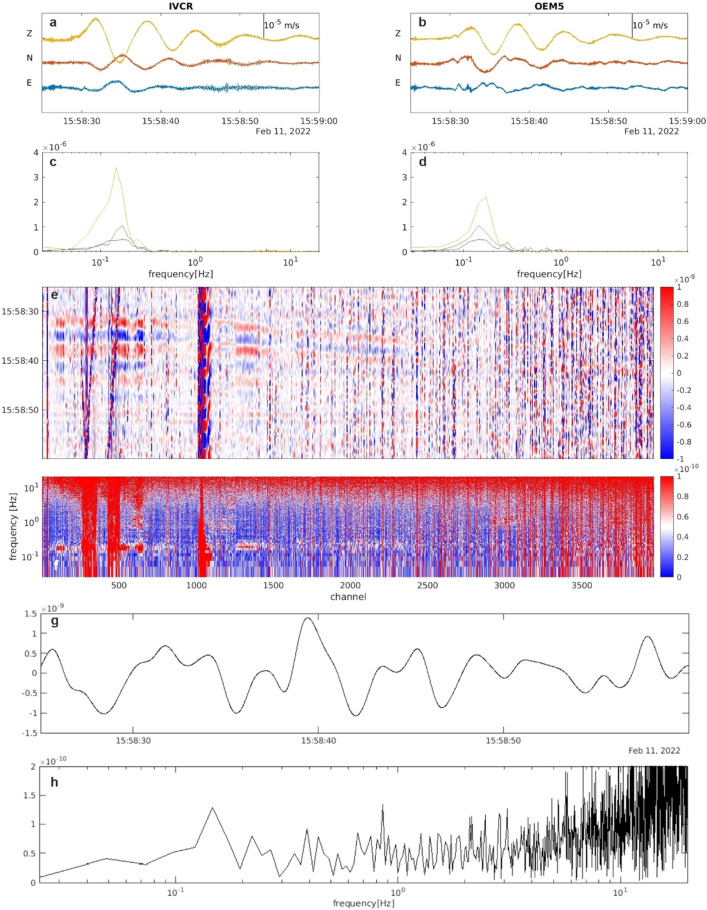
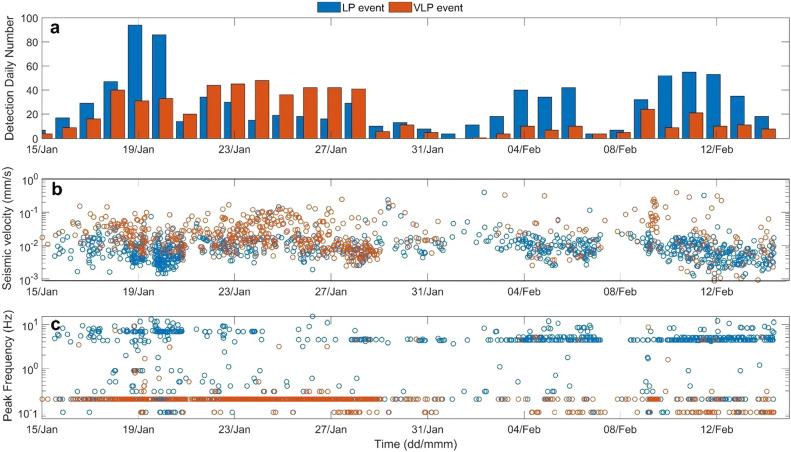
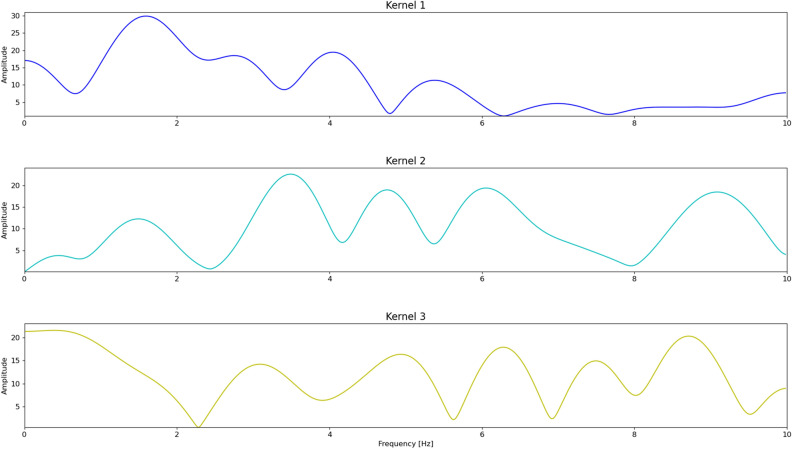
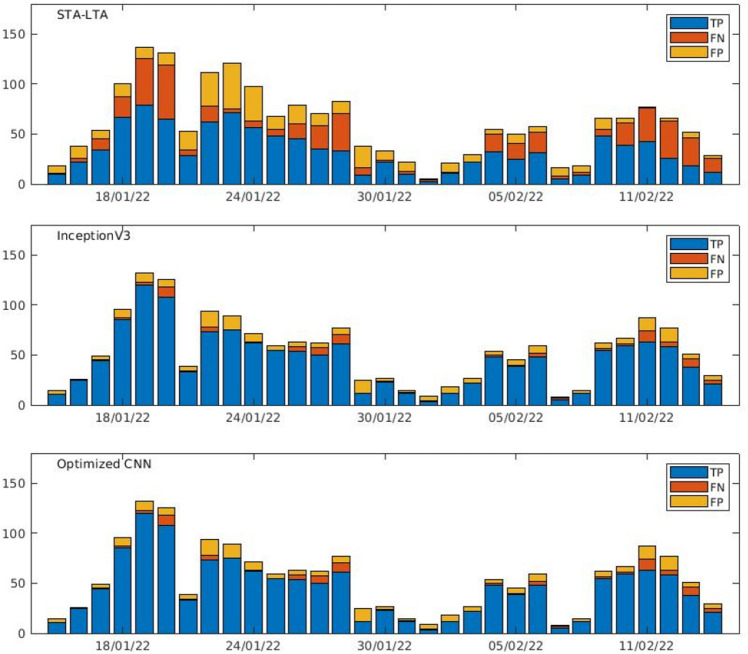
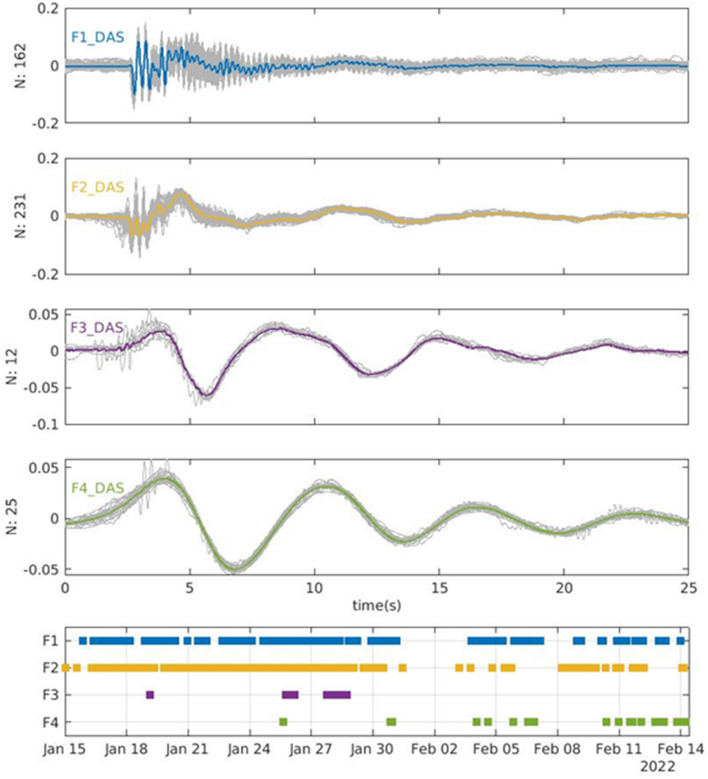
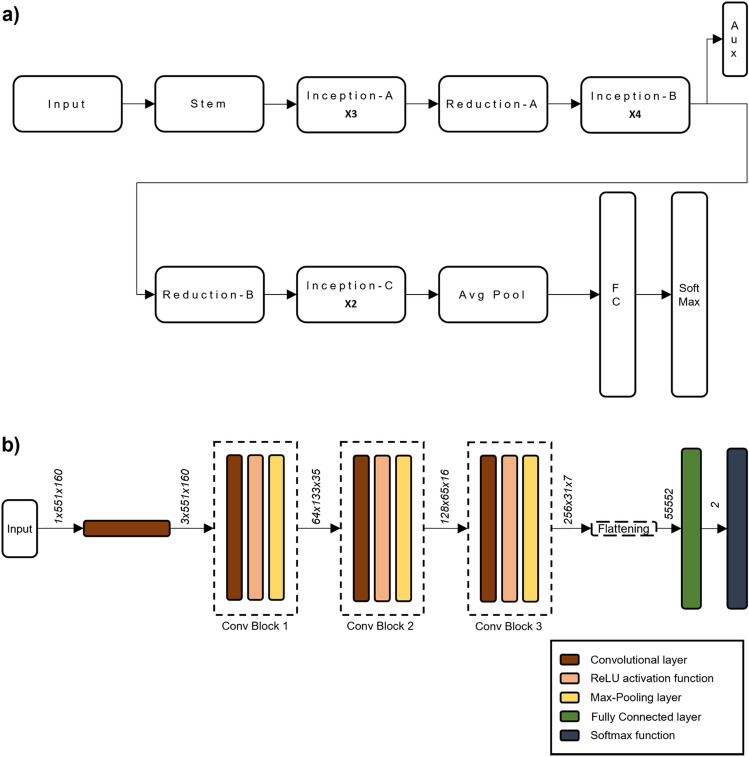
Volcano-seismic signals can help for volcanic hazard estimation and eruption forecasting. However, the underlying mechanism for their low frequency components is still a matter of debate. Here, we show signatures of dynamic strain records from Distributed Acoustic Sensing in the low frequencies of volcanic signals at Vulcano Island, Italy. Signs of unrest have been observed since September 2021, with CO2 degassing and occurrence of long period and very long period events. We interrogated a fiber-optic telecommunication cable on-shore and off-shore linking Vulcano Island to Sicily. We explore various approaches to automatically detect seismo-volcanic events both adapting conventional algorithms and using machine learning techniques. During one month of acquisition, we found 1488 events with a great variety of waveforms composed of two main frequency bands (from 0.1 to 0.2 Hz and from 3 to 5 Hz) with various relative amplitudes. On the basis of spectral signature and family classification, we propose a model in which gas accumulates in the hydrothermal system and is released through a series of resonating fractures until the surface. Our findings demonstrate that fiber optic telecom cables in association with cutting-edge machine learning algorithms contribute to a better understanding and monitoring of volcanic hydrothermal systems.


Conflict of interest statement

The authors declare no competing interests.

Figures

Figure 1
Figure 1
(a) Location map of TIM fiber optic cable connecting Vulcano to Milazzo interrogated by a DAS device hosted at the TIM power station of Vulcano. Permanent (IV*, blue dots) and mobile (OEM*, red dots) broadband seismic stations operating at Vulcano and used in the analysis are also reported. (b) Topographic and bathymetric profile along the fiber-optic cable route. Fiber channel numbers at specific locations are shown (black dots). The red star indicates the location of the source of the VLP events, obtained by a grid search method based on radial semblance function,.
Figure 2
Figure 2
Representative example of a VLP signal recorded by the DAS and by the broadband seismic sensors at IVCR station, the closer to the crater area, and at the OEM5 station, the nearest to the fiber cable (see Fig. 1). (a,b) 3C seismic signals recorded at IVCR and OEM5 (near to the fiber channel 888; Fig. 1) and their spectra (c,d). (e) DAS strainrate signal filtered below 10 Hz. (f) Spectra of the DAS strainrate record. Traces of the DAS strainrate (g) and its spectrum (h) at the channel near to the OEM5 station.
Figure 3
Figure 3
Example of LP event: (a,b) 3C seismic signals recorded at IVCR (in the summit area) and at OEM5 (nearest to the fiber) and their spectra (c,d). (e) DAS strainrate signal filtered below 10 Hz. (f) Full spectra of the DAS strainrate record. Traces of the DAS strainrate (g) and its spectrum (h) at the channel near to the OEM5 station.
Figure 4
Figure 4
Example of a monochromatic VLP event: (a,b) 3C seismic signals recorded at IVCR (in the summit area) and at OEM5 (nearest to the fiber) and their spectra (c,d). (e) DAS strainrate signal filtered below 10 Hz. (f) Full spectra of the DAS strainrate record. Traces of the DAS strainrate (g) and its spectrum (h) at the channel near to the OEM5 station.
Figure 5
Figure 5
Daily number (a), peak-to-peak amplitude (b) and frequency peak (c) of LP (light blue) and VLP (orange) detected events of the INGV catalog in the time interval 15 January- 14 February 2022.
Figure 6
Figure 6
Frequency responses of the 3 kernels in the first convolutional layer of Optimized CNN network. Frequencies above 5 Hz are not significant because the signals were previously filtered below 5.5 Hz.
Figure 7
Figure 7
Distribution of daily numbers of DAS detected events using STA-LTA algorithm, the InceptionV3 and the optimized CNN.
Figure 8
Figure 8
Stacked waveforms (thick coloured lines) of individual normalized events (thin gray lines) for the six identified families recorded at IVCR station (af). Each signal is normalized by centering the data to zero mean and scaling them to unity standard deviation. Temporal distribution of the occurrence of the IVCR classified events (g). Normalized spectra of the stacked waveforms (h).
Figure 9
Figure 9
Stacked waveforms (thick colored lines) of individual normalized events (thin gray lines) for the identified families on the DAS data. The waveforms are those recorded at IVCR station to allow a comparison with the families identified using the seismic signal at IVCR (Fig. 6). Temporal distribution of the occurrence of the DAS classified events.
Figure 10
Figure 10
(a) Inception-v3 architecture. It includes three types of Inception modules, two of which perform the factorization of convolutions, both in smaller (Inception-A) and asymmetric convolutions (Inception-B), while the third type expands the filter bank outputs to promote high dimensional representations (Inception-C). This CNN exploits an auxiliary classifier (AUX) as a regularizing element and an efficient grid size reduction (Reduction-A and Reduction-B) by concatenating the feature maps obtained from convolutions with stride 2 and from max-pooling operation. Each convolutional layer is followed by batch normalization and Rectified Linear Unit (ReLU) activation function. (b) Optimized CNN architecture. The output tensor dimension of each layer (marked in Italics) is in the form number of channels, height, width.

References

    1. Neuberg, J., Luckett, R., Ripepe, M. & Braun, T. Highlights from a seismic broadband array on Stromboli Volcano. Geophys. Res. Lett.21,10.1029/94GL00377. issn: 0094–8276 (1994).
    1. Chouet, B. A. Seismic Model for the Source of Long-Period Events and Harmonic Tremor. In: Gasparini, P., Scarpa, R., Aki, K. (eds) Volcanic Seismology. IAVCEI Proceedings in Volcanology, vol 3. Springer, Berlin, Heidelberg. 10.1007/978-3-642-77008-1_11 (1992).
    1. Jousset P, Neuberg J, Jolly A. Modelling low-frequency volcanic earthquakes in a viscoelastic medium with topography. Geophys. J. Int. 2004 doi: 10.1111/j.1365-246X.2004.02411.x. - DOI
    1. Syahbana D, et al. Fluid dynamics beneath a wet volcano inferred from the complex frequencies of long-period (LP) events: An example from Papandayan volcano, West Java, Indonesia during the 2011 seismic unrest. J. Volcanol. Geothermal. Res. 2014;280:76–89. doi: 10.1016/j.jvolgeores.2014.05.005. - DOI
    1. Jousset, P. et al. Fibre optic distributed acoustic sensing of volcanic events. Nat. Commun.13, 1753. 10.1038/s41467-022-29184-w (2022). - PMC - PubMed