. 2023 Mar 21;24(1):52.
doi: 10.1186/s13059-023-02892-2.

Multi-omics analysis identifies drivers of protein phosphorylation

Affiliations

Multi-omics analysis identifies drivers of protein phosphorylation

Tian Zhang et al. Genome Biol. .

Abstract

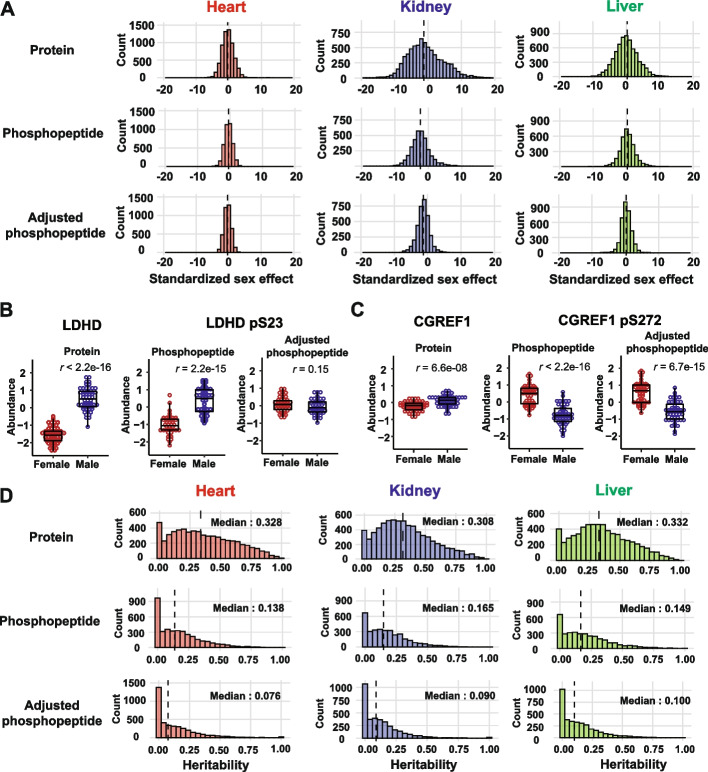
Background: Phosphorylation of proteins is a key step in the regulation of many cellular processes including activation of enzymes and signaling cascades. The abundance of a phosphorylated peptide (phosphopeptide) is determined by the abundance of its parent protein and the proportion of target sites that are phosphorylated.

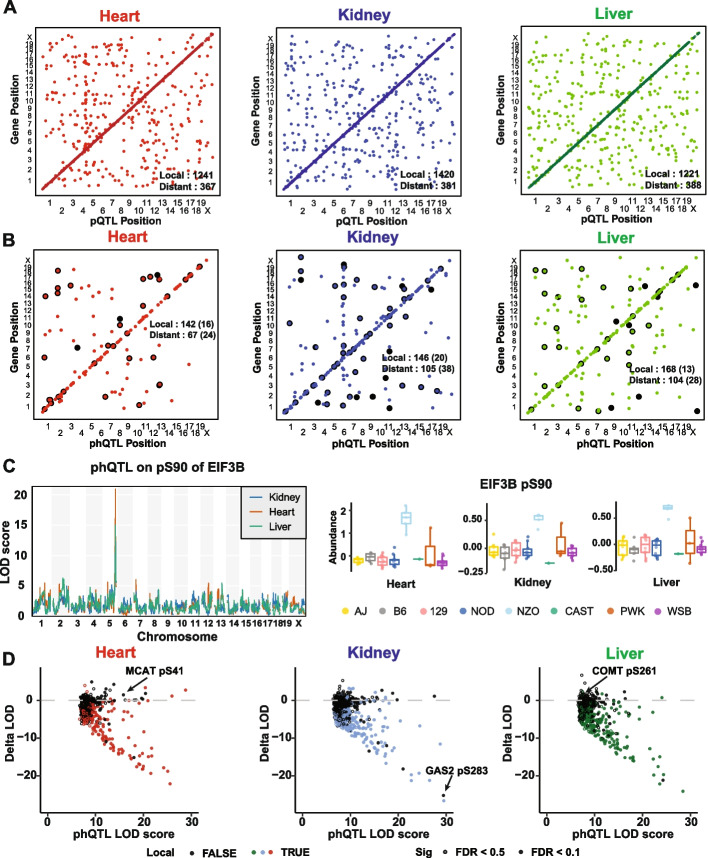
Results: We quantified phosphopeptides, proteins, and transcripts in heart, liver, and kidney tissue samples of mice from 58 strains of the Collaborative Cross strain panel. We mapped ~700 phosphorylation quantitative trait loci (phQTL) across the three tissues and applied genetic mediation analysis to identify causal drivers of phosphorylation. We identified kinases, phosphatases, cytokines, and other factors, including both known and potentially novel interactions between target proteins and genes that regulate site-specific phosphorylation. Our analysis highlights multiple targets of pyruvate dehydrogenase kinase 1 (PDK1), a regulator of mitochondrial function that shows reduced activity in the NZO/HILtJ mouse, a polygenic model of obesity and type 2 diabetes.

Conclusions: Together, this integrative multi-omics analysis in genetically diverse CC strains provides a powerful tool to identify regulators of protein phosphorylation. The data generated in this study provides a resource for further exploration.

Keywords: Collaborative Cross; Medation analysis; Multi-omics; Phosphorylation; Phosphorylation regulation; Quantitative trait loci (QTL).


Conflict of interest statement

The authors declare that they have no competing interests.

Figures

Fig. 1
Fig. 1
Overview of the proteome and phosphoproteome profiling of three tissues from Collaborative Cross strains using Tandem mass tags (TMT). A Liver, kidney, and heart samples were collected from one male and one female mouse from 58 Collaborative Cross (CC) inbred strains. Samples (116) were multiplexed utilizing TMT sample multiplexing reagents. Proteome and phosphoproteome analyses were collected by mass spectrometry. B Venn diagrams of the quantified proteins, C phosphopeptides, and D adjusted phosphopeptides in liver, kidney, and heart tissues
Fig. 2
Fig. 2
Sex effect and heritability on protein and phosphopepitdes across three tissues. A Histograms of standardized sex effect (difference/SE) on protein abundance (upper), phosphopeptides (middle), and adjusted phosphopeptides (lower) in heart, kidney, and liver tissues. B Sex difference in the relative abundance (batch corrected log2 intensity) of phosphopeptide harboring LDHD pS23 is due to sex effect on its parent protein. C Sex difference in the relative abundance of phosphopeptide harboring CGREF pS272 is not due to sex effect on its parent protein. D Histograms of heritability on protein abundance (upper), phosphopeptides (middle), and adjusted phosphopeptides (lower) in heart, kidney, and liver tissues. Dashed vertical lines represent the median
Fig. 3
Fig. 3
pQTL and phQTL mapping from CC strains in heart, kidney, and liver tissues. Stringently detected (FDR < 0.1) A pQTL, B phQTL, and adjusted phQTL in heart (left), liver (middle), and kidney (right) tissues. QTL are plotted by the genomic positions of proteins against QTL coordinates. Adjusted phQTL were highlighted in black. C Adjusted phQTL identified on EIF3B pS90 co-mapped in all three tissues. Relative abundances (batch corrected log2 intensity) of EIF3B pS90 in each tissue were grouped based on founder local haplotypes. D LOD scores of local and distant phQTL (FDR < 0.1 or 0.5) changed after adjusting for their parent protein abundances in heart, kidney, and liver tissues. MCAT pS41, GAS2 pS283, and COMT pS261 were labelled
Fig. 4
Fig. 4
Phosphopeptide abundance can be regulated by substrate abundance dependent or non-substrate abundance dependent mechanisms. A Diagram showing how the genetic effect resulting in phQTL detection may be regulated by either parent protein abundance (batch corrected log2 intensity) changes (Mechanism 1) or by phosphorylation stoichiometry (Mechanism 2) or both. B Genome scans for GAS2 and GAS2 pS283 in kidney tissue. C Path diagram of GAS2 pS283 abundance regulation in kidney tissue. D The PWK allele of the GAS2 pS283 phQTL drove low phosphopeptide abundance in kidney tissue. Data were categorized based on the founder haplotye at the identified pQTL. E Abundances of overall GAS2 and GAS2 pS283 were highly correlated (r = 0.99). Points are colored based on founder haplotype at Gas2. F Overall abundance of GAS2 and adjusted abundance (residual from regression of batch corrected log2 intensity) of GAS2 pS283 were not correlated (r = 2.4e−17). Points are colored based on founder haplotype at Gas2. G Abundance of GAS2 pS283 and adjusted abundance of GAS2 pS283 were not correlated (r = 0.02). Points are colored based on founder haplotype at Gas2. H Genome scans for MCAT and MCAT pS41 in heart tissue. I NZO alleles at Pkd1 drove the low abundances of MCAT pS41 in heart tissue. Colors denote the founder haplotype of additive allele effects at the identified pQTL of MCAT pS41. J Mediation analysis identified PDK1 expression as the mediator of MCAT pS41 abundances. Each gray dot is a mediation score representing the MCAT pQTL LOD score conditioned on a protein as candidate mediator. K Path diagram of MCAT pS41 abundance regulation in heart tissue. L NZO alleles at Pkd1 drove the low abundances of PDK1 in heart tissue. Colors denote the founder haplotype of additive allele effects at the identified pQTL of MCAT pS41. M The adjusted abundances of MCAT pS41 and PDK1 were highly correlated (r = 0.86) in heart tissue. N Mediation analysis identified PDK1 as the mediator of several phQTL in heart, kidney, and liver tissue, respectively
Fig. 5
Fig. 5
Phosphopeptide abundance can be regulated by both substrate abundance dependent and non-substrate abundance dependent mechanisms. A COMT pQTL and phQTL for COMT were mapped to different loci in liver tissue. B A local CAST allele at Comt drove high abundance of COMT in liver tissue. C Adjusted abundance of COMT pS261 categorized according to founder haplotype at Cdc14b. D Mediation analysis using transcriptomics data identified Cdc14b as the mediator of a phQTL for COMT pS261. Each gray dot is a mediation score representing the COMT pS261 phQTL LOD score conditioned on a transcript as candidate mediator. E Abundance of Cdc14b transcripts pS261 categorized according to founder haplotype at Cdc14b. The abundance of COMT pS261 is less correlated with Cdc14b transcripts before adjustment (r = −0.49) (F) compared to after adjustment (G) (r = −0.62). H Path diagram of COMT pS261 abundance regulation in liver tissue
Fig. 6
Fig. 6
Phosphorylation sites on one protein can be regulated coordinated and not coordinated. A Heatmap of Pearson correlations of abundances of phosphopeptides from parent protein ABLIM1. B Genome scans of pS539 and pS56 on UCKL1 in kidney tissue. C A local CAST allele at Uckl1 drove low abundance of UCKL1 pS539 in kidney tissue. D Distant NOD and PWK allele on chromosome 18 drove low abundance of UCKL1 pS56 in kidney tissue. E Heatmap of Pearson correlations among all proteins quantified in ATP synthase complex in heart tissue. F The AJ allele at Atp5h drove low abundance of the entire ATP synthase complex in heart tissue. All quantified ATP synthase complex subunits have low protein abundance in CC032, CC033, and CC044 strains, which possess the AJ allele, in heart data. G Mediation analysis using proteomics data identified ATP5H as the mediator of a phQTL for ATP5E. Each gray dot is a mediation score representing the ATP5E pQTL LOD score conditioned on a protein as candidate mediator. ATP5H was detected as the strongest mediator of the ATP5E distal pQTL in heart tissue. All ATP synthase complex subunits have mediation z-scores < −8 and were highlighted in black. Other quantified ATP synthase complex subunits, ATP5S, ATP5G2, and ATP5J, were highlighted in blue. Horizontal dashed line at LOD of 6 was included for reference. H Heatmap of Pearson correlations among all phosphorylation events quantified from the ATP synthase complex in heart tissue. The correlations among the five sites from ATP5A1 are highlighted by a dashed square. Correlation with FDR < 0.01 were highlighted using stars. I Genome scans of ATP5A1 pS53 in the three tissues, revealing co-mapping phQTL in all the three tissues. J Allele effects of ATP5A1 pS53 phQTL were highly correlated in the three tissues
Fig. 7
Fig. 7
Genetic regulation of PCCA and PCCB across three tissues. A Co-mapping distant phQTL of PCCA pS248 was identified in liver and heart but not kidney tissue. NZO allele drove the low level of this phosphorylation event. Data were categorized based on the founder haplotye at the identified phQTL. B Abundances of PDK1 and PCCA pS248 were highly correlated in heart and liver but not in kidney tissue. Abundance of PDK1 and PCCA pS248 in each individual sample (116) were categorized based on the haplotye of the phQTL on PCCA pS248 in heart and liver tissues on Chromosome 2. C Genome scans for PCCA pS248 are overlayed with mediation scores in heart and liver tissues. Each gray dot is a mediation score representing the PCCA pS248 phQTL LOD score conditioned on a protein as candidate mediator. D Genome scans of PCCA and PCCB in all the three tissues. Local pQTL for PCCB and distant pQTL for PCCA co-mapped to the same locus in heart tissue. PCCB was identified as the mediator of the PCCA distant pQTL. Local pQTL for PCCA and distant pQTL for PCCB co-mapped to the same locus in liver tissue and kidney tissues. PCCA was identified as the mediator of the PCCB distant pQTL. E Allele effects of identified pQTL for PCCA and PCCB in the three tissues. F Protein abundance of PCCA and PCCB were highly correlated in each tissue. Protein abundance in each individual sample (116) were categorized based on the haplotye of the pQTL on PCCA in kidney and liver tissues on Chromosome 14. G The transcript level of Pccb is distinctly higher than the mRNA level of Pcca in kidney and liver tissues but not in heart tissue. mRNA abundance of Pcca and Pccb in each individual sample (116) were categorized based on the haplotye of the pQTL on PCCA in heart tissue on Chromosome 9. H Sex-interactive local pQTL on PCCA and sex-interactive distant pQTL on PCCB co-mapped to the same locus in the kidney tissue, characterized by a distinct NZO effect (NZO males with greater abundances than NZO females). PCCA was identified as the mediator of PCCB sex-interactive distant pQTL. Points are colored by founder haplotype at sex-interactive phQTL. Males and females from the same CC strain were connected by a line

References

    1. Caenepeel S, Charydczak G, Sudarsanam S, Hunter T, Manning G. The mouse kinome: discovery and comparative genomics of all mouse protein kinases. Proc Natl Acad Sci U S A. 2004;101:11707–11712. doi: 10.1073/pnas.0306880101. - DOI - PMC - PubMed
    1. Lahiry P, Torkamani A, Schork NJ, Hegele RA. Kinase mutations in human disease: interpreting genotype–phenotype relationships. Nat Rev Genet. 2010;11:60–74. doi: 10.1038/nrg2707. - DOI - PubMed
    1. Manning G, Whyte DB, Martinez R, Hunter T, Sudarsanam S. The protein kinase complement of the human genome. Science. 1912;2002:298. - PubMed
    1. Hunter T. Protein kinases and phosphatases: the yin and yang of protein phosphorylation and signaling. Cell. 1995;80:225–236. doi: 10.1016/0092-8674(95)90405-0. - DOI - PubMed
    1. Haeder M, Rotsch M, Bepler G, Hennig C, Havemann K, Heimann B, Moelling K. Epidermal growth factor receptor expression in human lung cancer cell lines. Cancer Res. 1988;48:1132–1136. - PubMed

Publication types