. 2023 Mar 22;42(1):69.
doi: 10.1186/s13046-023-02641-0.

ALDOC- and ENO2- driven glucose metabolism sustains 3D tumor spheroids growth regardless of nutrient environmental conditions: a multi-omics analysis

Affiliations

ALDOC- and ENO2- driven glucose metabolism sustains 3D tumor spheroids growth regardless of nutrient environmental conditions: a multi-omics analysis

Claudia De Vitis et al. J Exp Clin Cancer Res. .

Abstract

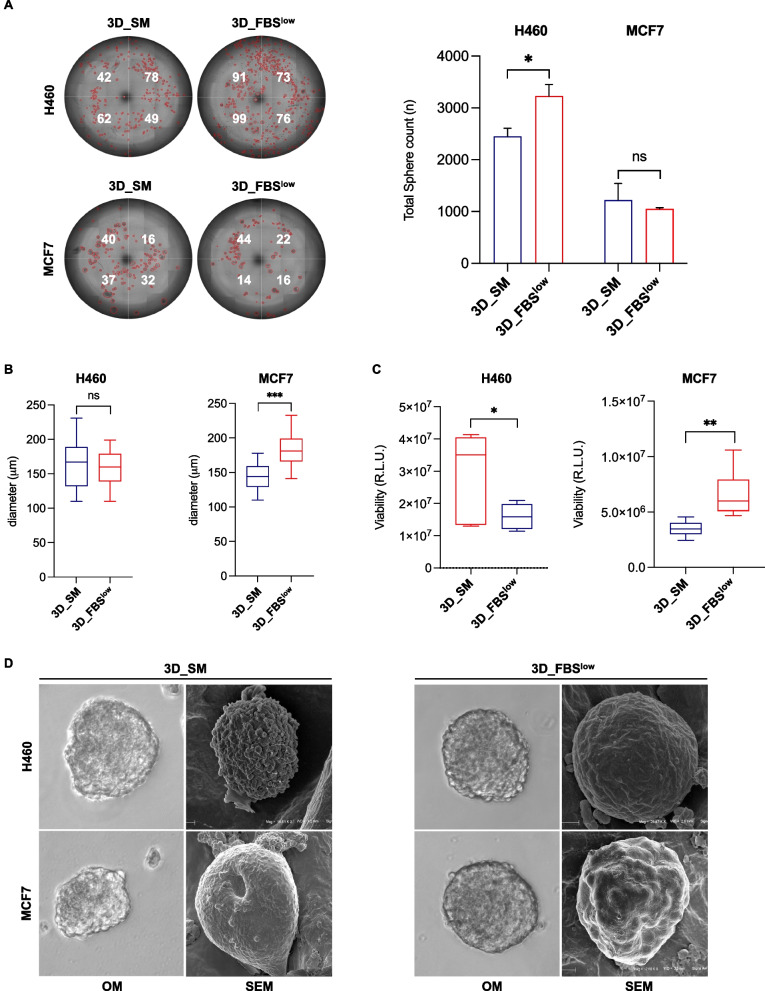
Background: Metastases are the major cause of cancer-related morbidity and mortality. By the time cancer cells detach from their primary site to eventually spread to distant sites, they need to acquire the ability to survive in non-adherent conditions and to proliferate within a new microenvironment in spite of stressing conditions that may severely constrain the metastatic process. In this study, we gained insight into the molecular mechanisms allowing cancer cells to survive and proliferate in an anchorage-independent manner, regardless of both tumor-intrinsic variables and nutrient culture conditions.

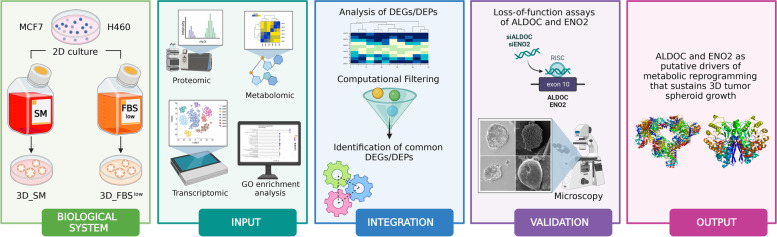
Methods: 3D spheroids derived from lung adenocarcinoma (LUAD) and breast cancer cells were cultured in either nutrient-rich or -restricted culture conditions. A multi-omics approach, including transcriptomics, proteomics, and metabolomics, was used to explore the molecular changes underlying the transition from 2 to 3D cultures. Small interfering RNA-mediated loss of function assays were used to validate the role of the identified differentially expressed genes and proteins in H460 and HCC827 LUAD as well as in MCF7 and T47D breast cancer cell lines.

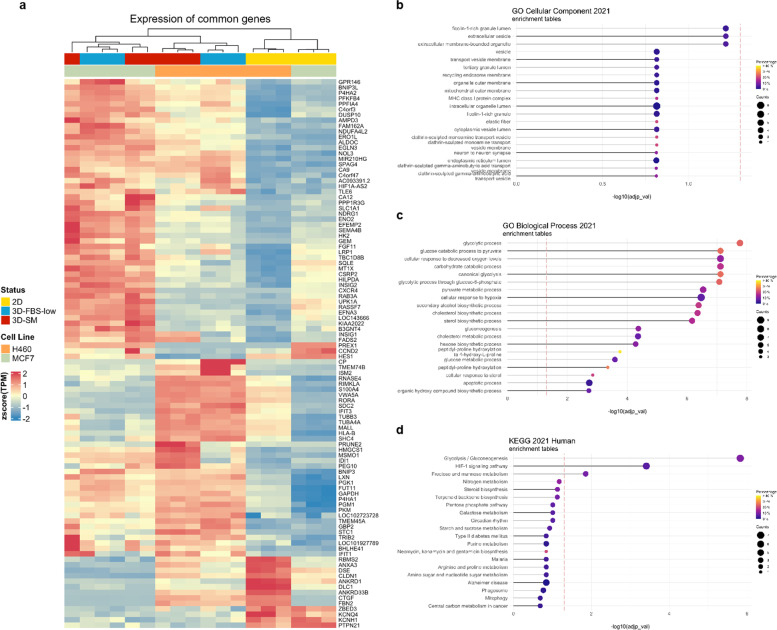
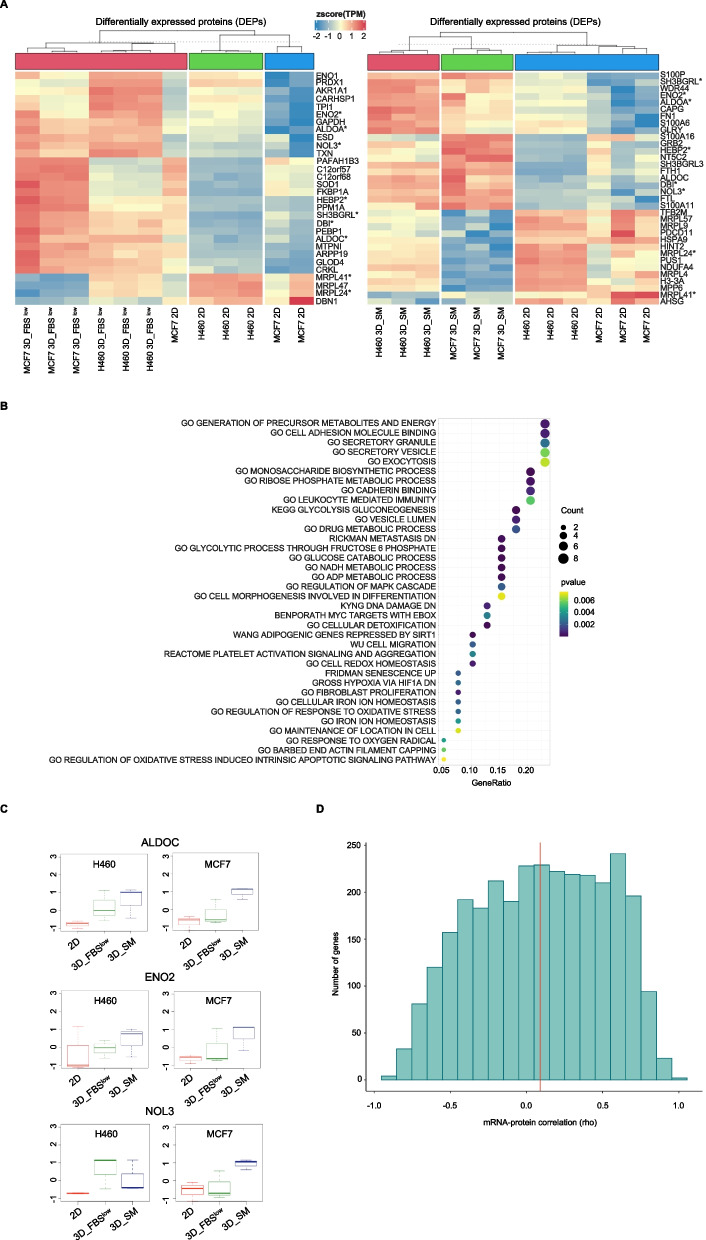
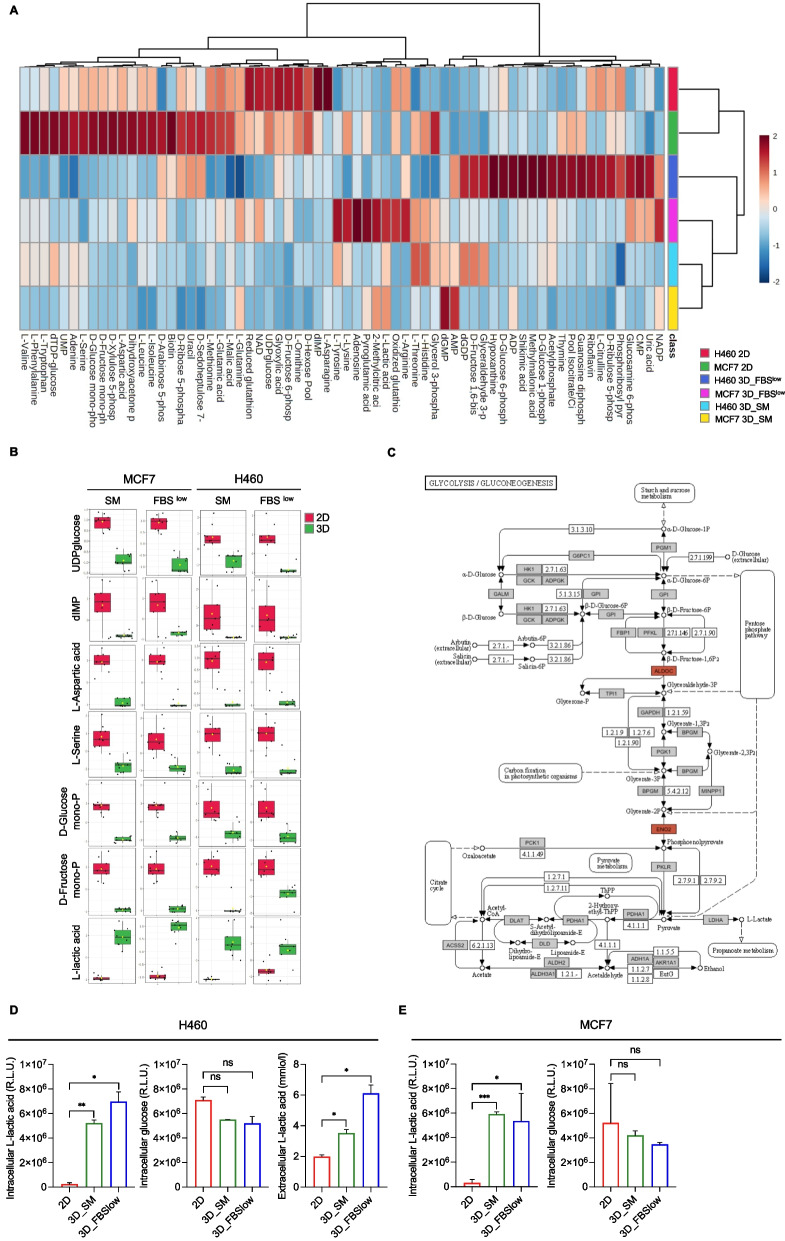
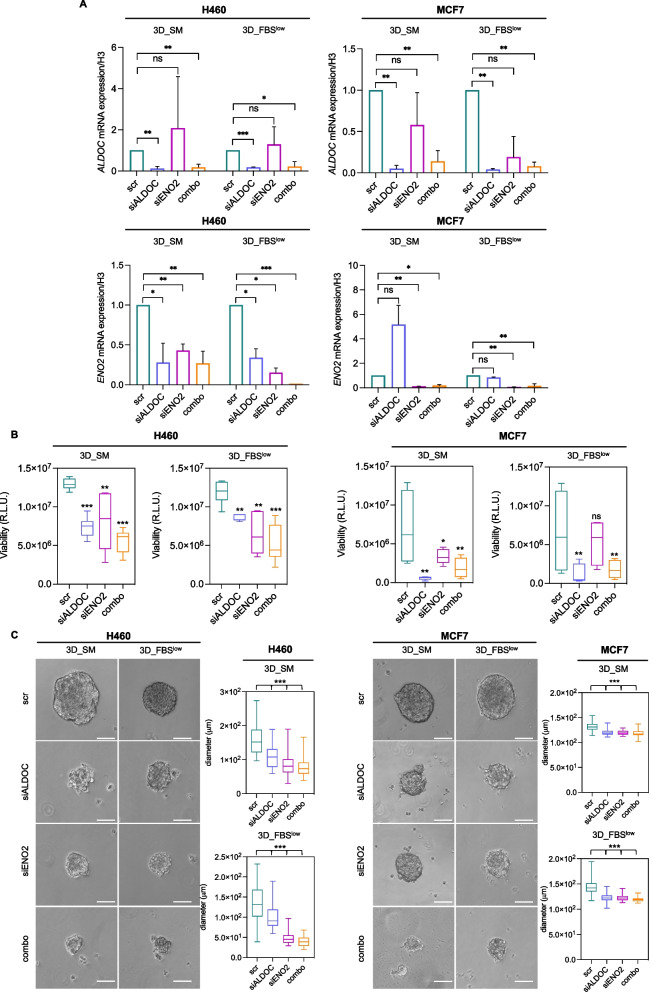
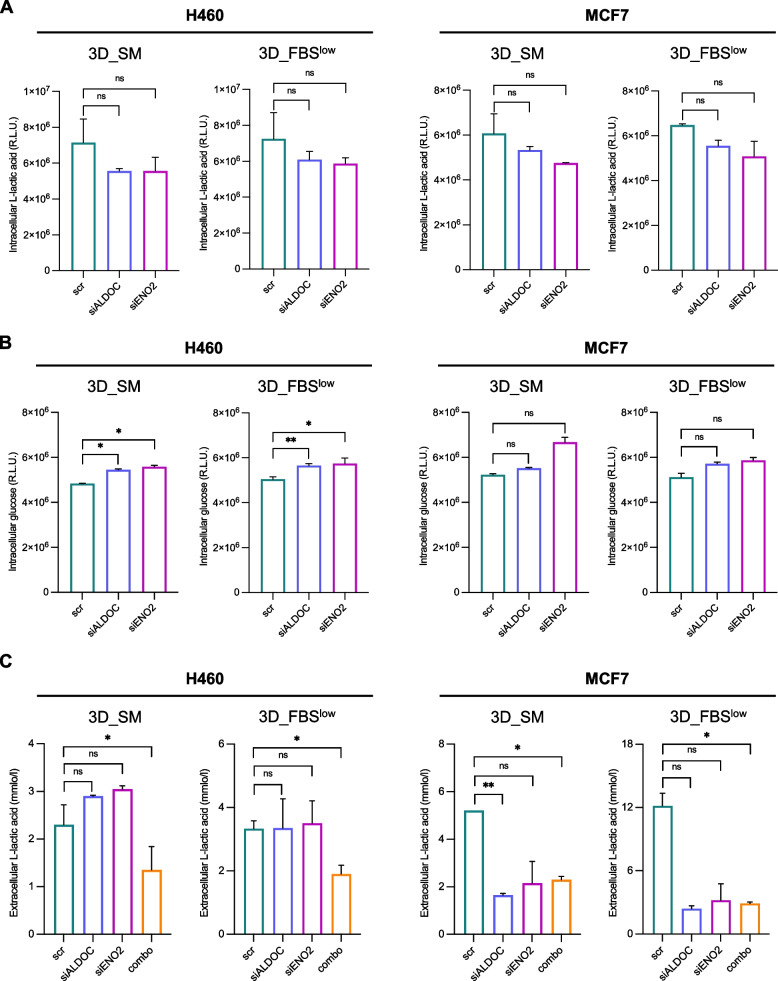
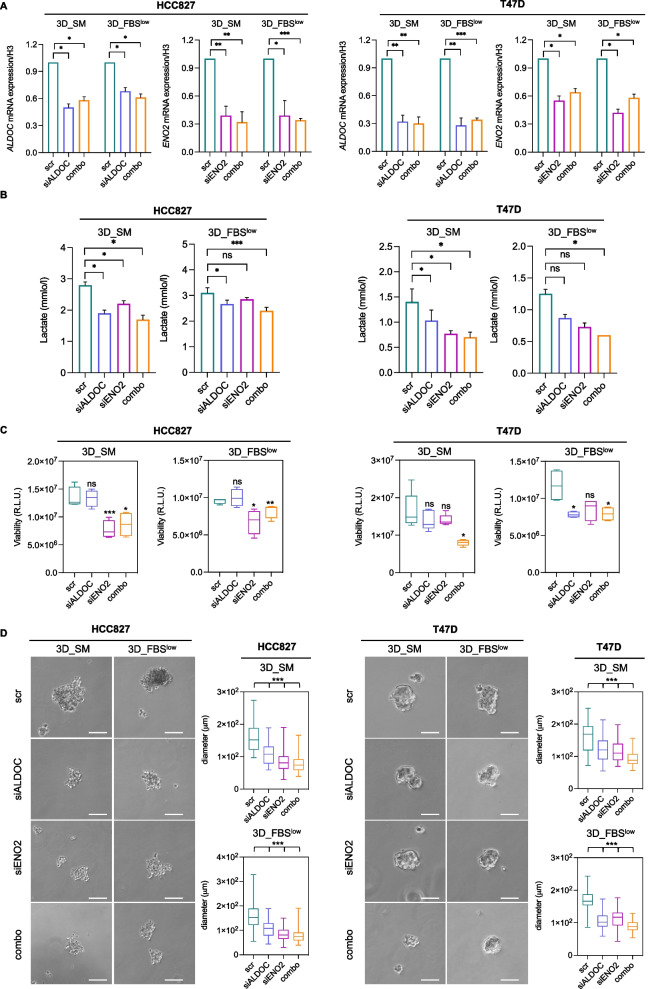
Results: We found that the transition from 2 to 3D cultures of H460 and MCF7 cells is associated with significant changes in the expression of genes and proteins involved in metabolic reprogramming. In particular, we observed that 3D tumor spheroid growth implies the overexpression of ALDOC and ENO2 glycolytic enzymes concomitant with the enhanced consumption of glucose and fructose and the enhanced production of lactate. Transfection with siRNA against both ALDOC and ENO2 determined a significant reduction in lactate production, viability and size of 3D tumor spheroids produced by H460, HCC827, MCF7, and T47D cell lines.

Conclusions: Our results show that anchorage-independent survival and growth of cancer cells are supported by changes in genes and proteins that drive glucose metabolism towards an enhanced lactate production. Notably, this finding is valid for all lung and breast cancer cell lines we have analyzed in different nutrient environmental conditions. broader Validation of this mechanism in other cancer cells of different origin will be necessary to broaden the role of ALDOC and ENO2 to other tumor types. Future in vivo studies will be necessary to assess the role of ALDOC and ENO2 in cancer metastasis.

Keywords: ALDOC; Breast cancer; ENO2; Glucose metabolism; Lung cancer; Metastasis; Omics; Tumor spheroids.


Conflict of interest statement

The authors declare that they have no competing interests.

Figures

Fig. 1
Fig. 1
Workflow of the multi-omics integrative analysis. Biological System: H460 LUAD and MCF7 breast cancer cell lines were cultured in 2D and 3D conditions. 3D tumor spheroids were grown either in a nutrient-rich (sphere medium, SM) or in a nutrient-restricted (FBSlow) culture media. Input: a total of 6 samples (H460 2D, H460 3D_SM, H460 3D_ FBSlow, MCF7 2D, MCF7 3D_SM, MCF7 3D_ FBSlow) were characterized through transcriptomic, proteomic and metabolomic analyses; differentially expressed genes (DEGs) and differentially expressed proteins (DEPs) between 3D vs 2D samples were further analyzed by using Gene Ontology (GO). Integration: DEGs and DEPs were integrated to identify a common signature of DEGs and DEPs in all the 2D to 3D transitions. ALDOC and ENO2 were found up-regulated in all 3D vs 2D culture conditions. Validation: siRNA-mediated knock down of ALDOC and ENO2 were performed to functionally validate the effects of these two enzymes on 3D tumor spheroids growth. Output: ALDOC and ENO2 represent putative drivers of the metabolic reprogramming responsible for the sphere-forming ability of H460 and MCF7 cells
Fig. 2
Fig. 2
Transcriptomic analysis of H460 and MCF7 cell lines grown in 2D and 3D culture conditions. A Heatmap of 100 DEGs in all 3D vs 2D conditions of both cell lines. Color intensity is proportional to the magnitude of changes. Relative expression levels are shown in red (upregulation) and blue (downregulation). B GO analysis of cellular component, C biological process, and D KEGG pathway analysis of DEGs in all 3D vs 2D conditions of both cell lines. The dot size denotes the number of DEGs, while colors correspond to the adjusted p-value range
Fig. 3
Fig. 3
Proteomic analysis of H460 and MCF7 cell lines grown in 2D and 3D culture conditions. A Heatmap of 3DEPs in 3D vs 2D conditions of both cell lines. Common DEPs in all 3D vs 2D conditions are labeled with (*). Color intensity is proportional to the magnitude of changes. Relative expression levels are shown in red (upregulation) and blue (downregulation). B KEGG pathway analysis of DEPs in all 3D vs 2D conditions of both cell lines. The dot size denotes the number of DEPs, while colors correspond to the adjusted p-value range. C Dot plots showing ALDOC, ENO2, and NOL3 protein levels of H460 and MCF7 cell lines in 3D vs 2D conditions. D The distribution of gene-wise mRNA-protein correlations computed as Spearman’s Rho (x-axis). A histogram of 20 bins is shown with height of each bar proportional to the number of genes in each bin. The median correlation is depicted by a red vertical line
Fig. 4
Fig. 4
Metabolomic analysis of H460 and MCF7 cell lines grown in 2D and 3D culture conditions. A Heatmap of 66 significantly altered metabolites in H460 and MCF7 cell lines in 2D vs 3D conditions. B Dot plots showing the 7 metabolites with the same trend of variation in all 3D vs 2D cultures of both cell lines. C KEGG pathway enrichment analysis of glycolysis/gluconeogenesis, showing in red ALDOC and ENO2 upregulation at both gene and protein levels. D-E Intracellular glucose and L-lactic acid amounts measured by luminometric assays and reported as relative light units (R.L.U.); quantification of L-lactic acid within the culture media (extracellular) performed by emogas analysis and expressed as mmol/l in H460 2D, H460 3D_SM, H460 3D_ FBSlow, MCF7 2D, MCF7 3D_SM, and MCF7 3D_ FBSlow. All the experiments were carried out in triplicate and results are presented as mean ± SD. p-value: * < 0.05, ** < 0.01, *** < 0.001. ns: not significant
Fig. 5
Fig. 5
Analysis of morphology and growth rate of H460- and MCF7-derived tumor spheroids. A Representative images and relative histograms of H460 3D_SM, H460 3D_ FBSlow, MCF7 3D_SM, and MCF7 3D_FBSlow tumor spheroids morphology, count and B diameter. C Cell viability of H460 3D_SM, H460 3D_FBSlow, MCF7 3D_SM, and MCF7 3D_FBSlow assessed by Cell titer-Glo 3D assay and expressed as relative light unit (RLU). D Representative images of H460 3D_SM, H460 3D_FBSlow, MCF7 3D_SM, and MCF7 3D_FBSlow tumor spheroids obtained by SEM. All the experiments were carried out in triplicate and results are presented as mean ± SD. p-value: * < 0.05, ** < 0.01. *** < 0.001. ns: not significant
Fig. 6
Fig. 6
ALDOC and ENO2 knock down reduces the sphere-forming ability of H460 and MCF7 cells. A qRT-PCR analyses of ALDOC and ENO2 in H460 3D_SM, H460 3D_ FBSlow, MCF7 3D_SM, and MCF7 3D_ FBSlow upon ALDOC and ENO2 silencing alone or in combination. B Cell viability of H460 3D_SM, H460 3D_FBSlow, MCF7 3D_SM, and MCF7 3D_FBSlow upon ALDOC and ENO2 silencing alone or in combination assessed by Cell titer-Glo 3D assay and expressed as relative light unit (R.L.U). C Representative images and relative histograms of tumor spheroids morphology and diameter of H460 3D_SM, H460 3D_FBSlow, MCF7 3D_SM, and MCF7 3D_FBSlow upon ALDOC and ENO2 silencing alone or in combination. All the experiments were carried out in triplicate and results are presented as mean ± SD. p-value: * < 0.05, ** < 0.01, *** < 0.001. ns: not significant
Fig. 7
Fig. 7
ALDOC and ENO2 knock down impairs glucose and L-lactic acid amounts in H460 and MCF7 3D tumor spheroids. A-B Intracellular glucose and L-lactic acid amounts measured by luminometric assays and reported as relative light units (R.L.U.) in H460 3D_SM, H460 3D_ FBSlow, MCF7 3D_SM and MCF7 3D_ FBSlow upon ALDOC and ENO2 silencing alone. C Quantification of L-lactic acid within the culture media (extracellular) performed by emogas analysis and expressed as mmol/l in H460 3D_SM, H460 3D_ FBSlow, MCF7 3D_SM and MCF7 3D_ FBSlow upon ALDOC and ENO2 silencing alone or in combination. All the experiments were carried out in triplicate and results are presented as mean ± SD. p-value: * < 0.05, ** < 0.01, *** < 0.001. ns: not significant
Fig. 8
Fig. 8
ALDOC and ENO2 knock down reduces the sphere-forming ability of HCC827 and T47D cells. A qRT-PCR analyses of ALDOC and ENO2 in HCC827 3D_SM, HCC827 3D_FBSlow, T47D 3D_SM, and T47D 3D_FBSlow upon ALDOC and ENO2 silencing alone or in combination. B L-lactic acid production assessed in HCC827 3D_SM, HCC827 3D_FBSlow, T47D 3D_SM, and T47D 3D_FBSlow upon ALDOC and ENO2 silencing alone or in combination. C Cell viability of HCC827 3D_SM, HCC827 3D_FBSlow, T47D 3D_SM, and T47D 3D_FBSlow upon ALDOC and ENO2 silencing alone or in combination assessed by Cell titer-Glo 3D assay and expressed as relative light unit (RLU). D Representative images and relative histograms of tumor spheroids morphology and diameter of HCC827 3D_SM, HCC827 3D_FBSlow, T47D 3D_SM, and T47D 3D_FBSlow upon ALDOC and ENO2 silencing alone or in combination. All the experiments were carried out in triplicate and results are presented as mean ± SD. p-value: * < 0.05, ** < 0.01, *** < 0.001. ns: not significant

References

    1. Raimo D, di Raimo T, de Santis E, Coppola L, Rosario D’andrea M, Angelini F. Circulating tumor cells and the metastatic process: the complexity of malignancy. J Cancer Metastasis Treat. 2018;4:54. doi: 10.20517/2394-4722.2018.50. - DOI
    1. Guan X. Cancer metastases: challenges and opportunities. Acta Pharm Sin B. 2015;5:402–418. doi: 10.1016/j.apsb.2015.07.005. - DOI - PMC - PubMed
    1. Hernández-Camarero P, López-Ruiz E, Marchal JA, Perán M. Cancer: a mirrored room between tumor bulk and tumor microenvironment. J Exp Clin Cancer Res. 2021;40:1–12. doi: 10.1186/s13046-021-02022-5. - DOI - PMC - PubMed
    1. Buchheit CL, Weigel KJ, Schafer ZT. Cancer cell survival during detachment from the ECM: multiple barriers to tumour progression. Nat Rev Cancer. 2014;14:632–41. doi: 10.1038/nrc3789. - DOI - PubMed
    1. Adeshakin FO, Adeshakin AO, Afolabi LO, Yan D, Zhang G, Wan X. Mechanisms for modulating anoikis resistance in cancer and the relevance of metabolic reprogramming. Front Oncol. 2021;11:528. doi: 10.3389/fonc.2021.626577. - DOI - PMC - PubMed