[Preprint]. 2023 Mar 8:rs.3.rs-2432192.
doi: 10.21203/rs.3.rs-2432192/v1.

Noninvasive electrophysiological imaging identifies 4D uterine peristalsis patterns in subjects with normal menstrual cycles and patients with endometriosis

Affiliations

Noninvasive electrophysiological imaging identifies 4D uterine peristalsis patterns in subjects with normal menstrual cycles and patients with endometriosis

Sicheng Wang et al. Res Sq. .

Abstract

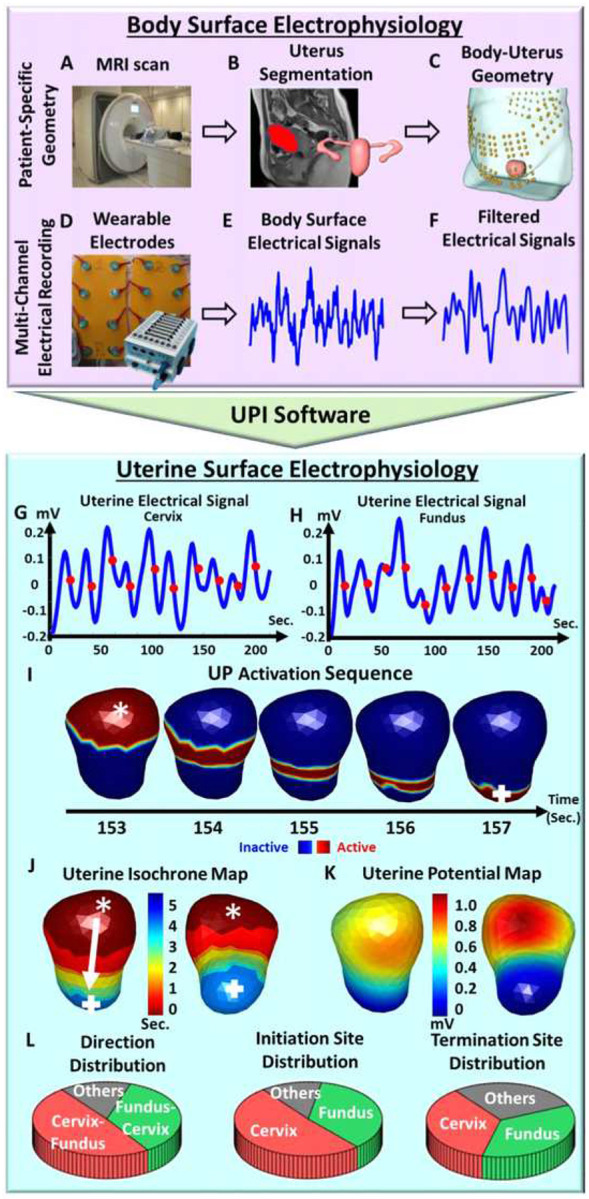
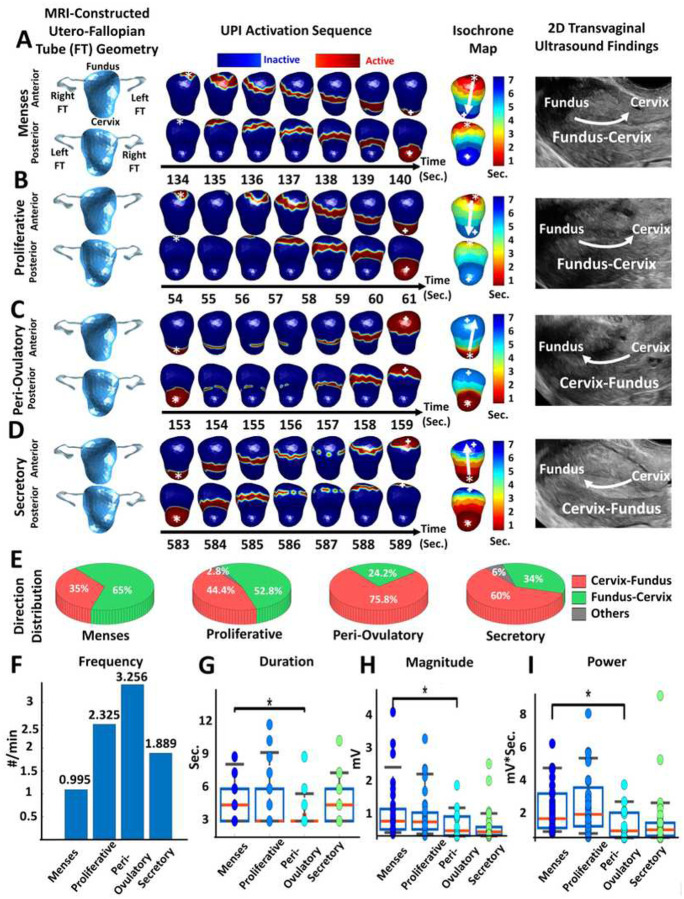
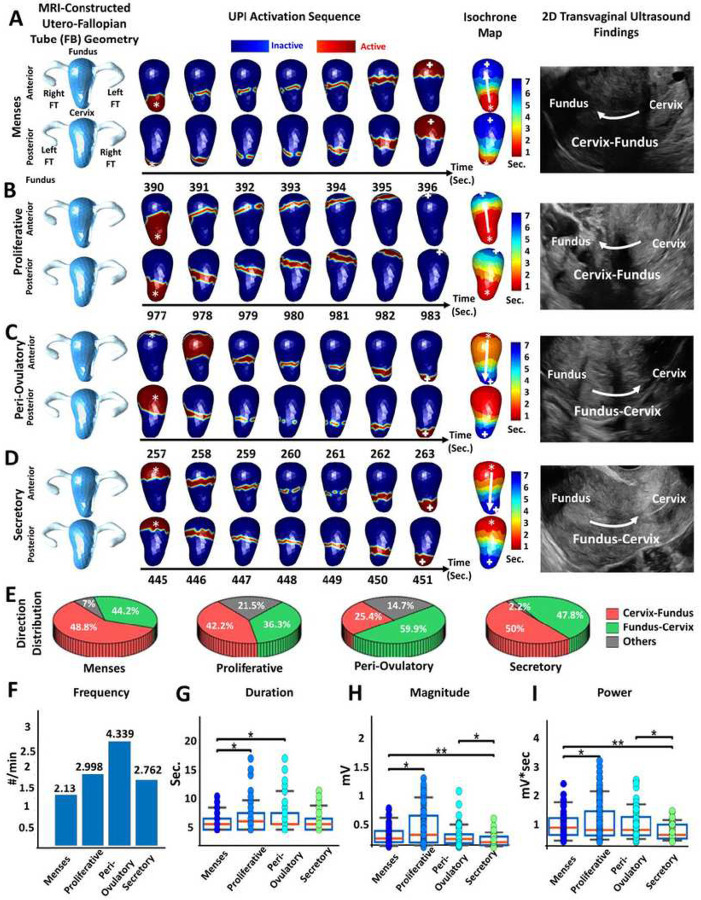
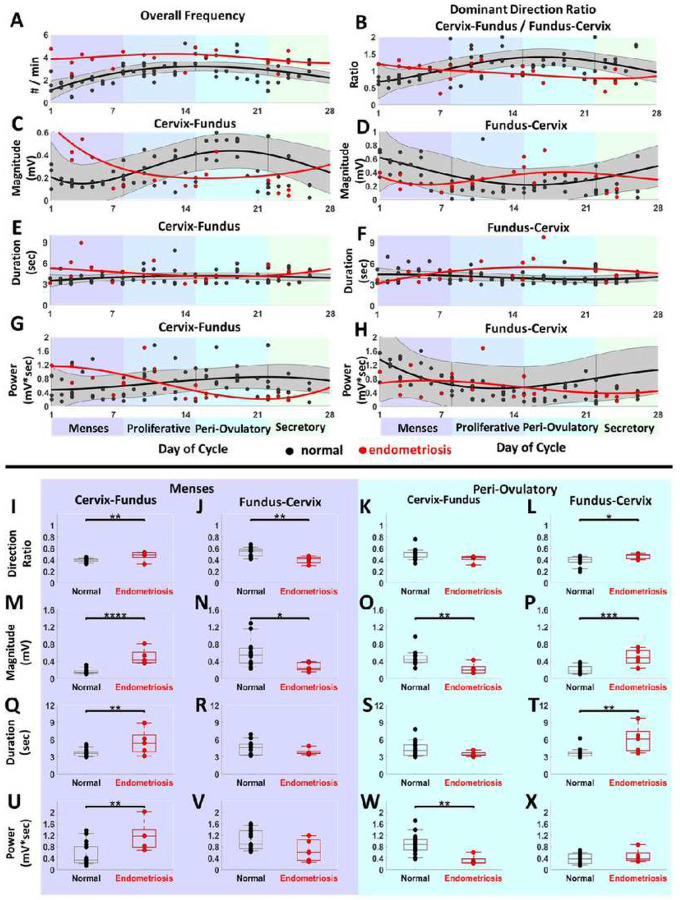
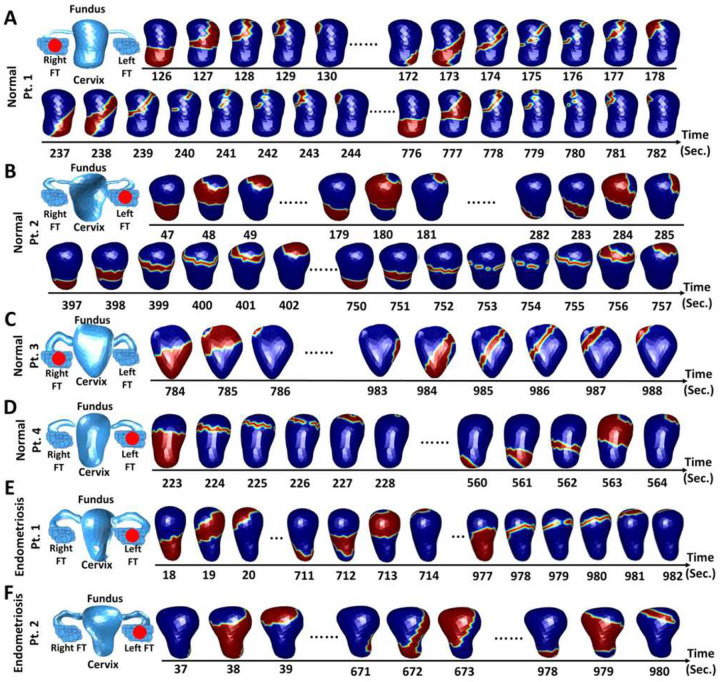
Throughout the menstrual cycle, spontaneous mild contractions in the inner layer of the uterine smooth muscle cause uterine peristalsis, which plays a critical role in normal menstruation and fertility. Disruptions in peristalsis patterns may occur in women experiencing subfertility, abnormal uterine bleeding, ovulatory dysfunction, endometriosis, and other disorders. However, current tools to measure uterine peristalsis in humans have limitations that hamper their research or clinical utilities. Here, we describe an electrophysiological imaging system to noninvasively quantify the four-dimensional (4D) electrical activation pattern during human uterine peristalsis with high spatial and temporal resolution and coverage. We longitudinally imaged 4968 uterine peristalses in 17 participants with normal gynecologic anatomy and physiology over 34 hours and 679 peristalses in 5 participants with endometriosis over 12.5 hours throughout the menstrual cycle. Our data provide quantitative evidence that uterine peristalsis changes in frequency, direction, duration, magnitude, and power throughout the menstrual cycle and is disrupted in endometriosis patients. Moreover, our data suggest that disrupted uterine peristalsis contributes to excess retrograde menstruation and infertility in patients with endometriosis and potentially contributes to infertility in this cohort.


Conflict of interest statement

Competing interests: Y.W. is a scientific consultant for Medtronic, EP solution, and has NIH research funding.

Figures

Figure 1
Figure 1
Schematic of uterine peristalsis imaging. (A) A short anatomical MRI determining uterus-body surface geometry. (B) Segmentation of body surface, uterus surface, and fallopian tubes. (C) Patient specific body-uterus geometry. (D) Electrode patches were placed on the patient’s abdomen and back to record body surface electrical signals. (E) Electrical signal measurements on the patient’s body surface. (F) Filtered electrical signals (bandwidth: 0.01–0.1 Hz). (G) Uterine surface electrical signals from one uterine surface point around the fundal region (purple star in J, K, and L). Red dots denote the points of steepest negative slope to represent the activation times during peristalsis cycles. (H) Uterine surface electrical signals from one uterine surface point around the cervical region (green square in J, K, and L). (I) Detailed activation sequence of one complete uterine peristalsis cycle initiated near the fundus and terminated near the cervix. (J) Uterine isochrone maps from the same uterine peristalsis cycle. Warm and cool colors represent early and late activation, respectively. The white arrow depicts the peristalsis propagation direction. (K) One instant uterine potential map from the same uterine peristalsis cycle in I and J represents the potential distribution over the entire 3D uterine surface. (L) Distribution of uterine peristalsis direction (Cervix-Fundus, Fundus-Cervix, others), initiation and termination sites (cervix, fundus, and other areas) analyzed from one electrical mapping. The other three electrophysiological indices, such as magnitude, duration, and power of the uterine peristalsis, were also generated (see details in Materials and Methods)
Figure 2
Figure 2
Uterine peristalsis imaging in one participant with regular menstrual cycles during four phases of the menstrual cycle. (A) Dominant Fundus-Cervix uterine peristalsis pattern during the menses phase; (B) Fundus-Cervix pattern during the proliferative phase; (C, D) Dominant Cervix-Fundus uterine peristalsis patterns during the (C) peri-ovulatory phase and (D) secretory phase; (E) Pie charts showing the uterine peristalsis direction distribution in each phase; (F) Bar graph of uterine peristalsis frequency (waves/min); (G,H,I) Boxplots of uterine peristalsis duration (downsampled to 1 Hz, seconds), magnitude (mV), and power (mV*sec) for all peristalsis waves in each phase (each dot represents one uterine peristalsis wave). In the UPI activation sequences and isochrone maps, the white asterisks indicate the peristalsis wave initiation sites, and the white arrows indicate the propagation directions. *P <0.05
Figure 3
Figure 3
Uterine peristalsis imaging in one participant with surgically confirmed endometriosis during four phases of the menstrual cycle. (A) Dominant Cervix-Fundus uterine peristalsis pattern during the menses phase;(B) Cervix-Fundus uterine peristalsis pattern during the proliferative phase; (C, D) Fundus-Cervix uterine peristalsis pattern during the (C) peri-ovulatory and (D) secretory phases; (E) Pie charts showing the uterine peristalsis direction distribution in each phase; (F) Bar plot of uterine peristalsis frequency (waves/min); (G,H,I) Boxplots of uterine peristalsis duration (downsampled to 1 Hz, seconds), magnitude (mV) and power (mV*sec) for all peristalsis waves in each phase (each dot represents one uterine peristalsis wave). In the UPI activation sequences and isochrone maps, the white asterisks indicate the peristalsis wave initiation sites, and the white arrows indicate the propagation directions. *P <0.05, **P<0.01
Figure 4
Figure 4
Longitudinal study of uterine peristalsis in normal participants and participants with endometriosis throughout the menstrual cycle. (A-H) Multi-parametric uterine peristalsis quantifications in the standardized 28-day menstrual cycle. Black and red dots represent the average uterine peristalsis measurements of each participant with regular menstrual cycles and endometriosis, respectively. Black curves with grey regions show the confidence regions of fitted multi-parametric uterine peristalsis curves in participants with normal menstrual cycles. Red curves show the fitted multi-parametric uterine peristalsis curves in participants with endometriosis. (I-J, M-N, Q-R, U-V) Group difference analysis of healthy participants and endometriosis patients during the menses phase. The black/red cross in each boxplot shows the median values. (K-L, O-P, S-T, W-X) Group difference analysis of healthy participants and endometriosis patients during the peri-ovulatory phase. N= 17 healthy participants with 4968 uterine peristalsis waves and 5 participants with endometriosis with 679 uterine peristalsis waves. *P<0.05, ** P< 0.01, ***P< 0.001, ****P<0.0001
Figure 5
Figure 5
Representative asymmetric uterine peristalsis patterns in healthy participants with the normal menstrual cycle (A-D) and endometriosis patients (E-F) during the ovulatory phase. In each panel, anatomical uterus geometry with fallopian tubes was segmented from the T1-weighted and T2-weighted MRI images. Red dots indicate the ovary with the dominant follicle. (A, C) Normal patients 1 and 3 have left-dominant follicles and left-sided asymmetric uterine peristalsis propagation. (B, D) Normal participants 2 and 4 have right-dominant follicles and right-sided asymmetric uterine peristalsis propagation. (E, F) Endometriosis patients with left dominant follicles and right-sided asymmetric uterine peristalsis propagation. Patient numbers correspond with data in Table 1

References

    1. Kuijsters N. P. M. et al. Uterine peristalsis and fertility: current knowledge and future perspectives: a review and meta-analysis. Reproductive BioMedicine Online vol. 35 50–71 at 10.1016/j.rbmo.2017.03.019 (2017). - DOI - PubMed
    1. de Vries K., Lyons E. A., Ballard G., Levi C. S. & Lindsay D. J. Contractions of the inner third of the myometrium. Am. J. Obstet. Gynecol. 162, 679–682 (1990). - PubMed
    1. Lyons E. A. et al. Characterization of subendometrial myometrial contractions throughout the menstrual cycle in normal fertile women. Fertil. Steril. 55, 771–774 (1991). - PubMed
    1. Bulletti C. et al. Uterine contractility during the menstrual cycle. Hum. Reprod. 15, 81–89 (2000). - PubMed
    1. Kunz G. & Leyendecker G. Uterine peristaltic activity during the menstrual cycle: characterization, regulation, function and dysfunction. Reprod. Biomed. Online 4 Suppl 3, 5–9 (2002). - PubMed

Publication types

LinkOut - more resources