[Preprint]. 2023 Mar 8:2023.03.06.531356.
doi: 10.1101/2023.03.06.531356.

Transcriptional adaptation of drug-tolerant Mycobacterium tuberculosis in mice

Affiliations

Transcriptional adaptation of drug-tolerant Mycobacterium tuberculosis in mice

Elizabeth A Wynn et al. bioRxiv. .

Update in

Abstract

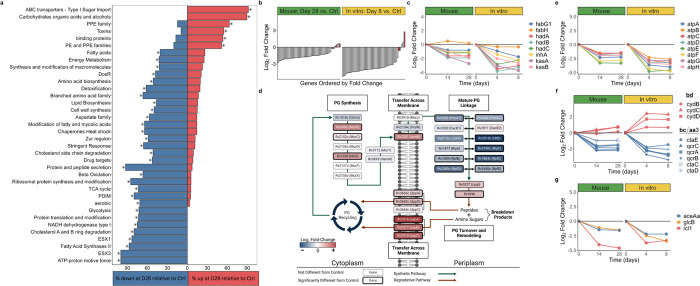
Transcriptome evaluation of Mycobacterium tuberculosis in the lungs of laboratory animals during long-term treatment has been limited by extremely low abundance of bacterial mRNA relative to eukaryotic RNA. Here we report a targeted amplification RNA sequencing method called SEARCH-TB. After confirming that SEARCH-TB recapitulates conventional RNA-seq in vitro, we applied SEARCH-TB to Mycobacterium tuberculosis-infected BALB/c mice treated for up to 28 days with the global standard isoniazid, rifampin, pyrazinamide, and ethambutol regimen. We compared results in mice with 8-day exposure to the same regimen in vitro. After treatment of mice for 28 days, SEARCH-TB suggested broad suppression of genes associated with bacterial growth, transcription, translation, synthesis of rRNA proteins and immunogenic secretory peptides. Adaptation of drug-stressed Mycobacterium tuberculosis appeared to include a metabolic transition from ATP-maximizing respiration towards lower-efficiency pathways, modification and recycling of cell wall components, large-scale regulatory reprogramming, and reconfiguration of efflux pumps expression. Despite markedly different expression at pre-treatment baseline, murine and in vitro samples had broadly similar transcriptional change during treatment. The differences observed likely indicate the importance of immunity and pharmacokinetics in the mouse. By elucidating the long-term effect of tuberculosis treatment on bacterial cellular processes in vivo, SEARCH-TB represents a highly granular pharmacodynamic monitoring tool with potential to enhance evaluation of new regimens and thereby accelerate progress towards a new generation of more effective tuberculosis treatment.


Figures

Fig. 1.
Fig. 1.. Visual summary of methods previously used to quantify the Mtb transcriptome in vivo.
Each horizontal arrow represents a distinct combination of enrichment and quantification. Varying enrichment methods are represented via the symbols shown in the key. SEARCH-TB is a unique combination of enrichment (eukaryotic cell lysis + targeted amplification) followed by quantification via RNA-seq that has enabled transcriptome evaluation in mice treated for weeks with a potent combination regimen. Image created with Biorender.com.
Fig. 2.
Fig. 2.. Evaluation of SEARCH-TB platform.
a. Distribution of log2 fold differences of normalized gDNA SEARCH-TB expression data relative to the value expected if there were no amplification bias. Zero (dashed vertical line) represents no amplification bias. b. Evaluation of repeatability of SEARCH-TB showing normalized expression data (log counts per million) for two technical replicates in which Mtb RNA was spiked into human lung RNA. c-d. Volcano plot showing log2 fold-changes and −log10 p-values induced by in vitro INH exposure as quantified by RNA-seq (c) and SEARCH-TB (d). Genes significantly down- and upregulated with INH exposure relative to control (adj. p-value< 0.05) are shown in blue and red. e. Comparison of differential expression between INH treated samples and control samples from RNA-seq or SEARCH-TB data. Purple shading indicates genes with concordant fold-change direction and significance between RNA-seq and SEARCH-TB. green shading indicates genes that were significant in RNA-seq or SEARCH-TB results, but not both. Gold shading indicates genes that were significant for both RNA-seq and SEARCH-TB, but in opposite directions. Gray shading indicates genes that were not significantly differentially expressed in either RNA-seq or SEARCH-TB. f. Comparison of INH vs. control fold-changes from RNA-seq data vs. SEARCH-TB data. Purple, green, gold and gray colors have the same meaning as in e.
Fig. 3.
Fig. 3.. Overview of transcriptional response to HRZE in mice and in vitro experiments.
a. Principal components plot including all mouse (triangles) and in vitro (squares) samples. Time points are shown by color. b. Volcano plot summarizing the differential expression between Mtb in mice and in vitro prior to treatment. Genes significantly down- (blue) or upregulated (red) in mice relative to in vitro (adj-P-value< 0.05) are shown. c. Mtb CFU and RS ratio values for control mouse samples and 14- or 28- days after HRZE treatment initiation. d-e. Volcano plots summarizing the differential expression between Mtb in 14-day HRZE treated and control mouse samples (d) and 28-day HRZE treated and control mouse samples (e). f. Estimated gene expression over time in mice. Genes that were significantly differentially expressed between at least two treatment time points are shown (N=2,429). Values are row-scaled, with red and blue indicating higher and lower expression, respectively. Hierarchical clustering of genes identified four broad patterns. g. Average log2 fold change for each of the four clusters relative to control. Values above and below zero represent up- and downregulation relative to control, respectively. h. Comparison of differential expression between mouse (day 28) or in vitro (day 8) relative to respective controls. Purple shading indicates genes with concordant fold-change direction and significance between mouse and in vitro experiments. Green shading indicates genes that were significant for either mouse or in vitro experiments but not both. Gold shading indicates genes that were significant for both mouse and in vitro experiments but in opposite directions. Gray shading indicates the genes that were not differentially expressed with HRZE treatment either in mouse or in vitro experiments. i. Comparison of fold-changes between mouse (day 28) or in vitro (day 8) relative to respective controls. Purple, green, gold, and gray colors have the same meaning as in h.
Fig. 4
Fig. 4. Summary of gene set enrichment and transcriptional changes in biological processes.
a. Gene categories significantly enriched for genes differentially expressed between day 28 and control murine samples. The percentage of genes in each category significantly up- (red) or down- (blue) regulated for each comparison is illustrated. Asterisks indicate statistical significance (adj-P<0.05). b. Fold-change of ribosomal protein genes in mice at day 28 (left) and in vitro (right) at day 8, relative to control. Red bars indicate the four alternative C-ribosomal protein paralogs. c, e-g Fold-change values in mice at days 14 and 28 (left) and in vitro (right) at days 4 and 8, relative to control for FAS-II (c), ATP synthetase (e), cytochrome bcc/aa3 supercomplex and the bd oxidase (f), and glyoxylate bypass (g) gene sets. d. Graphical representation of changes in the peptidoglycan synthesis, modification, and recycling pathways in mice at day 28 relative to control. Log2 fold-change values for genes in the process are indicated by the color of each box and the bolded outlines of boxes represent genes that are significantly differentially expressed. Figure adapted from Maitra et al., 2019. Image created with Biorender.com.
Fig. 5
Fig. 5. Summary of transcriptional changes in biological processes.
a. Log2 fold-change values for genes in the cholesterol degradation pathway for mice at day 28 and in vitro at day 8, relative to control. Deeper red values represent higher upregulation of genes after drug treatment relative to control, while deeper blue values represent higher downregulation. Figure adapted from Pawełczyk et al., 2021. b-g. Fold-change in mice (left) and in vitro (right), relative to control for heat shock proteins (red bar represents hspX) (b), dosR (c), antigen 85 (d), ESX-1 (red bar represents esxA, blue bar represents esxB) (e), the Rv2686c-2688c efflux pump (f), and the DrrABC efflux pump (g) gene sets.

References

    1. World Health Organization. Global tuberculosis report 2020. (2020).
    1. Connolly L. E., Edelstein P. H. & Ramakrishnan L. Why is long-term therapy required to cure tuberculosis? PLoS Med. 4, e120 (2007). - PMC - PubMed
    1. Mitchison D. A. Basic mechanisms of chemotherapy. Chest 76, 771–780 (1979). - PubMed
    1. Jindani A., Aber V. R., Edwards E. A. & Mitchison D. A. The early bactericidal activity of drugs in patients with pulmonary tuberculosis. Am. Rev. Respir. Dis. 121, 939–949 (1980). - PubMed
    1. Jindani A., Doré C. J. & Mitchison D. A. Bactericidal and sterilizing activities of antituberculosis drugs during the first 14 days. Am. J. Respir. Crit. Care Med. 167, 1348–1354 (2003). - PubMed

Publication types

LinkOut - more resources